Indicator Report
13. Energy
Objectives
Energy consumption and energy supply are paramount activity areas for achieving sustainable development. Therefore, anthropogenic climate change and SO2 and NOX emissions must be limited, but in a way that maintains balance in the economy. Therefore, there must be efforts for stable and costeffective energy supply.
The Danish Government will liberalise the Danish electricity and gas markets in order to improve energy production efficiency, reduce energy prices, and ensure that energy is produced with less pressure on the environment. The Danish Government will also strive for more coordination in energy policy across borders, not least in the EU, so that the price of energy in individual countries reflects the actual cost, including the environmental cost. Denmark has entered into ambitious international obligations to reduce the negative impacts of energy on the environment. With its commitment to reducing emissions of six greenhouse gases by 21 per cent compared to 1990 levels between 2008-12, Denmark will make a significant contribution to the Kyoto Protocol and thus to countering global climate change. Furthermore, Denmark intends to reduce SO2 emissions by about 30 per cent and NOX emissions by about 45 per cent compared to 1998 levels by the end of 2010.
Developments - a summary
Gross energy consumption has remained relatively stable in the last ten years, whereas the composition of fuel consumption has changed radically. In 2000, the adjusted CO2 emissions were 2.1 per cent lower than the year before, and compared to 1988 levels there has been a decrease of 11 per cent. Reducing CO2 emissions is a main objective within Danish energy policy.
SO2 emissions in Denmark have fallen in relation to gross energy consumption. The development has been pronounced: from SO2 emissions of 452,000 tonnes in 1980 to approximately 55,000 tonnes in 1999 and approximately 28,000 tonnes in 2000. This reduction was primarily caused by use of fuels with lower sulphur contents, increasing use of desulphurisation plants, and increasing use of natural gas and renewable energy. NOX emissions in relation to gross energy consumption have also decreased in the last 10 to 12 years. The reasons for this decrease include use of cars with catalytic converters and remediation systems at power plants, but increased use of natural gas and renewable energy also plays a part.
Energy intensity within production fell by 4.5 per cent from 1988 to 2000. Within agriculture and horticulture, energy intensity fell up until 1993, but has remained more or less unchanged since then. It is estimated that there is a potential for further energy savings.
Joint production of electricity and district heating has increased throughout the last 20 years. I 2000, more than 54 per cent of all domestic electricity supply came from combined heat and power plants. The corresponding share in 1990 was 29 per cent, while the 1980 figure was 19 per cent. In 2000, more than 80 per cent of all district heating was produced simultaneously with electricity. The corresponding figures in 1990 and 1980 were 60 and almost 40 per cent, respectively. This utilises the large amounts of heat generated in the course of traditional electricity production.
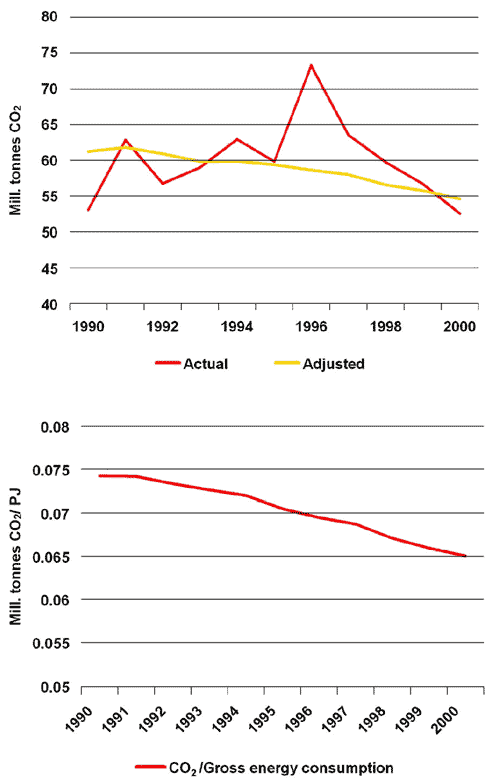
Indicator 13.1:
CO2 emissions in million tonnes, actual and adjusted, and in
relation to gross energy consumption
Source: The Danish Energy Authority, Energy Statistics 2000
This indicator illustrates trends as regard CO2 emissions. CO2 constitutes the main climate problem because of the enormous quantities accumulated in the atmosphere. The uppermost figure shows the actual and adjusted emissions. "Adjusted" means that account has been taken of variations which are dictated by the climate, as well as of variations caused by fluctuations in net exports of electricity. The bottom figure illustrates gross energy consumption.
Gross energy consumption has remained relatively stable in the last ten years, whereas the composition of fuel consumption has changed radically. In 2000, the adjusted CO2 emissions were 2.1 per cent lower than the year before. In relation to 1988, the reduction was 11 per cent.
Reducing CO2 emissions is a main objective in Danish energy policy, and the national objective is a 20 per cent reduction in emissions from energy consumption during the period 1988 to 2005. Adjusted figures for CO2 emissions are used to evaluate developments in relation to the national objective. In 2000, a reduction of 11 per cent had been achieved.
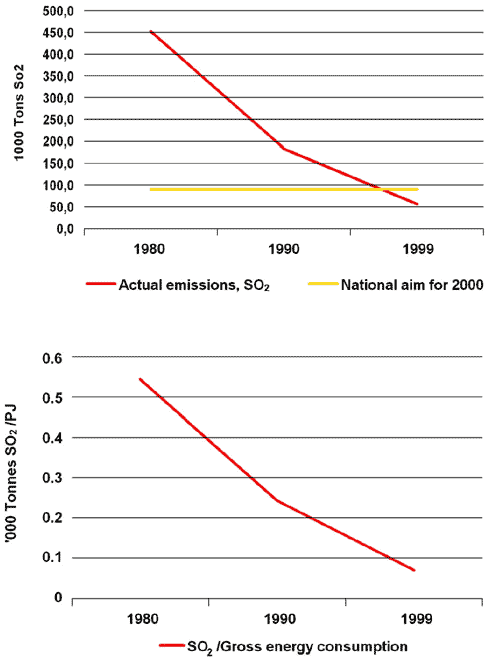
Indicator 13.2:
SO2 emissions in million tonnes in actual figures and in relation to
gross energy consumption in PJ
Source: The National Environmental Research Institute, Denmark
This indicator illustrates trends as regards SO2 emissions. SO2 is the main pollutant to be considered in relation to acidification, which is a major problem in e.g. Norway and Sweden (partly due to emissions transferred across national boundaries). By far the most important source of SO2 emissions is combustion of fossil fuels, particularly combustion of oil and coal within the electricity generation sector.
Emission reductions have been pronounced: from SO2 emissions of 452,000 tonnes in 1980 to approximately 55,000 tonnes in 1999 and approximately 28,000 tonnes in 2000. This is primarily the result of the introduction of desulphurisation systems within the electricity and district heating sector, as well as of increasing use of natural gas and renewable energy. SO2 emissions in Denmark have also fallen in relation to gross energy consumption. The reduction in relation to the gross energy consumption was primarily caused by the use of fuels with lower sulphur contents, increasing use of desulphurisation plants, and increasing use of natural gas and renewable energy.
Denmark's international commitment in 2010 within the EU and the ECE is 55,000 tonnes. Within the UN (ECE), Denmark is committed to complying with the Sulphur Protocol, which means that SO2 emissions should be reduced by 80 per cent from 1980 to 2000. This target was met in 1998. The new SO2 objective under the auspices of the ECE is for Denmark to reduce SO2 emissions by 70 per cent in 2010 in relation to 1990.
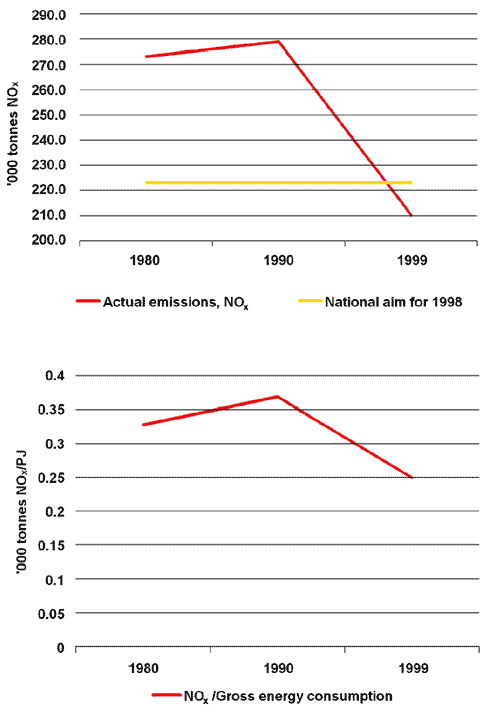
Indicator 13.3:
NOX emissions in million tonnes in relation to gross energy
consumption in PJ Source: The National Environmental Research Institute, Denmark
This indicator illustrates trends as regards NOX emissions. It is important to curb NOX emissions, e.g. because of its ability to combine with VOC to produce ground-level ozone, which is a significant problem in large parts of Europe, both in relation to health and the environment.
NOX emissions in relation to gross energy consumption have decreased in the last 10 to 12 years. The reasons for this decrease include use of cars with catalytic converters and remediation systems at power plants, but increased use of natural gas and renewable energy also plays a part.
Denmark's international commitment in 2010 within the EU and the ECE is a reduction of 127,000 tonnes NOX. It is expected that Denmark will be able to honour its commitment in the target year, 2010. The means employed to do so will be further use of catalytic converters on cars, further NOX cleaning at power plants, and increased use of natural gas and renewable energy.
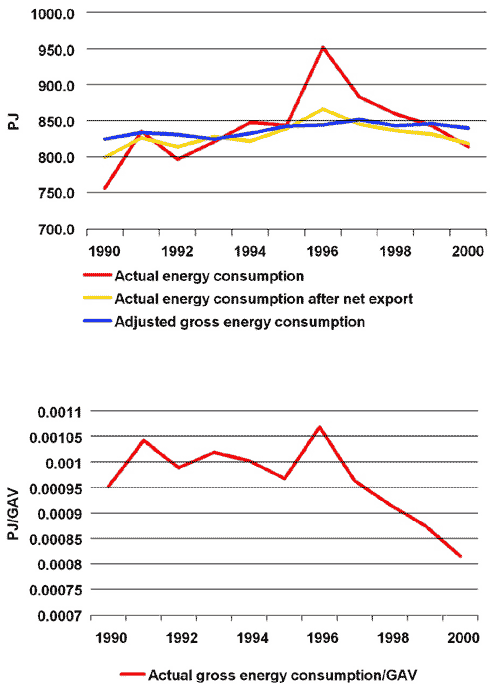
Indicator 13.4:
Gross energy consumption in PJ and final energy consumption in PJ
Source: The Danish Energy Authority
This indicator elucidates the total efforts made to reduce energy consumption. The actual energy consumption denotes registered energy consumption within a calendar year. The gross energy consumption (actual) is calculated by adjusting the annual energy consumption for fuel consumption associated with foreign trade in electricity. The adjusted gross energy consumption also includes corrections for climate variations in relation to a standard year. The objective is to arrive at a clearer picture of the trends regarding domestic energy consumption.
In 2000, the adjusted gross energy consumption was 843 PJ, and this figure has changed little since 1990. The actual gross energy consumption in 2000 was 813 PJ, which is 3.5 per cent less than in 1999. In relation to 1990, it is 7.5 per cent higher, a fact which should be considered in light of a considerable net import of electricity in 1990 compared to more modest imports in 2000.
The objective is to ensure a more consistent reduction in gross energy consumption.
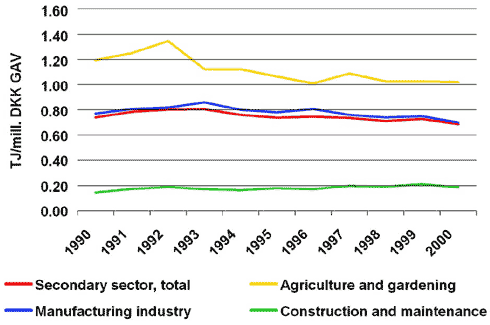
Indicator 13.5:
Energy intensity for all production trades, and for agriculture and
horticulture Source: The Danish Energy Authority
This indicator elucidates the total efforts made to reduce energy consumption. The energy intensity has been calculated as energy consumption (adjusted for climate variations) in relation to gross value added (GVA) at constant 1995 prices.
Energy intensity within production fell by 4.5 per cent from 1998 to 2000. The energy intensity rose by 12 per cent up until 1993, and subsequently fell. Energy intensity within manufacturing and building and construction has shown similar developments. Here, intensity rose by 12 per cent from 1988 to 1993, whereas it fell 19 per cent from 1993 to 2000. Within agriculture and horticulture, energy intensity fell up until 1993, but has remained more or less unchanged since then.
Despite the downward trend, there is still a need for better planning, coordination and prioritisation of the overall energysaving initiatives.
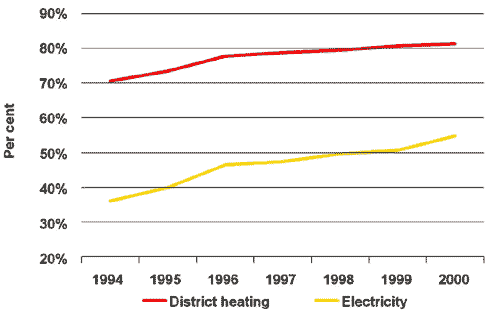
Indicator 13.6:
Combined heat and power as a proportion of thermal electricity production Source: The
Danish Energy Authority
This indicator elucidates the total efforts made to reduce energy consumption. Danish energy policy places great emphasis on producing electricity and district heating as part of the same production process. This makes it possible to utilise the large amounts of heat generated in the course of traditional electricity production.
In 2000, more than 54 per cent of all domestic electricity supply came from electricity manufactured simultaneously with heating. The corresponding share in 1990 was 29 per cent, while the 1980 figure was 19 per cent. In 2000, more than 80 per cent of all district heating was produced simultaneously with electricity. The corresponding figures in 1990 and 1980 were 60 and almost 40 per cent, respectively.
The developments regarding the proportion of combined heat and power within thermal electricity production contributes to the overall objective on energy savings.