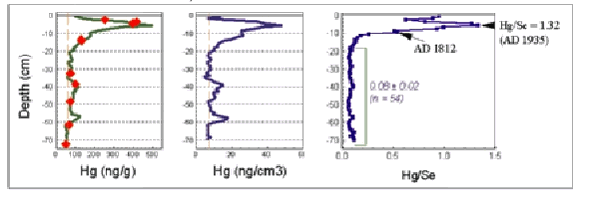
Figure 1 Gravimetric and volumetric mercury concentrations and the mercury selenium ratio of the Myrarnar (NEO) peat core sampled in May 2000 (by M. Goodsite, and W. Shotyk), and archived at the Institute of Environmental Geochemistry, University of Heidelberg. Solid lines are mercury concentrations measured in whole, air dried bulk peat samples by N. Givelet, University of Berne, using the LECO AMA-254 mercury analyser. Diamonds are mercury concentrations measured in acid digests of sub-samples by Stephen Norton using atomic fluorescence spectroscopy at the Univ. of Maine. Selenium concentrations were measured by Andriy Cheburkin, in solid peat samples using the EMMA x-ray fluorescence analyser. Notice that the Hg/Se ratio in the sample dated 1935 (using 210-Pb)was 1.32. In contrast, the pre- industrial long term average value for Hg/Se in all of the samples below 20 cm, averages 0.08 +/- 0.02.
|