Figure 12. Comparisons between observed (blue curve) and calculated daily mean of Hg0 with two model versions, one without depletion (red) and one with depletion (black) (top) , the total particulate mercury (middle) and total reactive gaseous mercury (bottom) for Faroe Island.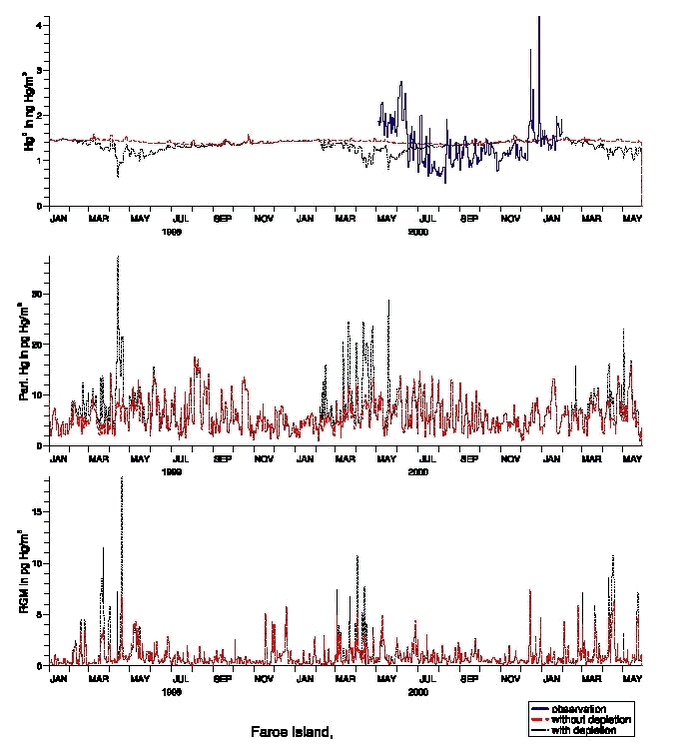
|