|
Waste Indicators 5 Results of calculationsThe calculation of indicator values for the three waste fractions: paper and cardboard, glass packaging and aluminium is based on factors for resources, energy and landfilling as calculated in Chapter 4 and Appendix C. Factors can by multiplied by the waste quantities for the different treatment options, thus giving indicator values. The calculation is described in more detail in Chapter 4, and results are presented and commented on below. First, waste quantities behind indicator calculations are presented with results for both Model A and Model B (Chapter 5.1). The two forms of presentation are described in more detail in Chapter 1. Then the calculation factors used in Model A are presented and commented on (Chapter 5.2). In Chapter 5.3 results for indicator calculations cf. Model A are presented. Chapter 5.4 gives a short description of how to handle the calculation with waste data and indicator values forming the basis for the presentation Model B. In Model B focus is put on benefits from the actual waste management option compared to landfilling of all waste. The two models are not only different in their way of presenting results, but also in contents of the presentation. In practice, the same basic data is used. The most significant difference in the data basis is that where Model A requires knowledge of total consumption of materials in society and waste treatment, Model B only requires specific knowledge of waste treatment and actual potential for recycling materials. This is explained in more detail in Chapter 5.4. 5.1 Waste quantities for calculationsThe calculated factors for each material are multiplied by waste quantities distributed by treatment option. Waste quantities can be seen in Table 5.1. The basis for calculating quantities is explained in Chapter 4 and Appendix C. Table 5.1
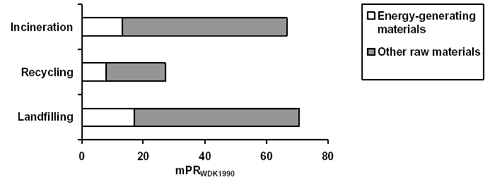
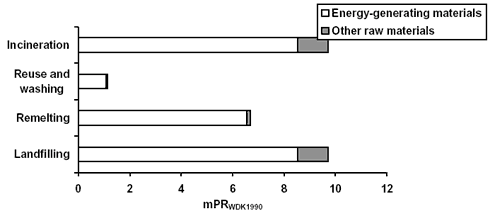
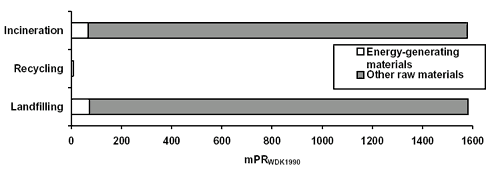
* excl. deposit-return bottles 5.2 Presentation of calculation factorsFactors used for Model A in the calculation of indicators are shown in Table 4.3. Factors are further illustrated in the following figures. The data basis for calculations of the different factors for the three material fractions and relevant treatment options is provided in Appendix D (not translated). 5.2.1 Resource factorsResource values are stated in PR – person reserves, expressing consumption related to known reserves of a given resource per person in the world (see Glossary). The calculation of the resource factor for a material fraction is based on a statement of resource factors for each individual resource used in the production of a material fraction. The contribution from each individual resource for each material fraction appears from Appendix D (not translated). Comments on the following figures are based on the underlying values. Figure 5.1 shows that for paper the non-energy-related resource consumption has the highest weight, which is mainly due to consumption of the resource sulphur for the production of paper. The large weight attributed to sulphur in the statement is due to sulphur having a short supply perspective, when only traditionally available sources are taken into account. However, large sulphur resources are bound in fossil fuels, and they are increasingly exploited today. Therefore, it may be argued that the resource statement for sulphur should give a lower value, taking such sources into account (see Appendix C). In the EDIP project, the normalisation of sulphur has been disregarded (setting the value = 0), which does not seem correct either. The example thus indicates that the LCA methodology is still under development. For glass packaging, by contrast, energy-generating materials have the highest weight (see Figure 5.2). The result is that from a resource perspective the difference between recycling and landfilling glass is not very large, since there is considerable energy consumption associated with glass remelting, whereas there is large benefit from reuse of glass packaging without remelting. In terms of resources (and also energy) large benefits can thus be obtained from reusing a large amount directly as glass packaging compared to recycling glass from cullet. Total resource consumption associated with the treatment of 1 tonne of aluminium appears from Figure 5.3. Upon recycling or incineration secondary materials are generated, thus saving virgin materials, aluminium and sand/gravel respectively. As the figure and Table 4.3 shows, resource savings from incineration of aluminium are insignificant compared to resource consumption for production of virgin aluminium for substitution of what was lost. However, this is based on the assumption of aluminium being completely incinerated (see Appendix C). For resource factors (see Figures 5.1 to 5.3) it is evident that aluminium is markedly different from the two other material fractions, as the factor per tonne is 30 times higher than for paper and 150 times higher than for glass. The reason is that the use of bauxite for aluminium production has a high weight despite a long supply perspective for bauxite. The use of energy-generating materials only contributes little to the total resource consumption associated with the production of aluminium, as hydropower is used extensively, weighing very little in terms of resources (see Figure 5.3). The contribution from the different raw materials to the resource factors can be seen in Appendix D (not translated). Thus, it is also possible to break down contributions between renewable and non-renewable resources, as in Figures 5.4 to 5.6. In general, renewable resources only have low weight, which is due to the statement method (see Glossary).
Figure 5.1
Figure 5. 2Total resource consumption associated with treatment of 1 tonne of glass and production of substitute material for different waste treatment options.
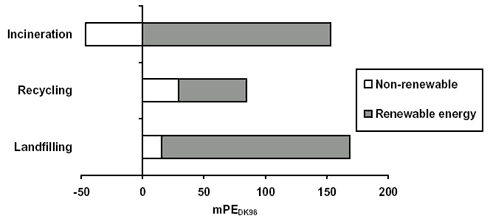
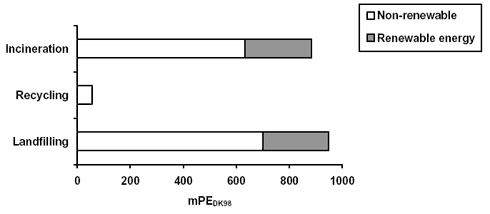
Figure 5. 3Total resource consumption associated with treatment of 1 tonne of aluminium and production of substitute material for different waste treatment options. 5.2.2 Energy factorsThe energy factor expresses how much net primary energy (see Glossary) is used for different treatments of the three waste fractions. The unit here is mPEDK98 per 1,000 tonnes of material. Primary energy consumption in Denmark in 1998 was 160 GJ per person, and one mPE therefore equals 160 MJ. Energy consumption as an indicator is particularly applicable as a total measurement of environmental impacts from use of energy, and in contrast to the resource factor, it weighs renewable and non-renewable resources against each other. Figures 5.4 to 5.6 therefore state which part of energy consumption derives from renewable and which part derives from non-renewable energy resources. Virgin paper is primarily produced with renewable energy resources: wood and hydropower. Figure 5.4 shows that paper upon incineration substitutes non-renewable energy resources. Stated in person-equivalents the result upon incineration of paper is a primary energy consumption in the form of renewable energy resources of over 100 mPE/tonne, which is slightly more than upon recycling of paper. Thus, the calculation shows that despite energy recovery upon waste incineration there is a benefit in terms of energy from paper recycling, even though this benefit should be compared to the larger consumption of non-renewable energy sources upon recycling. Energy consumption upon recycling of paper, however, is in the range of 50% of energy consumption of production of virgin paper.
Figure 5.4
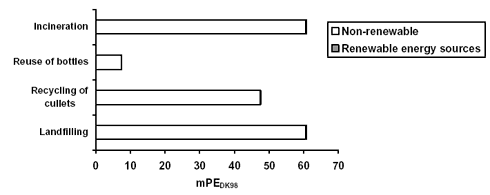
Figure 5.5 Figure 5.5 shows that for glass packaging primary energy consumption upon reuse of glass is markedly lower than upon remelting of cullet. However, remelting is slightly better than landfilling, if only primary energy consumption is taken into account. Figure 5.6 shows that primary energy consumption upon recycling of aluminium is considerably lower than for other waste management options – which is not surprising. It is also seen that even if it is assumed that aluminium burns upon incineration (see Appendix C), the energy benefit gained is relatively small compared to the benefit from recycling.
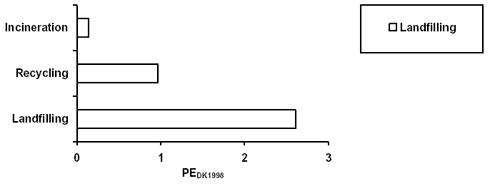
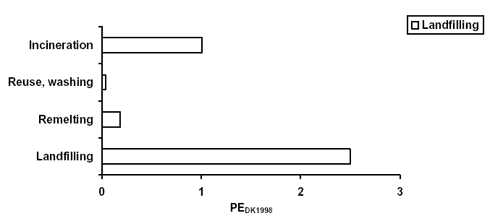
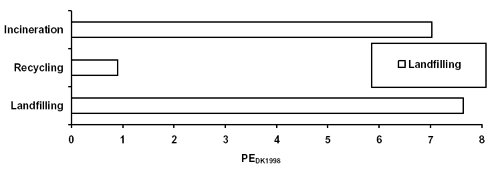
Figure 5.6 5.2.3 Landfill factorsThe landfill factor expresses how much waste for landfilling is generated upon different management options for the three waste fractions. The unit is PEDK98 per 1,000 tonnes of material. The quantity of waste landfilled in Denmark in 1998 was 403 kg/capita, so one PE of waste for landfilling = 403 kg. Figure 5.7 shows that upon landfilling of paper, the amount is just above the 2.5 PE that paper for landfilling constitutes by itself. This is due to the fact that some waste is landfilled in connection with production of paper. Upon recycling of paper, landfilling of waste paper from the recycling process takes place – particularly filler material from paper often ends up in sludge for landfilling. Incineration of paper generates some slag, which is mainly due to the contents of unburnable filler material in the paper. At the same time, incineration also gives savings in primary energy such as coal, and thus saves waste for landfilling from extraction and combustion of coal. Quantities are smaller for incineration of paper compared to recycling mainly due to the fact that a very large part of slag from incineration is used for building and construction purposes, thus counting as recycling and not taking up space for landfilling. For glass (Figure 5.8) just about the same quantity is landfilled as for glass for landfilling by itself – so there is no significant contribution in connection with the production of glass. Furthermore, the quantity for landfilling upon incineration constitutes 40% of total quantities, as 60% of slag from incineration is recycled for building and construction purposes. Recycling and reuse cause only a small amount for landfilling. Figure 5.9 shows landfilling of waste from the different waste management options for aluminium. In addition to the quantity landfilled virgin aluminium must be produced, causing very large quantities for landfilling. Also upon incineration, aluminium will have to be substituted, and considerable quantities of slag are generated. Slag quantities are around double the quantity of aluminium, under the assumption that incineration is complete (see Appendix C). This is due to the fact that aluminium oxide is generated upon incineration. In return, around 60% of slag is recycled as backfilling. The result is that for landfill requirement there is no significant difference between direct landfilling and incineration of aluminium. Only upon recycling is a substantial reduction in landfill requirement achieved.
Figure 5.7
Figure 5.8
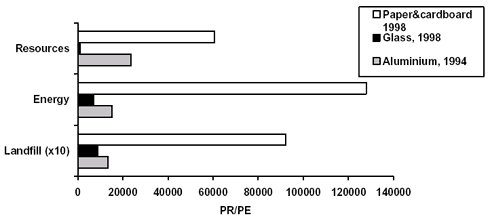
Figure 5.9 5.2.4 Differences between factors for the three materialsThere are significant differences for both energy and resource factors between recycling and other treatment of aluminium. For paper just above half of the energy and resource consumption is saved upon recycling compared to landfilling. For glass it is seen that even if materials are recovered, there is considerable resource and energy consumption in the range of 50-70% of consumption, if materials are landfilled. For energy factors the difference between aluminium and the other materials is less marked, but still significant (see Figures 5.4 to 5.6). Naturally, the situation is different for the landfill factor, where there is a significant effect of recycling (see Figures 5.7 to 5.9). The landfill factor is around three times higher for aluminium for landfilling than for glass for landfilling. The difference is due to the production of primary aluminium that generates considerable quantities of waste included in the calculation. For paper, landfilling from recycling is larger than landfilling from incineration, as filler material in paper is landfilled upon recycling. Furthermore, incineration of paper leads to savings in coal, and thus there is less waste for landfilling from coal extraction and combustion. For aluminium the landfill factor is only slightly lower upon incineration than upon landfilling, as part of aluminium oxidises upon incineration, thus generating considerable waste quantities (see Appendix C). It may rightly be argued that similar oxidation will take place in the long-term upon landfilling. But in order to simplify calculations, long-term changes of materials upon landfilling have not been taken into account. Recycling of slag from incineration for backfilling etc. constitutes 60% of slag and fly ash generated /40/, which has been taken into account in calculations. 5.3 Indicators for total impact from waste (Model A)In the calculation of indicator values, factors for the three waste fractions (see Table 4.3) are multiplied by waste quantities for the different treatment options (see Table 5.1). The calculation is described in more detail in Chapter 4. Results are presented and commented on below. As seen from Figure 5.10, indicator values give slightly different pictures of the relative importance in terms of waste of material fractions upon the relevant waste treatment option. It is seen that the three indicators give significantly different results that supplement each other. For reasons of simplification, in this and the other figures on indicator values no distinction has been made between resources in energy resources and other resources. Neither has a distinction been made between primary energy in renewable and non-renewable sources. The distinction can be found in Figures 5.1 to 5.6, or in Appendix D, stating detailed results (not translated).
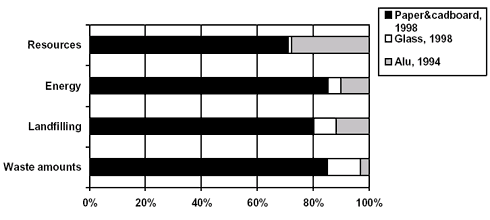
Figure 5. 10Consumption of resources, energy and landfill requirement from treatment of waste and production of substitute materials. The following units have been used: Resource consumption: PRWDK90 ,Energy consumption: PEDK98 , landfill requirement: PEwaste DK98. Values for landfill requirement must be multiplied by 10. Note that the three indicators have only been shown on the same figure for practical reasons. Each indicator should be studied separately. Results can also be illustrated relatively, as in Figure 5.11, where the three materials have been interrelated. The figure shows how much each material fraction makes up of total indicator value. Figure 5.11 shows that despite the far smaller waste quantities compared to the two other material fractions, aluminium gives a considerable contribution in terms of resource consumption. Paper gives the most significant contribution to energy, which may not be surprising. Paper also gives a significant contribution to resource consumption, this is mainly due to the large weight in terms of resources that has been attributed to sulphur in the statement. This is discussed in Chapter 5.2.1. Figure 5.11 gives an idea of the focus of the three indicators, and it shows that waste quantities by themselves give a markedly different picture. Thus, there may be good reasons to operate with several indicators to gain an adequate picture of the waste management situation.
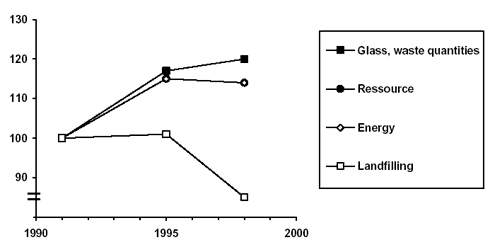
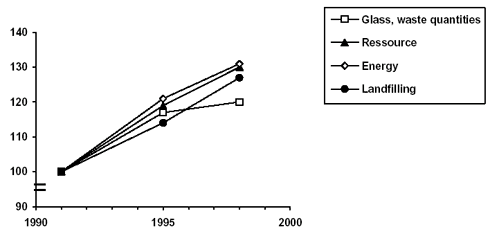
Figure 5.11 As one of the purposes of indicators is to illustrate effects from initiatives in the waste management field, it is important that indicators can be used to follow developments. Figure 5.12 shows waste quantities and the three indicators for glass stated for 1991, 1995 and 1998 and indexed on 1991. Total quantities of glass waste in the period increased by around 20%, and similarly energy and resource indicators increased by 10-15%. The lower increase in indicators is the result of increased recycling, but results show that total resource and energy consumption associated with the use of glass increased in the period despite initiatives in the waste management field. The landfill factor, by contrast, decreased by 20%, which reflects the fact that glass for incineration is partly recycled together with slag from the incineration plants.
Figure 5.12 For aluminium, a detailed material flow analysis is only available for 1994 (see Appendix C), and therefore it is not possible to make a statement where developments are followed, for example from 1991 to 1998. It is likely that increased use of civic amenity sites and schemes for collection of waste electronic and electrical equipment have led to an increase in collection of aluminium, but it is also likely that waste quantities have increased. However, without an update of the available mass-flow analysis it is not possible to reflect this development. The trial shows that it is very relevant to include metals, if the life-cycle-based indicators are to be applied to the entire waste management field. For the indicator for resource consumption a number of other metals will probably contribute considerably, similar to aluminium. In the normalisation of world resources for the different metals, even metals consumed in small amounts, but having a low rate of recycling, will contribute significantly to the weighted resource consumption. For energy consumption, aluminium weighs heavily, and other metals – apart from iron and steel – will probably contribute significantly less than aluminium. 5.4 Indicators with focus on savings realised (Model B)The difference between presentations A and B is primarily in the focus of the presentation. Whereas A focuses on total waste quantities, B focuses on savings realised in resources, energy consumption and landfilling upon the waste treatment option in question compared to 100% landfilling. The basic calculation principles for life-cycle data and quantitative data are similar for the two models. In principle, indicator values for presentation Model B can be calculated on the basis of two scenarios, one of which is the calculation for Model A, showing indicator values for the waste management option in question. The second waste treatment scenario is calculated, assuming that all waste is landfilled. Indicator values for the presentation of Model B are then found by calculating the difference between the two scenarios. This results in indicator values for resource, energy and landfill advantages realised upon the current waste management compared to 100% landfilling. Finally, a third scenario can be added where a full optimisation of waste management is assumed. The difference between this scenario and current waste management shows the potential from optimising waste management. This is also included in the presentation Model B below. In the calculation, however, the procedure has been simplified by converting factors from Model A (Table 5.1) into a set of factors for Model B (Table 5.2). The conversion has been made by calculating the difference between landfilling and other options for each individual factor and material. Basic data is thus similar to data described for Model A. The column for landfilling in Table 5.2 is 0 for all fields, and positive or zero for other treatment options. It shows that landfilling is always the poorest alternative in the examples calculated. Table 5.2
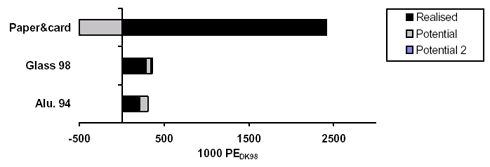
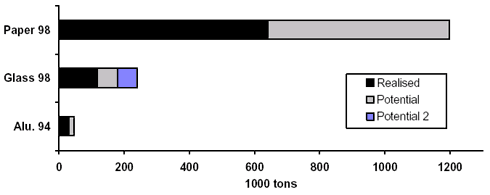
Units used:: The presentation of data in Model B matches well with the data found for waste management in waste statistics. It first and foremost shows indicator values for waste collected for reprocessing, whereas waste led to landfill does not contribute to the indicator. If the potential from an optimisation of waste management is to be calculated, data must be supplemented from other statistics than the waste statistics. In addition, it is necessary to assess how much material it is possible to collect from a waste fraction. This is discussed in the following chapters. 5.4.1 Value of recycled materials and potential savingsBelow the principles of the current optimal recycling and how they can be calculated in an indicator calculation are discussed. For example, for aluminium normal practice in connection with recycling is that a number of aluminium alloys are mixed, and that upon recycling almost exclusively high-alloy cast aluminium is produced. Opportunities for future recycling of this cast aluminium will be significantly more limited than recycling of low-alloy aluminium types. The latter constitutes the major part of aluminium disposed of today through recycling. Thus, in a long-term perspective it will be optimal to keep aluminium alloys separate in the recycling process. In the recycling process some aluminium oxidises and is landfilled in the form of aluminium oxide. In some Norwegian melting works treatment and recycling of this aluminium oxide takes place. In relation to resource savings this process will be optimal compared to the more usual melting process. The optimal recycling thus differs from the form of recycling that is generally used today. If a detailed analysis is to be made for each disposal option of the best available technique, the task of data collection and assessment would be very extensive. Therefore, it is proposed that the definition of the optimal form of recycling is handled more pragmatically, so that for example in relation to aluminium average data from European recycling industries is used, provided by the EDIP PC tool database. In addition to simplifying data collection this has the advantage of avoiding very extensive explanations of calculation assumptions. When direct recycling as a metal is compared to energy recovery upon incineration or recycling of aluminium oxide in the form of slag from waste incineration, recycling as a metal will be the optimal choice in all circumstances. In relation to current recycling the problem is more than the impacts associated with recycling; these can be determined in relation to the actual recycling (to the extent that data is available). The problem is also to determine what is actually substituted upon recycling, and what quality (value) to attribute to the recycled material. The starting point is that we wish to make a calculation covering all material recovered. How would all the aluminium produced today from recycling have been produced if there had been no recycling? And how would the district heating provided today from waste incineration have been generated if there had been no energy recovery from incineration? We actually do not know this, and particularly in the field of energy, developments will not only be governed by market economy mechanisms. Similar to the approach used for determining the optimal form of recycling we will therefore use a pragmatic approach, based on average considerations. However, for heating generation from incineration we have carried out a more detailed study in Appendix C. This means for the example of aluminium that data is used representing in the EDIP PC tool database the average for aluminium produced in Europe. For power and heating generated in Denmark we have made a specific assessment of the impact from incineration of waste at Danish waste incineration plants on consumption of coal. 5.4.2 Potential savings from optimisation of waste managementThe indicators in calculation Model B have the purpose of showing realised and potential savings in relation to the three parameters. Realised savings can be based on quite reliable quantitative data and are altogether not very debatable, whereas it is necessary to make more assumptions for potential savings. In the calculation examples used, potential savings have been calculated as follows: For paper and cardboard a theoretical potential has been used, where 87% of total paper consumption is recycled in a way similar to present recycling of paper and cardboard. It will not be possible to reach a higher rate of collection, as some paper is tissue ending up in domestic waste or in the sewer. In waste statistics /39/ the realistic potential of recycling of paper is assessed at 80%. See also Appendix C. Furthermore, it has been taken into account that paper material loses utility value upon recycling. Thus the potential is an expression of theoretical maximum limit. Further savings can be realised if paper and cardboard are reused directly, but this will probably only be practicable for a small part of transport packaging, and the amount of paper and cardboard directly that is reusable has not been estimated. For glass packaging two theoretical potentials have been stated. One level presupposes the recycling by washing glass which is reused today, whereas the rest is recovered by remelting. However, there will probably be a minor part of glass packaging that cannot be collected for recycling because of different kinds of contamination, so 100% recycling will be unachievable in practice. It should be noted that reuse of bottles for beer and soft drinks is not included in the calculation, which covers other forms of glass packaging. At the other potential level it is assumed that 100% of glass waste can be potentially reused as bottle / glass packaging – including glass currently remelted. To achieve such a high degree of reuse will probably require significant changes in the use of glass for packaging as well as a collection system where glass is not broken (for example standard packaging types as known from beer and soft drinks). Today, a significant part is broken upon collection. Thus, the potential is theoretical, but it is not possible offhand to assess the extent of a realistic potential. For aluminium 100% recovery is assumed in the calculation. In the recycling process there will be a loss in the range of 5%, which has been taken into account in this process. Thus, virgin aluminium will be added on a continuous basis, and it will be possible to have a cycle without losses due to material deterioration upon recycling. In practice, with the present use of aluminium for packaging it will be difficult (or impossible) to achieve such high rates of recycling, as part of it will end up in domestic waste. Realised and theoretical potential savings in resources, energy and landfill requirement are shown in Figures 5.13 to 5.15. For comparison, realised and potential savings stated in waste quantities are shown in Figure 5.16. Compared to paper and cardboard, and aluminium, realised savings from recycling of glass are relatively modest both in terms of resources and energy. It should be noted that reuse of bottles for beer and soft drinks is not included in the calculation. However, in terms of energy there is a potential for savings, if glass packaging is reused directly.
Figure 5.13
Figure 5.14
Figure 5.15
Figure 5.16 Figure 5.17 shows developments in realised savings associated with disposal of glass waste in the period 1991-1998. The figure is based only on calculated factors and data from the ISAG. The pattern seen is a reflection of the pattern seen in Figure 5.12, as here total savings to some extent are a function of larger waste quantities. However, there is also an effect from improved treatment options, as savings measured by the three indicators increase more than waste quantities.
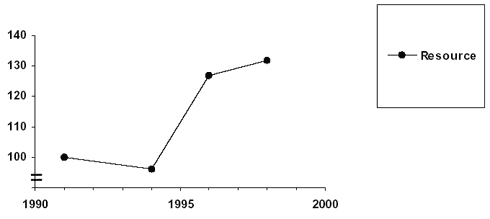
Figure 5.17 For aluminium, developments in realised savings are shown in Figure 5.18. In Appendix C a method is described – based on information from Statistics Denmark – for estimating amounts of aluminium treated upon recycling. In order to test whether the method is reliable and actually visualises developments, collected amounts have been calculated for a number of years and are shown as indexed values in Figure 5.18. Only developments in resource savings have been calculated.
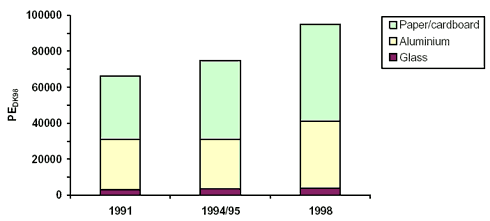
Figure 5. 18Realised resource savings from recycling aluminium in the period 1991-1998. To illustrate how the different material fractions contribute to total savings, Figure 5.19 shows data for 1991, 1995 and 1998 for energy savings realised from the actual waste treatment compared to 100% landfilling of waste. Overall, savings have increased by around 40% through the 90s.
Figure 5. 19Realised energy savings from recycling of paper and cardboard, glass and aluminium in 1991, 1994/95 (Alu:1994, others 1995) and 1998. 5.4.3 ConclusionThe different ways of presenting indicators focus on different aspects of waste treatment. One of the essential arguments for preferring presentation B to presentation A is the possibility of collecting and updating data. This is discussed in Chapter 6.
|
