|
Denmark's Third National Communication on Climate Change 3 Greenhouse gas inventory information3.1 Greenhouse gas inventoriesDenmark’s greenhouse gas inventories are prepared in accordance with the guidelines from the Intergovernmental Panel on Climate Change (IPCC) and are based on methods developed under the European CORINAIR programme (COordination of INformation on AIR emissions) for calculating national inventories1. The inventories follow the method described in CORINAIR’s guidelines2 and IPCC’s guidelines3. However, in accordance with the latter guidelines, the methods and emission factors have been modified for some of the inventories so that they reflect better Danish conditions. A description of methods, emission factors and activity data is given in Denmark’s national emission inventory reports (NIR)4 to the Climate Convention. For the last two years these reports have included data in the common reporting format(CRF). The latest NIR and the latest combined Danish inventory of greenhouse gases and other air pollutants can be seen at the National Environmental Research Institute’s website5 and in Illerup et al., 2002. Preliminary greenhouse gas inventories, for Greenland and the Faroe Islands are included in the annual inventory report to the Climate Convention. 3.2 Denmark’s emissions and removals of greenhouse gasesDenmark’s emissions of the greenhouse gases CO2 (carbon dioxide), CH4 (methane), N2O (nitrous oxide) and the so-called industrial gases, which include HFCs (hydrofluorocarbons), PFCs (perfluorocarbons) and SF6 (sulphur hexafluoride), for the period 1990 to 2001 are shown in tables 3.1-3.4 broken down into IPCC’s six main categories and the most relevant sub-categories. The total emissions of these greenhouse gases, calculated in CO2 equivalents on the basis of the individual gases’ global warming potential, is shown in table 3.5. The development 1990-2001, broken down by source in table 10 in the reporting format CRF reported in NIR 2002, is reproduced in Annex A. 3.2.1 Carbon dioxide (CO2)Almost all the CO2 emissions come from combustion of coal, oil and natural gas at power stations and in residential properties and industry, although road traffic also accounts for a considerable part of it. The relatively large fluctuations in the emissions from year to year is due to trade in electricity with other countries – mainly the Nordic countries. The large emissions in 1991 and 1996 resulted from large electricity exports. From 1990 to 1996, emissions showed a rising trend, but they have fallen since 1997 because many power stations have changed their fuel mix from coal to natural gas and renewable energy. As a result of the reduced use of coal in the last years, most of the CO2 emissions now come from combustion of oil. Emissions from road transport in 2001 accounted for more than 20% of the total CO2 emissions. Table 3.1: Table 3.2: The man-made emissions of methane (CH4) come from agriculture, landfill sites and energy production, with agriculture by far the largest source. The emissions from agriculture are due to the formation of methane in the digestive system of farm animals and due to treatment of manure. The methane emissions from landfill sites are falling because the amount of waste deposited is decreasing year by year as a consequence of the abrupt fall in the quantity of landfilled waste that has occurred since 1997. The emissions from energy production are rising because gas engines account for an increasing proportion. Gas engines have large emissions of methane compared with other combustion technologies. Table 3.3:Trend in N2O emissions 1990 - 2001 Agriculture is by far the biggest source of emissions of nitrous oxide (N2O) because this gas forms in soil during bacterial conversion of nitrogen in fertiliser and manure. Bacterial conversion of nitrogen also occurs in drain water and coastal water. This nitrogen largely comes from agriculture’s use of fertiliser, and emissions from these sources are therefore included under agriculture. It will be seen from table 3.3 that there has been a considerable fall in N2O emissions from agriculture since 1990. This is due to less and better use of fertiliser. A small part of the N2O emissions comes from the exhaust from cars fitted with a catalyser. Table 3.4:Trend in HFC, PFC and SF6 emissions 1990 - 2001
Source: National Environmental Research Institute Table 3.5: 3.2.4 The industrial gases HFCs, PFCs and SF6 The contribution of industrial greenhouse gases (HFCs, PFCs and SF6) to Denmark’s total emissions of greenhouse gases is relatively modest, but has shown the strongest percentage rise during the 1990s. The HFCs, which are primarily used within the cooling industry, contribute most to the industrial greenhouse gas emissions. In the period 1990 to 2001, HFC emissions rose from 0 tonnes to 647,000 tonnes CO2 equivalents. There has been a relatively small increase and decrease in PFC emissions, while SF6 emissions have fallen considerably in the last few years.
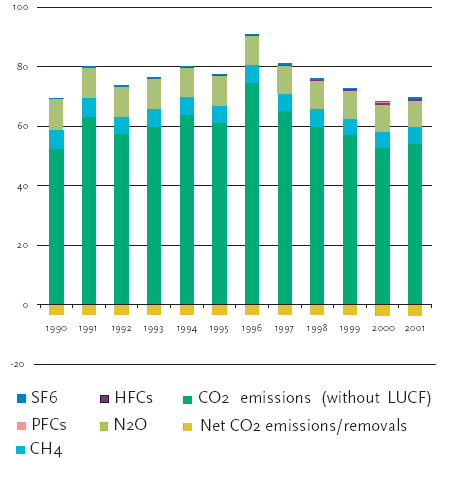
Figure 3.1: Source: National Environmental Research Institute
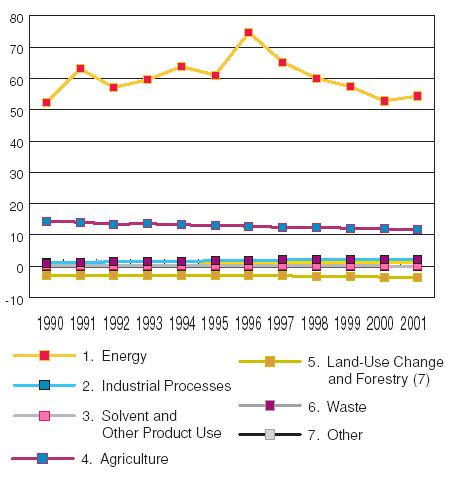
Figure 3.2 Source: National Environmental Research Institute Table 3.6. 3.2.5 Denmark’s total emissions and removals of greenhouse gases Table 3.5, figure 3.1 and figure 3.2 show the trend in Denmark’s emissions and removals of greenhouse gases, given in CO2 equivalents and broken down into gases and sources in accordance with the general rules for inventories under the Climate Convention. CO2 is the main greenhouse gas, followed by N2O and CH4. It will be seen that there was a general fall in these emissions from 1996, when total emissions were (excluding LUCF) 90.8 million tonnes CO2 equivalents, to 2000, with total emissions of 68.1 million tonnes CO2 equivalents, while the total emissions in 2001 were 69.3 million tonnes CO2 equivalents. Of the total greenhouse gas emissions in CO2 equivalents, CO2 accounted for 78%, methane for 8%, nitrous oxide for 13% and the industrial gases HFCs, PFCs and SF6 for 1% in 2001. After deduction of the CO2 removals in forests, the total net Danish greenhouse gas emissions were 65.9 million tonnes CO2 equivalents in 2001. As will be seen from section 3.4, an inventory based on the rules under the Kyoto Protocol means certain changes with respect to base year and removals in connection with land-in-use change and forestry (LUCF). 3.3 Denmark’s, Greenland’s and the Faroe Islands’ total emissions and removals of greenhouse gasesThe total inventories for Denmark, Greenland and the Faroe Islands (the Kingdom) are given in table 3.6. As will be seen, the Climate Convention’s goal of getting the level in 2000 down to the 1990 level was achieved. In 2000, the total level for Denmark, Greenland and the Faroe Islands lay 1.1% below the 1990 level. For the time being, the inventories from Greenland contain only inventories of the CO2 emissions from combustion of fossil fuels, which must, however, be regarded as by far the most important source of greenhouses gases. The inventories from the Faroe Islands include both an inventory of CO2 emissions from combustion of fossil fuels and inventories of methane and nitrous oxide emissions from agriculture. As will be seen from the table, Greenland’s and the Faroe Islands’ greenhouse gas emissions are small compared with those of Denmark (each about 1% of the total emissions), and they have been almost constant since 1990. The sudden rise in CO2 emissions in the Faroe Islands in 1999 was due to a relatively big rise in imports of coal briquettes, while a similar rise in Greenland was due to increased sales of arctic gas oil in the towns. 3.4 Preliminary inventories under the Kyoto Protocol and the EU’s burden-sharingIn sections 3.2 and 3.3, Denmark’s, Greenland’s and the Faroe Islands’ emissions and removals of greenhouse gases are calculated in accordance with the guidelines under the Climate Convention. Since the rules for inventories under the Kyoto Protocol differ on some points from the rules under the Convention, preliminary inventories are also made in accordance with the rules of the Protocol with a view to following the trend in relation to the obligation under the Protocol. In accordance with the rules of the Protocol, Denmark has chosen 1995 as the base year for industrial greenhouse gases (HFCs, PFCs and SF6), and, for the time being, the calculation under the Protocol includes only the removals occurring in forests as a consequence of afforestation since 1990. Denmark’s reduction obligation is related to the EU reduction obligation through the so-called burden-sharing agreement. The Faroe Islands are not covered by the Kyoto Protocol since territorial reservation was made in connection with Denmark’s ratification of the Protocol6. It was a condition of agreement by Denmark to a reduction contribution of 21% to the EU’s total reduction obligation of 8% from 1990 to 2008- 2012 that account be taken of Denmark’s relatively large electricity import in 1990 by adjusting CO2 emissions in 1990 so that these corresponded to the national energy consumption. It can thus be seen from Denmark’s declaration, given in connection with, that the basis for the 21% reduction contribution has been adjusted. In connection with the EU ratification of the Kyoto Protocol, Denmark gave a legal undertaking to deliver a 21% reduction on the basis of the actual emissions level in 1990. The Council decision on the EU’s ratification of the Protocol also refers to the fact that, in connection with the signing of the EU’s agreement on the distribution of burdens in June 1998, certain Member States presented assumptions concerning emissions in the base year and common and coordinated policies and measures. In June 1998, Denmark was the only country to present a declaration with written assumptions concerning the base year. In connection with the decision on ratification by the EU, the Council and the Commission agreed on a joint declaration. This stated, inter alia, that the permitted emission levels (measured in tonnes CO2 equivalents) for the period 2008-2012 should be set taking account of the assumptions concerning emissions in the base year that also appear in the relevant declarations made in connection with the signing of the agreement on the distribution of burdens in June 1998. The permitted emission levels (measured in tonnes) are to be set not later than 2006. The setting of emission levels for the Member States will not affect the EU’s total reduction target of 8% measured in tonnes. Table 3.7 shows the trend in Denmark’s emissions and removals under the Kyoto Protocol in relation to the goal of a 21% reduction from the base year (1990/95) to 2008-2012, which Denmark has given a legal undertaking to achieve. To show the importance of the above-mentioned reference and declarations, table 3.7 also shows the trend in relation to a base year in which the CO2 emissions in 1990 are adjusted for electricity imports. Table 3.7. As far as is known, the trend in Greenland’s emissions, calculated under the Kyoto Protocol,does not differ from the preliminary inventories of CO2 from use of energy calculated under the Climate Convention and appearing in table 3.6. The preliminary inventories form the basis for Denmark’s climate strategy, as described in chapter 4.
|
|||||||||||||||||||||||||||||||||||||||||||||||||||||||||||||||||||||||||||||

