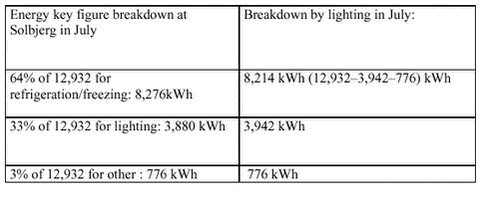
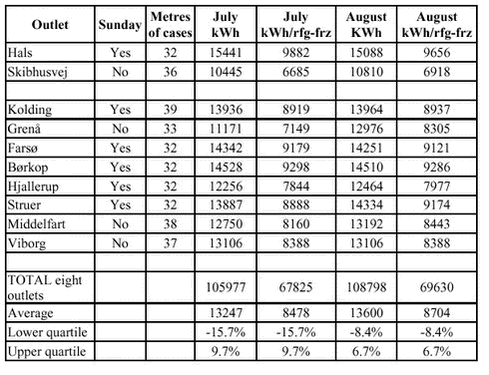
Use of Natural Refrigerants in Supermarkets4 Energy4.1 Reference outlets4.1.1 Inaccuracy 4.1.2 Random testing 4.1.2.1 Breakdown by lighting 4.1.3 Outlets 4.1.4 Total energy consumption (reference outlets) 4.2 Energy meters at Fakta Beder 4.2.1 Power consumption (outlet) 4.2.2 Energy consumption (outlet) 4.2.3 Power consumption by refrigeration/freezing component 4.2.4 Power consumption (refrigeration/freezing system) 4.2.5 Comparison between measured consumption and consumption broken by key figures 4.3 Optimisation 4.4 Conclusion (energy) The Fakta chain of supermarkets consists of about 250 outlets between 0 and 25 years old. This means that the outlets’ refrigerated installations vary and reflect developments in refrigeration technology over the past 25 years. Hence, the outlets cannot be regarded as a homogeneous quantity, but must be grouped according to age and type of installation. In recent years, new outlets have been established on the basis of a specific concept. So today a large number of outlets only vary slightly in terms of square metres, number of lights, ventilation and refrigerated installations. 4.1 Reference outletsThe outlets constituting Fakta Beder’s basis of comparison are all relatively new and more or less of the same size. They have around 32-39 metres of refrigerated equipment, comprising islands, refrigerated cabinets, refrigerated and freezer rooms, displaying foods to customers. The outlets’ total power consumption is registered monthly through the refrigeration system’s monitor and control system. The power consumption reflects the outlets’ homogeneity. The power consumption of the individual outlet depends of course on staff behaviour, geographical location of the outlet, turnover and opening hours, but variations are limited. In other words: although the power consumption is influenced by many parameters and these vary significantly, a pattern can still be seen in the breakdown of power consumption of the various outlets. The power consumption indicates when something is “normal” and when something is not normal in the individual outlet. This homogeneity results in a distribution scale for the power consumption of the Fakta chain of supermarkets. The scale is in keeping with “Industry energy analysis (supermarkets)”, category 1/2/: The accordance between the distribution scale and the breakdown of energy consumption at Fakta has been tested and established by an internal survey among thirty Fakta outlets. The scale’s accordance has also been confirmed by a new internal Fakta report, with COWI /3/ looking at ten different outlets (appendix 7) 4.1.1 InaccuracyUsing the energy consumption registered in many outlets as a reference transfers the inaccuracy of each measurement from inaccuracy relating to measuring equipment, correction factors, running hours, etc., to inaccuracy of key figures. Having many measurements for many homogeneous outlets means that the inaccuracy of key figures is reflected in the variation in consumption. 4.1.2 Random testingFakta Solbjerg is identical to Fakta Beder in many ways and also matches the reference group. The outlets are relatively new, have 32 metres of refrigerated equipment, three cash registers and electric doors. They differ in terms of ventilation, outdoor lighting and number of square metres. Fakta Solbjerg’s energy consumption for July 2001 totalled 12,932 kWh. The outlet is open Monday to Friday from 9 am to 7 pm and Saturday to Sunday from 9 am to 5 pm. The outlet’s power consumption is generated by refrigeration/freezing systems and lighting, depending on the number of opening hours plus one hour before and after opening hours (staff behaviour of Fakta Beder). Fakta Solbjerg has 192 fluorescent 58 kW lamps. 4.1.2.1 Breakdown by lightingAs regards Fakta Solbjerg, we only know the total energy consumption and the number of fluorescent lamps. Energy consumption of lighting is found by multiplying the number of lamps by the power consumption per lamp and number of running hours. The energy consumption of refrigeration/freezing is found by subtracting the energy consumption for lighting from total consumption. Consumption for other purposes is estimated at 3%. It appears that the key figure breakdown only deviates by 1-2% from the breakdown by the number of opening hours and lighting power consumption, indicating that the use of key figures to compare the energy consumption of refrigeration/freezing systems does not increase inaccuracy. 4.1.3 OutletsThe following table lists selected reference outlets and individual measurements from year 2000 (see appendix 1 for full table).
Outlets nos. 31 and 158 (the top two) are not included in the average calculation as they are outside the normal range. The other outlets are comparable. For outlets with more than 32 metres of refrigerated equipment, energy consumption has been equated to 32 metres. Allowance has also been made for outlets not usually open on Sundays. In the event that the consumption of an outlet of this group is within these limits, the situation is normal (i.e. deviations can be explained by staff behaviour, climate, different installations, etc.). 4.1.4 Total energy consumption (reference outlets)Consumption of the eight outlets for the year breaks down as follows: 4.2 Energy meters at Fakta BederFakta Beder’s power consumption is registered at three locations. In addition to the outlet’s total consumption, the total consumption is registered for refrigerated installations, i.e. compressors, fans, rail heating, case lighting, pump and defrosting heating elements, and the brine pump has an electricity meter. 4.2.1 Power consumption (outlet)Consumption breaks down as follows:
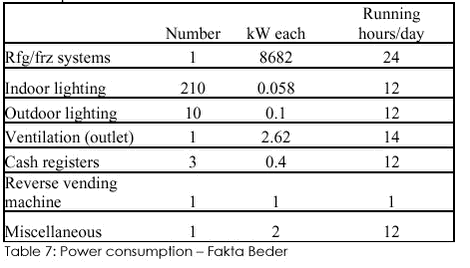
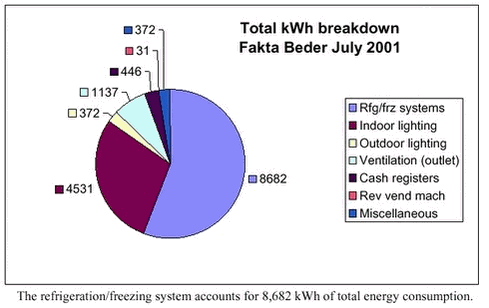
Unlike the reference outlets, Fakta Beder has a ventilation system. 4.2.2 Energy consumption (outlet)4.2.3 Power consumption by refrigeration/freezing componentThe power consumption of the individual refrigeration/freezing components breaks down as follows:
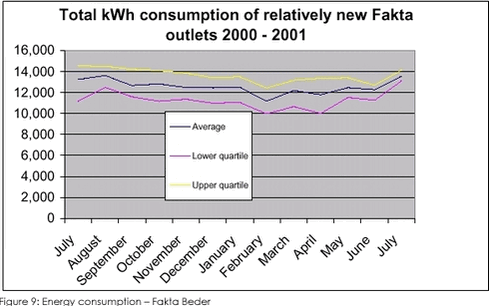
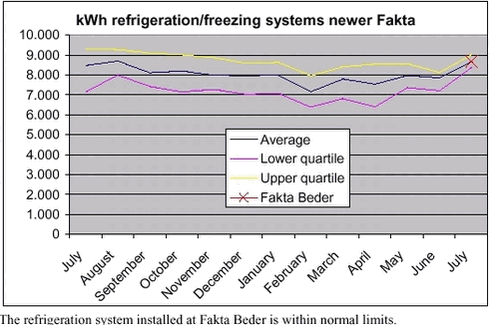
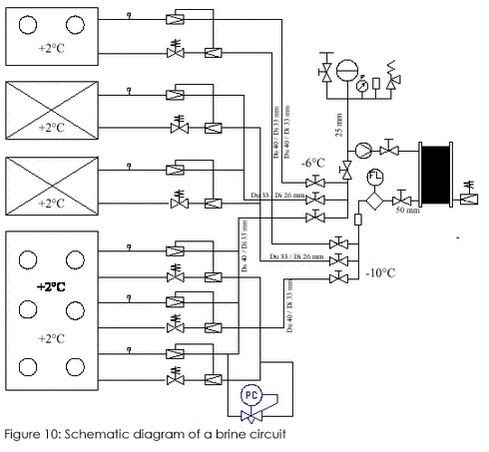
Power consumption values preceded by a tilde (~) are average values. These values are the result of measuring the change in the total power consumption of each unit at repeated starts. Other values are values specified on the unit in question. Some unit running hours have been determined on the basis of logs from the Adap-Kool system. Other running hours have been determined on the basis of system setup values. 4.2.4 Power consumption (refrigeration/freezing system)The July power consumption of the Fakta Beder refrigeration/freezing system breaks down as follows: 4.2.5 Comparison between measured consumption and consumption broken by key figuresThis chart compares the measured energy consumption of the refrigeration/freezing system installed at Fakta Beder with a reference system‘s energy consumption broken down by key figures: There are no material changes in reference outlets‘ energy consumption in July, and their consumption varies by as little as 3-4% from average energy consumption. The measured energy consumption of the Fakta Beder refrigeration/freezing system accounts for 60.1% of total equivalent consumption. The Fakta Beder system thus supports Fakta‘s energy distribution model. Yet total consumption must be adjusted for the amount of energy used for ventilation. Fakta Beder is the result of the latest concept in the Fakta chain of supermarkets, implying more square metres, more outdoor lighting, display cases adapted to lower temperatures with more hot wires to prevent condensation, etc. The model is supported despite these variations. 4.3 OptimisationThe reference systems all have direct expansion of R404A and Scroll compressors. As in all Fakta outlets, these systems are equipped with Adap-Kool controllers. As mentioned above, the system installed at Fakta Beder uses a brine circuit for refrigerated display cases and rooms. A simple on/off function was installed in July 2001 to control refrigerated surfaces. The differential pressure valve (the “PC” valve) was not installed, so the modulating temperature control function cannot be used. A modulating temperature controller is a special Danfoss thermostat for keeping the surface temperature of refrigerated surfaces constant using on/off pulsation. The solenoid valve function cannot be used without bypass control. Inadequate brine circuit control causes refrigeration compressor 2 to start too many times. The reason is that both the flow and the temperature change at great speed, causing the compressors, as a result of a high plate heat exchanger load, to quickly bring down suction pressure to its normal level. For this purpose, compressor 2 must be turned on and off quickly. Bypass control uses the buffer effect present in the brine circuit, thus reducing the number of times the compressor starts and thereby saving energy. (Optimum brine circuit control is studied in (file no. 1253/00-0023) “Controlling and monitoring refrigeration systems optimally in terms of energy”.) 4.4 Conclusion (energy)Unsurprisingly, the energy consumption is identical to that of conventional R404A systems. To put it briefly, propane and CO2 have far better heat transfer figures than R404A, but the system using a cascade heat exchanger and a brine circuit has a loss of energy, thus causing the two systems to match each other. Improving the propane/CO2 design is always possible, but it is important to optimise the brine circuit to achieve a constant load on the propane compressor in order to use the brine buffer effect to save energy. |

