Deposition of Pesticides on the Soil Surface
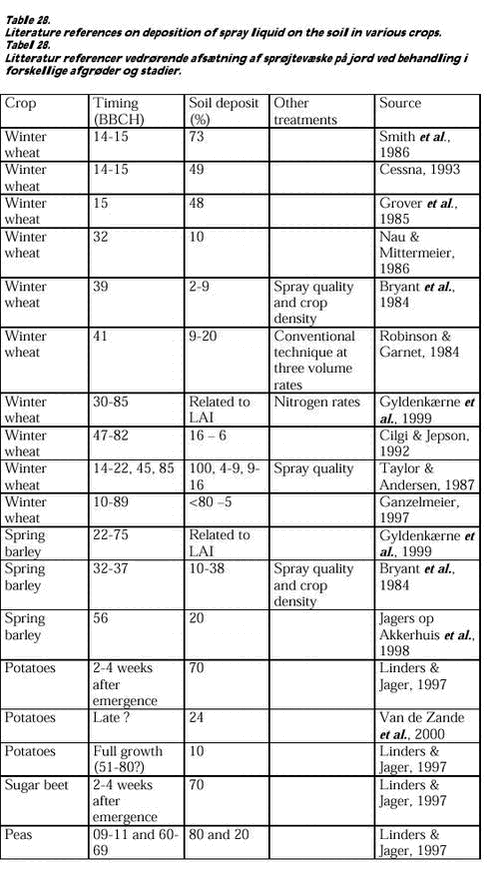
Discussion & ConclusionsMeasurements of plant cover in relation to growth stage is given for a number of crops and compared to values from a recent review on the same topic. The general impression is that the measurements under Danish conditions show a delayed crop cover at early growth stages compared to the mean review values. At late growth stages on the other hand the plant cover values measured in our study often exceeds the mean values from the review and are close to the maximum review values. Concerning the crop development at different growth stages, however, it seems reasonable to include the information collected by Becker et al. (1999) in order to have a more robust estimate than can be obtained from the three crops included in this study. A measurement of soil deposits of spray liquid on the soil surface below the crop was carried out in four crops. The results in the first year were obtained using a spray liquid without any surface-active ingredients. The relation between plant cover and soil deposits found in this year can be regarded as a worst-case situation when considering various pesticide formulations. The influence of formulation is separately documented in the experiments with four formulations and two spray qualities. The spray liquid included a surface active ingredient in the two following years and the properties of this liquid concerning its ability to be deposited on plant leaves can be regarded as more comparable to spray liquids including formulated pesticides. This was actually seen in the investigation comparing the influence of different formulations and application techniques on soil deposition. Soil deposit values with addition of the surface-active ingredient and the formulated pesticide, Amistar, was closer than soil deposit values using water without any additives. Relatively few investigations on soil deposition of pesticides below agricultural crops can be found in the literature and the existing investigations typically covers one crop at one ore a few growth stages. Some investigations have measured soil deposition others calculate soil deposition on the basis of crop interception. Table 27 reviews the experimental data and gives the value on soil deposition whether it actually is measured or calculated from crop interception measurements. These data generally give support to the values found in our study. There are nowhere data available to provide a comprehensive overview of deposition values in the major crops in Northern Europe during the growth season. Our measured values can therefore only be compared with these single values at different points and the values calculated from Becker’s estimated interception values. The general impression is that deviations between our measured soil deposition values and the values based on Becker’s estimates to a large extent can be explained by a corresponding divergence in crop cover between the two investigations. The soil deposition values achieved during the three experimental years demonstrate the level of soil deposit which can be expected below crops grown according to normal good agricultural practice under Danish conditions.
The deposition values obtained with a spray liquid without additives in the first year represents a worst case situation whereas the soil deposition values achieved during the second and third experimental season can be considered more representative concerning the relation between plant cover and soil deposition of spray below the crop. Soil deposition values to be used in the overall decision tool and by the Danish Environmental Protection Agency are shown in appendix 1. The values are obtained by pooling together data from the last two experimental years where the spray liquid included a surface-active ingredient. The data are pooled in such a way that the growth stage intervals represented aimed at including at least one treatment from each of the 2 years. |
