Facilitated transport of pesticides
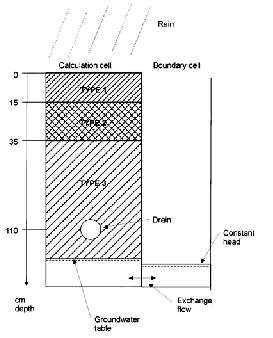
4 Modelling of experiments4.1 Application of MIKE SHE with colloid module to data from Rørrendegaard4.2 Flow setup and calibration 4.3 Calibration and sensitivity analysis of colloid transport 4.4 Calibration of Pendimethalin transport 4.4.1 Colloid-facilitated transport of pesticide 4.5 Evaluation of colloid-facilitated transport 4.5.1 Future development of model 4.1 Application of MIKE SHE with colloid module to data from RørrendegaardThe colloid and colloid-facilitated transport module developed for MIKE SHE in this study was applied to the field experiments at Rørrendegaard to further investigate the possible importance of colloid-facilitated transport of Pendimethalin. The technical documentation for the new module can be found in Styczen et al. (2002). A sensitivity analysis on some of the parameters in the module is given in Appendix C of this report. 4.2 Flow setup and calibrationFirstly, the model was calibrated to the flow conditions at plot B on Rørrendegaard. There were no measurements to support a spatial division of the plot into more than one single homogeneous area. Hence, to simplify and speed up calculations, the whole area of plot B was represented by one single column with a drainage line at a depth of 1.1 meter and a neighbouring constant head cell to let some of the infiltrating water escape as it would under natural conditions. The soil column was divided into 3 compartments with characteristics corresponding to Table 2.1 (see also Figure 4.1): TYPE 1 : 0 - 15 cm : Characteristics as 0-15 cm in Table 2.1 In the calibration, the timing of the events and the level of drain flow were the main objectives, since these would be imperative in the comparison with the obtained particle and pesticide concentrations in the drain flow. Because of variation in groundwater table, topography, and depth to the tile drain at the field site, there could be variations in what parts of the drain that contributed to the drain flow. Consequently, the observed drain flow in mm/day (converted from volume/day by division by the full plot area upstream of the sampling well) could underestimate the drain flow in the parts of the drain where it actually occurred, making matching of the modelled drain flow to observed drain flow more difficult.
FIGURE 4.1. FIGUR 4.1.
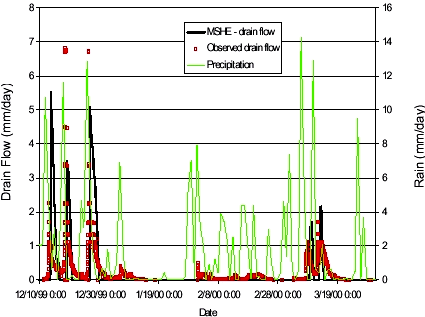
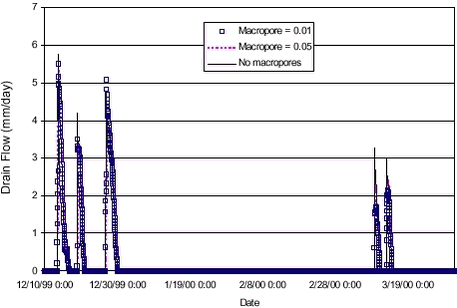
FIGURE 4.2. FIGUR 4.2. The simulated drain flow in Figure 4.2 finds the timing and the drain flow levels fairly well for the five most pronounced events. The smaller drain flow occurrences are not simulated. The simulation in Figure 4.2 uses a macroporosity of 0,01 throughout the unsaturated column. Results were not very sensitive towards the macropore flow initiation pressure or the hydraulic conductivity of the macropores. The sensitivity towards the macropore porosity is shown in Figure 4.3 below. The simulated drain flow was not very sensitive towards the macropore porosity, but having no macropores in the simulation gave rise to slightly higher peaks on the drain flow events (except one event). For transport simulations, the flow results from the simulation using a macropore porosity of 0,01 was used.
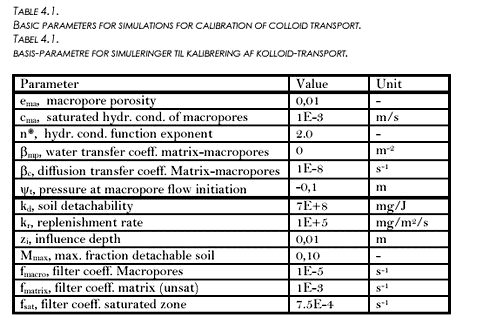
FIGURE 4.3. FIGUR 4.3. 4.3 Calibration and sensitivity analysis of colloid transportMost of the measurements on particle contents in the drain flow were made during the 98-99 season. However, from the linear relation between turbidity and particle content made from these measurements (see Table 3.2), the particle contents for the 99-00 season were extrapolated from the turbidity measurements of the season. These extrapolated values were used for comparison with the simulated values for colloids to adjust the colloid generation parameters and the filtration coefficients. The occurrence of colloid breakthrough in the drain pipes was very much event-based, and happened very close in time to heavy rainfall. In the model, event-based breakthrough was obtained by emphasising macropore transport. Macropore transport was emphasised by directing the flow interaction between matrix and macropores to only take place from matrix and into macropores, and not from macropores into the unsaturated matrix (see also Styczen et al. 2002). The estimated concentration to be compared with the measured value was the concentration in the top calculation layer in the saturated zone. Because of the horizontal discretisation, this entailed dilution of the colloidal concentration before comparison to the measured value. At the same time, it also allowed for filtering of the colloidal particles to take place in the top calculation layer of the saturated zone before comparison. This was not how the transport was thought to happen in reality, where transport of colloidal particles was believed to take place from macropores to the very top of the groundwater table and into the drain pipes, and at least only experiencing a minor dilution and filtering in the saturated zone. This artificial dilution impact was minimised by minimising the vertical extent of the top calculation layer to only extent 10 centimetres below the depth of the drain pipe. The MACRO description (see Styczen et al., 2002) for generation of colloidal particles was used and the EUROSEM model (Morgan et al., 1998) was used for water depth correction. Macropore distribution was assumed to be the same from the top to the drain depth (macropore porosity of 0,01). The basic parameters used for the simulations are shown in Table 4.1. Variations from the values shown in the table will be indicated in the relevant plots. TABLE 4.1. TABEL 4.1.
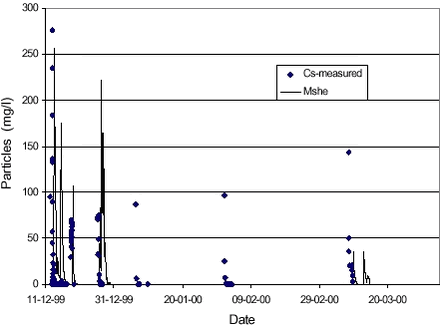
The resulting particle concentrations using the parameters listed in Table 4.1 are compared to the observed ones in Figure 4.4.
The maximum level of the first drain flow event is matched fairly well, whereas the second and third event are overestimated somewhat. The value of the detachability coefficient kd (700 kg/J) is higher than the reported values between 8 and 44 kg/J for compacted soils (Morgan et al., 1998). However, the formulation of detachment used here, incorporates the coefficient Ms, which has a maximum value of 0,10 g/g and therefore the detachability coefficient should be reduced accordingly when comparing to other values. For the simulation shown in Figure 4.4, the total generation of colloidal particles over the season from October till April was 3.8·105 kg/m2, out of which almost all was filtered out from suspension in the top of the unsaturated matrix. A total of 65 kg/m2 was put in to the macropores and out of these 48 kg/m2 (70 %) reached the saturated zone. No particles reached the saturated zone through the unsaturated matrix. The amount of particles washed out in the simulation is approximately a factor 10.000 higher than the cumulative leaching of particles to drain flow estimated from measurements of particles contents at the site (see Table 3.4). This discrepancy can be partly explained by the fact that in the simulation all particles leached to the saturated zone, and just those led away by drain flow, are accounted for. For comparison, amounts of soil lost by erosion processes in Denmark are typically on the order of 0,1-25 tons/ha/year (=0,01-2,5 kg/m2/year) depending on soil types and other conditions. The amount of particles lost through the macropores is a factor of approximately 30 higher than this. Obviously, the generation of particles could be lowered by 30 %, if at the same time filtering in the macropores was set to zero (all particles transported through the macropores would the reach the saturated zone, not only 70 %). However, the combination of parameters combination of parameters listed in Table 4.1 was deemed the most physically plausible in simulating concentration levels comparable the observed ones.
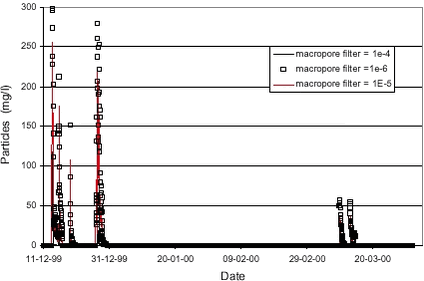
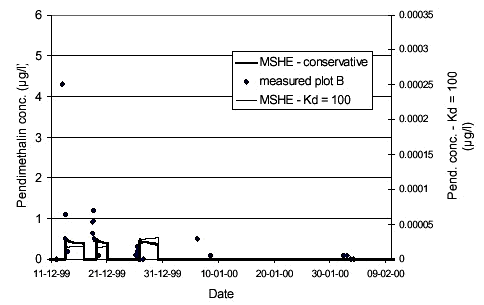
Simulation results were not very sensitive towards the macropore porosity or the diffusion mass transfer coefficient (βc)(see Styczen et al., 2002). Figure 4.5 shows the sensitivity on the macropore filter coefficient. Results are fairly sensitive towards the filtration coefficient of the macropores, since only the macropores led particles to the saturated zone. 4.4 Calibration of Pendimethalin transportThe next step was the simulation of the observed Pendimethalin concentrations. Pendimethalin was applied in the maximum allowed dose of 2,0 kg/ha, corresponding to 200 mg/m2. This was used as the initial concentration in the overland compartment of the model. At first, two simulations not including colloid-facilitated transport were performed; one simulation where Pendimethalin was treated as a conservative tracer (Kd = 0) and one where a Kd-value 100 l/kg was used. A Kd-value of 100 l/kg corresponds to the Koc-value for Pendimethalin of 10.000-18.000 reported in Table 2.2 and a foc of approximately 1 %, which is in the low end of the values for foc reported in Table 2.1 for the soil at Rørrendegaard. The results of this simulation are shown in Figure 4.6.
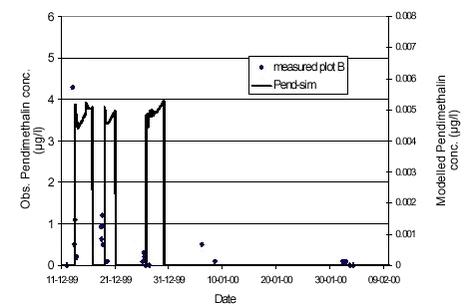
FIGURE 4.6. FIGUR 4.6. Even though Pendimethalin was handled as a conservative tracer with a reported solubility of 0,3 mg/l (Extoxnet at http://ace.orst.edu/cgi-bin/mfs/01/pips/pendimet.htm), the observed concentrations at the times of drain flow in December 1999 could not be achieved. At later times in the simulation, concentrations of 2-3 µg/l were obtained in the saturated zone but not at times of drain flow occurrences. The low simulation concentrations were not caused by dilution from the neighbouring cell, since flow was directed from the middle cell and outwards at times of drain flow events. As stated before, the lower level of the upper calculation layer was only 10 cm below the drainage level, so the artificial dilution was also limited. In these simulations a maximum timestep of 60 seconds was used and results were stored (momentarily) every hour. When comparing concentrations from the simulations to concentrations from the field site, it should be noted that field site concentrations were averaged over the time it took to fill one sampling bottle, whereas the concentration from the simulations were momentary (averaged over the timestep length). During the rain events, the averaging (time to fill sampling bottle) was on the order of one to two hours. Using smaller time steps or saving results more frequently did not alter simulated concentrations significantly. The observed concentrations of Pendimethalin could not be achieved, since solubility controlled the amount of Pendimethalin that could be put into the model. By increasing the solubility to 30 mg/l (100 times the reported solubility), concentrations of 9 µg/l could be obtained at later stages in the simulation, but the concentrations at the time of drain flow still did not match the observed levels. The simulation using Kd = 100 l/kg shows how low simulated concentrations become when sorption is included without colloid-facilitated transport (simulated concentrations are approximately a factor of 20.000 lower than for the conservative simulation). 4.4.1 Colloid-facilitated transport of pesticideSince the colloid transport had already been calibrated, the calibration of the colloid-facilitated transport should imply only the adjustment of the sorption parameter for sorption of Pendimethalin onto colloids, which should in turn be a relatively well determined parameter depending on the composition of the colloids. Figure 4.7 shows the results of a simulation using a Kd-value of 50 l/kg for sorption onto soil and a Kd-value of 200 l/kg for sorption onto colloids. The concentration levels achieved were orders of magnitude lower than the levels observed. However, by comparison the results obtained for the Kd=100 l/kg without colloid-facilitated transport in Figure 4.6, it can be seen that incorporating colloid-facilitated transport leads to significantly higher simulated concentrations. In the macropores, the concentration of pesticide sorbed onto colloids was on the order of 200 µg/l, whereas the dissolved pesticide concentrations in macrpores and matrix were orders of maginitude lower. Over the simulation period (October-April), 97 % (!) of the total input of Pendimethalin to the saturated zone came through colloid-facilitated transport through macropores. So, even though the observed concentrations were not reached, the simulation showed that the colloid-facilitated transport without comparison was the most important transport mechanism for the Pendimethalin through the unsaturated zone. The large concentrations of colloid-associated Pendimethalin in the macopores were caused by the also very large concentrations of colloids in the macropores. In the saturated zone, however, the colloid-concentrations were diluted and the colloid-associated Pendimethalin transferred to the dissolved state to maintain equilibrium, since the macropore water input to the saturated zone was only a small fraction of the total amount of water present. In fact, simple hand calculations using the following parameter-values: Colloid concentration: 350 mg colloids/l show that the corresponding concentration of pesticide sorbed onto colloids is only 0.7 µg/l (less than 10 % of the dissolved concentration). The colloid concentration of 350 mg/l is approximately equal to the maximum observed colloid concentration in the drain flow. These percentages correspond well to the observed distributions between particle-associated and dissolved Pendimethalin seen in the drain water samples from Rørrendegaard.
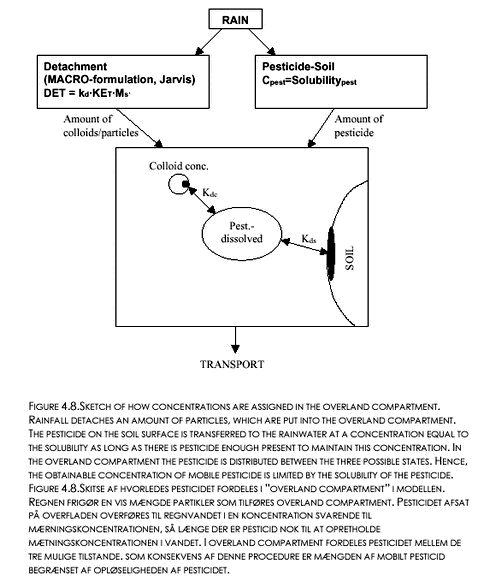
FIGURE 4.7. FIGUR 4.7. By eliminating filtration of colloids in the macropores, slightly higher concentrations of Pendimethalin could be obtained. Increasing the Kd-value for the sorption of pesticide onto colloids would obviously increase the transport of pesticide to the saturated zone, but only slightly, since concentrations of colloid-associated Pendimethalin in the macropores almost reached the solubility of Pendimethalin in the simulation in Figure 4.7. The real bond on the concentrations that could be achieved was the solubility of the Pendimethalin, because it controlled how much pesticide could be put into the model. since the pesticide was transferred through the aqueous state to the particle-sorbed state. The methodology is explained in Figure 4.8: Rainfall detaches an amount of particles, which is put into the overland compartment. The pesticide on the soil surface is transferred to the rainwater at a concentration equal to the solubility as long as there is pesticide enough present to maintain this concentration in the water. In the overland compartment, the pesticide is distributed between the three possible states (adsorbed to the soil, adsorbed to colloids, and dissolved). Hence, the obtainable concentration of mobile pesticide is limited by the solubility of the pesticide, since this controls the input of pesticide into the overland compartment.
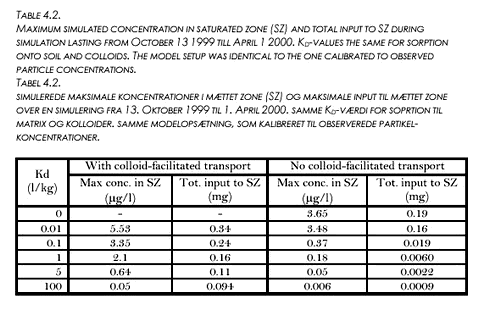
The maximum concentrations of pesticide sorbed onto colloids seen in the macropores were now on the order of 5000 µg/l and concentrations of dissolved pesticide in the macropores were on the order of 0,1 µg/l. Input of pesticide through the matrix was still insignificant. However, larger concentrations could not be obtained because further increase in solubility and Kd led to depletion of the Pendimethalin initially put on the soil surface within the first month of the simulation. 4.5 Evaluation of colloid-facilitated transportThe conclusion for the modelling of the Pendimethalin concentrations was that significantly large (compared to observed) concentrations could not be obtained using the approach applied in this study. The approach chosen is still valid in principle and can be used to study the importance of colloid-facilitated transport to concentrations obtained in the saturated zone. A number of simulations, using the parameter-values in Table 4.1 and variable Kd-values (identical for sorption onto soil and to particles in each simulation) were performed. The resulting maximum concentrations obtained in the saturated zone and the total input of pesticide into the saturated zone are given in Table 4.2 below. Table 4.2 shows, that for the given flow- and transport configuration, colloid-facilitated transport could play an important role in transport of pesticides even though they are not very strongly sorbing. Obviously, the importance increases with increasing Kd-value. At Kd = 100 l/kg, the maximum concentration is a factor 10 higher and the total input to SZ is a factor 100 higher when colloid-facilitated transport is incorporated. Still, even at low Kd-values, the colloid-facilitated transport increases maximum concentrations and total input considerably. It should be noted that these proportions are completely dependent on the colloidal concentrations, meaning that the colloid-facilitated input is linearly dependent on the colloid concentrations. It should also be noted, that for the lightly sorbing compounds, the storage in the unsaturated matrix may dominate the total mass of pesticide present, meaning that matrix flow could become the determining factor for the total input to the saturated zone if simulations were run for a longer period of time.
4.5.1 Future development of modelThe approach chosen here was not adequate to reach the observed concentration levels. The limiting factor for the achievable concentrations was the concept of transfer of Pendimethalin from the aqueous state to the colloid-associated state, making the solubility of the compound the limiting factor. Other factors not incorporated in the model could play a role, such as generation of colloids below the soil surface, the possibility of some colloid transport through the matrix, uneven spreading of the compound on the surface, and non-equilibrium division between sorbed and dissolved states (especially in the macropores). However, none of these mechanisms would be able to explain the lack in concentrations of orders of magnitude as the solubility constraint can. A possible explanation for the discrepancies between observed and modelled concentrations could be that the pesticide does not ’obey’ the reported solubility, but might form crystals leading to higher aqueous concentrations than dictated by reported solubility. A different approach for modelling the generation of colloid-associated pesticides (or other compounds) at the soil surface must be employed, in which the concentration of colloid-facilitated pesticide is unrelated to the solubility of the compound. The model could conceptualise the generation of particles with very high contents of pesticide being peeled from the top sediment using e.g. the work of C.W. Rose and co-workers in describing the chemical enrichment seen in erosion modelling (see e.g. Ghadiri & Rose, 1991a+b and Rose, 1993). The concentration levels obtained by this technique could be significantly larger in the short periods where heavy rainfall occurs. These ’supersaturated’ particles should then be allowed to pass through the macropores undergoing a kinetic desoription allowing them to still be carrying a large amount of pesticide as they reach the saturated zone. |
