Facilitated transport of pesticides
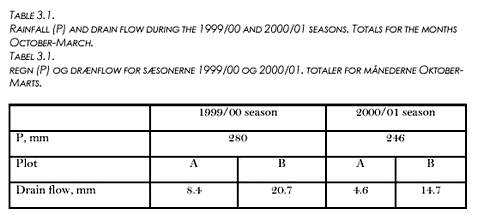
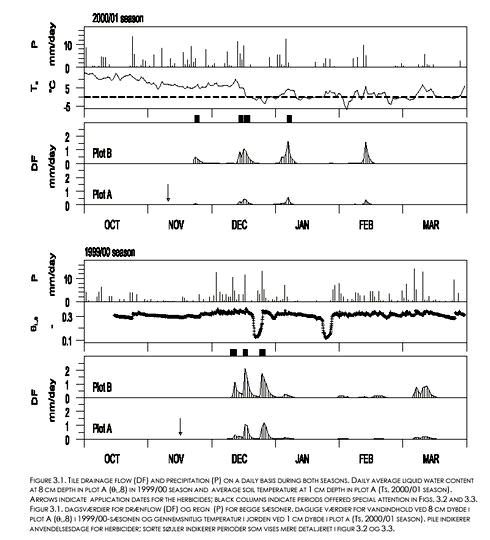
3 Results3.1 Rainfall, soil conditions, and drain flow3.2 Dynamics of herbicide concentrations in drain water 3.2.1 Pendimethalin, 1999/00 season 3.2.2 Pendimethalin and Ioxynil, 2000/01 season 3.3 Herbicide concentrations and turbidity 3.4 Fractionation of Pendimethalin 3.5 Cumulative losses 3.6 Investigation of fractionation in model areas 3.7 Sorption of Pendimethalin 3.1 Rainfall, soil conditions, and drain flowDrain flow was generated exclusively during the months October - March. Rainfall totals during these 6 months were 280 mm for the 1999/00 season, and 246 mm for the 2000/01 season (see Table 3.1), compared to an average of 274 mm for the years 1961-1990 measured at a nearby climate station (Jensen, 1996). Cumulative drain flow for the 6 months period as related to entire plot areas varied between 4.6 mm and 36.0 mm (Table 3.1). The cumulative flow decreased with the amount of rainfall, and it was larger for plot B than for plot A. The ratio between drainage flow from plot A to that from plot B was fairly similar for the two seasons.
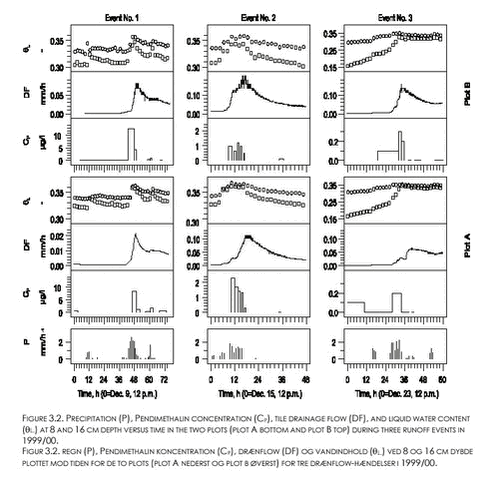
Drain flow appeared as events, separated by periods with little or no flow (see Fig. 3.1). Liquid soil water content at 8 cm depth (θL,8) varied in plot A between 10 and 33 % (v/v) during the 1999/00 seasons. Values considerably below the measured field capacities (Table 2.1) did not represent total water contents but showed that some of the soil water was frozen. For plot B, θL,8 values were similar to the values shown for plot A, whereas fewer distinct frost events occurred at 16 cm depth in both plots (data not shown). During the 2000/01 season, most of the drain flow occurred in periods with soil surface temperatures above 0oC, i.e. periods with an unfrozen soil surface. 3.2 Dynamics of herbicide concentrations in drain water3.2.1 Pendimethalin, 1999/00 seasonEighty-three percent of the total Pendimethalin loss with drain water from the two plots occurred during the three events that are shown on Figure 3.2 (numbered successively 1-3 ). The first drain flow occurred during event No. 1 on December 10; 25 days after the application. Maximum Pendimethalin concentration (CP) values (8.3 µg l-1 for plot A and 12.6 µg l-1 for plot B) were observed during this event and almost simultaneously (within the same 3-6 hours period) for the two plots after a cumulative drain flow corresponding to 0.05 mm for plot A and 0.06 mm for plot B. The concentrations dropped rapidly as the event continued. However, Cp more than doubled in both plots in response to an extra 2 mm of rainfall about 60 hours after the onset of the event (Fig. 3.2). The cumulative rainfall from Pendimethalin application until the sampling of peak concentrations in the first drain flow event was about 48 mm.
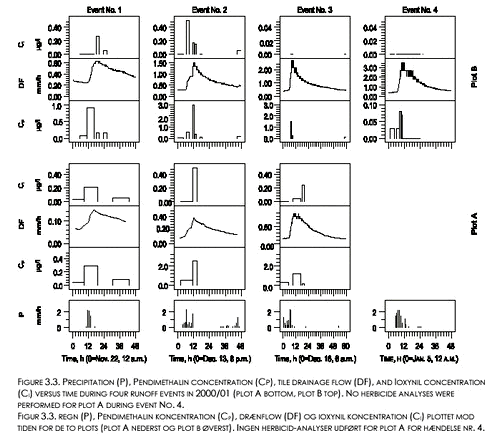
During all three events and for both plots, peak values for CP occurred before peak values for the drain flow rates (Fig. 3.2). The peak CP values were all observed during rain events. During the first two events, peak concentrations coincided with large peak values for soil moisture content at 8 and 16 cm depth. The third event occurred right after or during a break of frost situation as shown by increasing θL,8 values at 8 cm depth from values considerably below field capacity. The observed peak CP values decreased with event number. No or very little Pendimethalin was detected in drain water sampled after December 25 1999. 3.2.2 Pendimethalin and Ioxynil, 2000/01 seasonSeventy-five percent of the total loss of Pendimethalin with drain water, and sixty percent of the loss of Ioxynil, occurred during the four events that are shown on Figure 3.3 (defined successively as event No’s. 1-4 ). As during the 1999/00 season, Cp varied considerably between and within events. Peak Cp-values decreased with event number from the second event. Generally, peak Cp-values were observed during rain events and before peak values for drain flow (Fig. 3.3). While the variation in drain flow was fairly well synchronized between the two plots, peak values for Ioxynil concentration (Ci) did not generally occur in the same samples or at the same time as peak values for Cp. No detectable amounts of Ioxynil were found after December 17, 2000 in any of the plots, except from one value just above the detection limit (Ci=0.04 µg l-1) measured in a sample from plot A on February 12 , 2001. Pendimethalin was observed in five samples (up to Cp = 0.18 µg l-1), on February 8, 11, and 13 in 2001 (see appendix A) in connection to heavy rainfall (3,7 mm/d on Feb. 7; 4,5 mm/d on Feb. 9; 9,9 mm/d on Feb. 12; and 5,5 mm/d on Feb. 13).
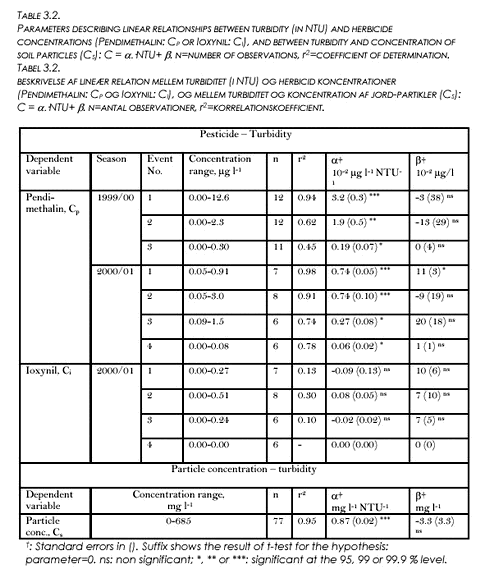
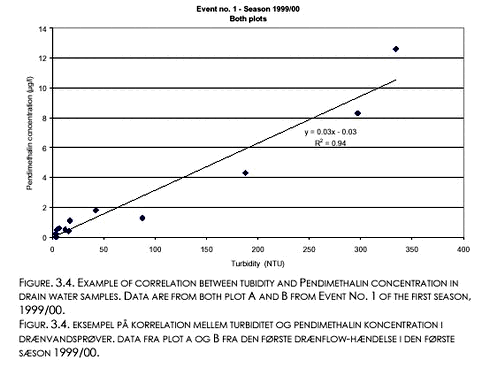
3.3 Herbicide concentrations and turbidityPendimethalin concentration (CP) was linearly and positively related with turbidity (T) during all the seven drain flow events defined by Figs. 3.2 and 3.3. A summary of the correlations is shown in Table 3.2. An example correlation from the first event of first season, is shown in Figure 3.4. The coefficients of determination (r2) for the least squares relationships varies listed in Table 3.2 varies between 0.45 and 0.98. Within each season, r2 tended to decrease with event number. During the 1999/00 season, the slopes were significantly larger for the first two events than for the third event (P<0.05). During the 2000/01 season, the slopes were significantly larger for the first two events than for the last events (P<0.05). There were no significant intercepts, except for event No. 1 in 2000/01 (intercept=0.11 µg l-1, cf. Table 3.2). Similar linear relationships between Ioxynil concentration and turbidity could not be established.
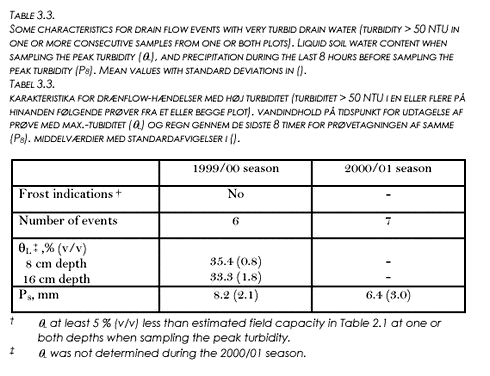
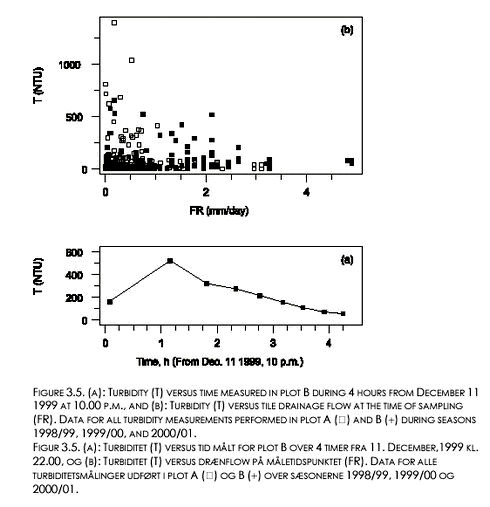
Turbidity generally peaked in the beginning of each new drain flow event and generally showed considerable tailing (example shown in Figure 3.5a). Very turbid drain water (T > 50 NTU) in one or more consecutive samples from one or both plots appeared in 6 events during the 1999/00 season and in 7 events during the 2000/01 season, see Table 3.3.
During the 1999/00 season, the occurrence of the large peak values (peak T > 50 NTU) always coincided with very large θL-values in the plow layer, θL at each depth and plot being 3-7% (v/v) larger than the estimated field capacity, generally (Tables 3.3 and 2.1). During the 1998/99 season, the large peak T values either coincided with such very large θL values (8 events), or with θL-values at 8 or 16 cm being clearly lower (at least 5 % v/v) than the estimated field capacities indicating a partly frozen soil. The only two peak T values larger than 1000 NTU were both observed in break of frost situations (data not shown). In all events without frost indications, considerable amounts of precipitation occurred during the last 8 hours before sampling the peak turbidity (Table 3.3). For the break of frost events, the cumulative 8 hours precipitation preceding the large peak T values tended to be somewhat smaller and more variable.
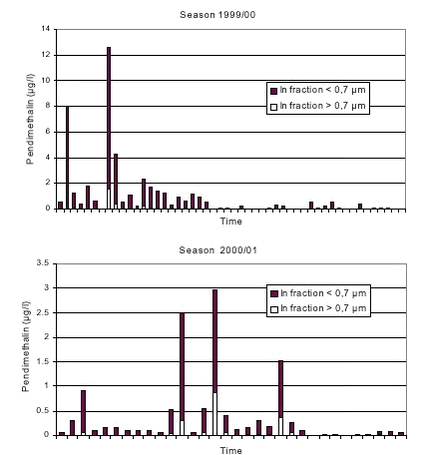
FIGURE 3.6. THE FRACTIONATION OF PENDIMETHALIN BETWEEN SOLID PHASE (FRACTION > 0,7 µm, WHITE) AND AQUEOUS PHASE (FRACTION < 0,7 µm, DARK BROWN) FOR BOTH SEASONS. EACH BAR REPRESENTS ONE SAMPLE. FIGUR 3.6. FRACTIONERING AF PENDIMETHALIN MELLEM FAST FASE (FRAKTION > 0,7 µm, HVID) OG VANDIG FASE (FRAKTION < 0,7 µm, MØRKEBRUN) FOR BEGGE SÆSONER. HVER KOLONNE REPRÆSENTERER EN PRØVE. 3.4 Fractionation of PendimethalinAll water samples were filtered through a 0,7 µm glass filter and both the filtrate and the residue on the filter were analysed. This was done to examine the distribution of pesticide in the fractions separated by the 0,7 µm filter. The fractionation above and below 0,7 µm for both seasons and both plots is shown in Figure 3.6. For Ioxynil the detection limit of 0,03 µg/l was never exceeded in the solid phase, thus all Ioxynil was found in the filtrate. Based on the low findings of particle-associated Pendimethalin in the first season, it was speculated whether the cut-off value of 0,7 µm was possibly to high. Therefore, the water samples from the second season were filtered through both the 0,7 µm filter and a 0,2 µm Polysep filter. However, because of laboratory error, the results from the filtration of Pendimethalin could not be used, since it turned out that the filter actively adsorbed Pendimethalin. For Ioxynil, again the detection limit was not exceeded in the solid phase from the 0,2 µm filter.
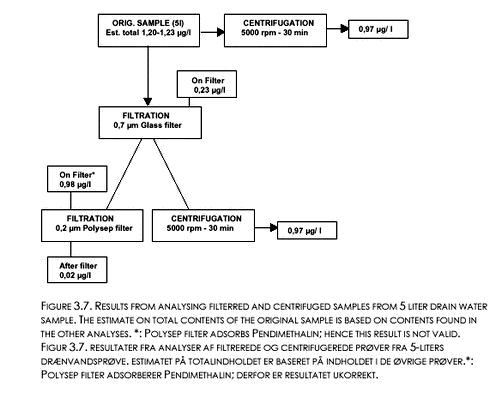
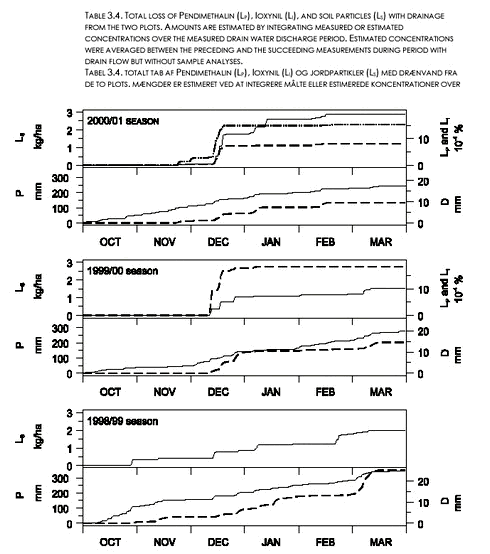
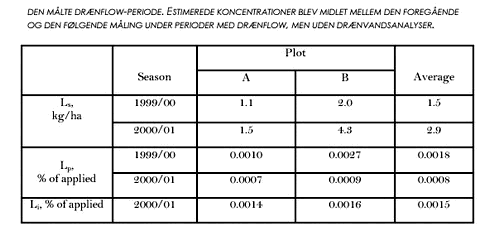
One single five liter sample was taken out on December 18, 2000. Following the unsuccessful filtration through the 0,2 µm filter, a procedure of combined filtration and centrifugation was followed (illustrated in Figure 3.7) to determine the distribution between solid and aqueous phase. Centrifugation was performed for 30 minutes at 5000 rpm. corresponding to 4100 times g-force. This should essentially remove all particles from solution. The results of the different analyses are presented in Figure 3.7. The figure shows that the estimated total concentration in the original sample is 1,20 – 1,23 µg/l and that 20 % of the Pendimethalin is in the fraction above 0,7 µm, whereas virtually no Pendimethalin is removed through centrifugation. The figure also shows the problem of Pendimethalin adsorption to the Polysep 0,2 µm filter. 3.5 Cumulative lossesIn general, there was little detectable herbicide in drainage outflow sampled after December in both seasons. Almost all the herbicide mass losses to drainage occurred in short time intervals during the first 1-2 months after application, whenever there was a large enough rainfall to generate drain flow (Figure 3.8). The total loss of Pendimethalin with drainage was larger for the 1999/00 season than for the 2000/01 season (Table 3.4). The relative amount of herbicide lost with drainage water during the 2000/01 season for Ioxynil was about twice that of Pendimethalin.
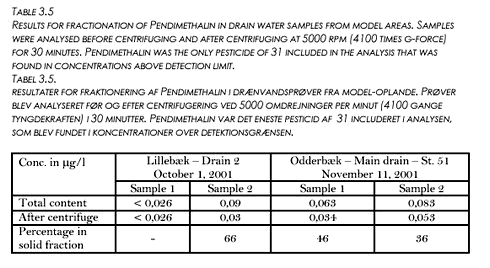
The losses of soil particles occurred during short time intervals throughout the seasons (Fig. 3.8). In general, the correspondence between cumulative drainage line flow and loss of soil particles was poor. The seasonal losses of soil particles with drainage varied between 0.9 and 4.3 kg ha-1. On average for the two plots and three seasons (including 1998/99), 2.1 kg ha-1 year-1 of soil particles was lost with drain water. Eighty-one percent of the amount of Pendimethalin found in the soil right after application on November 16 1999 was still present in the soil (0-35 cm depth) on February 24, 2000. No detectable amounts of Pendimethalin was found in the soil before application in 1999. 3.6 Investigation of fractionation in model areasTo further investigate the fractionation of pesticides between dissolved and particle associated states supplementary drain water samples were taken from the two model areas. From one drain in each model area two samples were taken during the same rain event. The samples were centrifuged in the same manner as previously (5000 rpm for 30 minutes) and both the supernatant and the centrifuged solid phase were analysed for a suite of 31 pesticides, including Pendimethalin. In fact, the only pesticide found in the samples was Pendimethalin and the results for that compound are given in Table 3.5. The analysis showed that between 36 and 66 % of the Pendimethalin was in a particle-associated state. This compares to approximately 20 % in the particle-associated state found for the five liter centrifuged sample from Rørrendegaard shown in Figure 3.7, and to 0-30 % for the 0,7 µm filtered samples from the two sampling seasons at Rørrendegard shown in Figure 3.6.
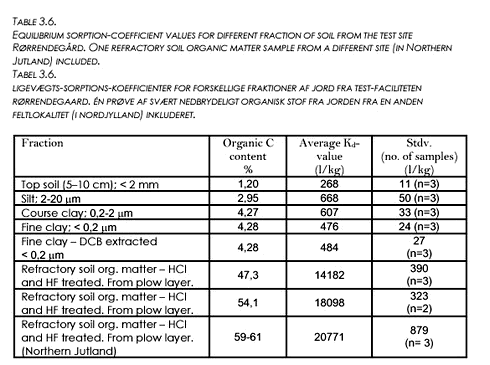
3.7 Sorption of PendimethalinThe sorption of Pendimethalin to different soil fractions was investigated in order to better be able to understand what controls the sorption. It was hypothesised that clay minerals would have larger sorption capacity (see e.g. Ghadiri and Rose (1991a+b)) and that possibly surface-oxides and hydroxides might also contribute to increasing sorption capacity. Fractions of clay and silt were sieved; one fraction of fine clay was DCB-extracted to remove Fe- and Mn-oxides. Refractory soil organic matter samples from the plow layer at Rørrendegaard were prepared. One refractory soil organic matter sample from a different site (in Northern Jutland) was also included in the experiment. The sorption experiments were performed with radioactively marked Pendimethalin and only the equilibrium state was investigated. Results are shown in Table 3.6.
Results show that the high organic carbon content fractions have sorption coefficients that are around 60 times higher than that of the original top soil, indicating that soil organic carbon is the primary factor in determining the sorption capacity of the soil. The Koc- values deducted from the measured Kd-values and the relation Kd=foc·Koc range from 11.000 for the fine clay to 30.000 for the soil organic matter samples. The estimated value for Koc for the top soil (22.000) is slightly above the range given in Table 2.2. Results also show that the pure clay fractions have a larger sorption capacity than the original soil (a factor 2.5), and that the DCB treatment does not influence the sorption capacity of the clay, meaning that the hypothesis of prevalent oxide-sorption was not proven by the experiment. |
