Scenarios and Model Describing Fate and Transport of Pesticides in Surface Water for Danish Conditions
7 Uncertainty Issues in Relation to the Scenarios
7.1 Introduction
7.2 Uncertainties related to model choice and model parameterisation
7.2.1 Colloid transport and macropore representation
7.2.2 Dispersion in the upper part of the groundwater
7.2.3 Effect of storage frequency
7.2.4 Process kinetics
7.2.5 Description of degradation in soil
7.2.6 Diffusion and stratification in ponds
7.3 Uncertainties related to the choice of scenarios
7.4 Uncertainties related to input
7.5 Uncertainties related to the interpretation of output
7.6 Strategies to further reduce the uncertainty
7.1 Introduction
The description of uncertainty follows to the largest possible extent the description given in FOCUS (2002).
The four main types of uncertainty described in this chapter are:
- The uncertainty related to the correctness of the process descriptions within the applied models. Mathematical models necessarily need to simplify the complex processes found in nature for their simulations.
- The uncertainty related to the choice of scenarios for weather, soil and crop. Transport of pesticides is influenced by many factors, and only a limited number of factors were taken into consideration when selecting the scenarios.
- The uncertainty related to the estimation of input for the scenarios. This is to a large extent discussed in Styczen et al. (2004a) with respect to the selected parameterisation of the catchments, but some factors are changed when the models were transformed into scenarios and particularly for the pesticide parameters, the uncertainty is of importance.
- The uncertainty related to the calculation and interpretation of output.
7.2 Uncertainties related to model choice and model parameterisation
If a compound is subject to processes, which are not considered in the model structure, then this will contribute to the modelling error. Three easily understandable examples are
- The erroneous simulation due to a wrong model concept. For instance, the process implemented in the model assumes that the substance degrades according to first order kinetics, but the degradation of a substance does not follow this kinetics.
- The ignorance of a process relevant for the behaviour of the substance. For instance, a volatile chemical is simulated with a model not accounting for volatilisation,
- The erroneous simulation due to a biased model concept. For instance leaching in a structure soil is simulated with a model that accounts for chromatographic leaching only.
7.2.1 Colloid transport and macropore representation
The calibration of the catchment models show that there are problems with certain process descriptions. According to Holm et al. (2003), the colloid description applied does not explain the observed transport of strongly sorbing compounds.
The same result was observed when comparing simulated and measured pesticide transport in the Lillebæk catchment. The stronger, the pesticide sorbs, the larger the error. However, this was to a large extent counteracted by an exaggerated simulation of macropore flow caused by the requirements of the colloid-transport description. All in all the transport of pesticide to the groundwater is overestimated in the present representation.
For the Odder Bæk scenario, the original assumption was that the area was very sandy, and therefore not subject to macropore flow and drainflow. The soil types have been changed to what was actually observed and drains were included, but macropores were left out. The calibration exercises have shown that macropores probably are present in the catchment anyway. This is particularly visible because highly sorbing compounds such as pendimethalin are found in the stream. Pendimethalin was measured in the drain in Odder Bæk and 36-46% of the pendimethalin in the sample was sorbed on colloids. Omitting this process thus means that the transport of strongly sorbing compounds is severely underestimated in this scenario. In order to reached the observed pesticide concentrations, the foc-values have been halved (see Styczen et al., 2004a) – this may to some extent compensate for the omission of macropores. However, the measured values for organic matter were unusually high.
7.2.2 Dispersion in the upper part of the groundwater
There are problems with catching the first peaks occurring during autumn, and in general, the transport of pesticide with groundwater appears to be too high.
Drain flow is generated in the upper calculation layer of the saturated zone. Only when the water level raises above the drain level is drain water produced. In reality it is observed that drainflow occurs already before the groundwater level raises due to locally saturated codintions around drain depth. The top layer of the saturated zone is rather deep (3-4 meters) and this causes the leaching from the unsaturated zone to be mixed into too much water. It is, however, not possible to make it smaller, as MIKE SHE requires it to cover the variations in ground water level, and considerable efforts have been put into making this layer as thin as possible.
The high macroporre flow and the problem with catching the fist autum peaks undiluted leads to too much pesticide in baseflow. It is difficult to quantify this error, as some mixing also takes place in natural drainflow. If drainflow is generated from a layer of 0.5 m and the calculation layer is 3.5 m deep, the peaks will either be 1/7th of the correct concentration or, if the peaks are of the right magnitude, the mass moving to groundwater will be 7 times to high. A rough estimate of this error is a factor 5-10.
As it has been agreed early in the project to follow the FOCUS (2000) recommendation with respect to zero degradation of pesticide below one meter, the pesticide can undergo sorption or transport only.However, as the saturated zone from time to time penetrates into the upper meter, the parameterisation of the lower part of the root zone is extended to the first calculation layer of the groundwater zone too.
7.2.3 Effect of storage frequency
The too low peaks are also caused by the storage time steps in the intermediate water result files. Values of flow are averaged over a timestep. However, it has not been possible to increase the storing frequency to the extent wished.
7.2.4 Process kinetics
With respect to process kinetics, there is no doubt that at least for some of the pesticides; the kinetics of their reactions with soil and colloids is of importance. The “standard” MIKE SHE-model is able to handle kinetics of processes, but the choice of process descriptions to be included were limited by the fact that Danish EPA should have access to the data, and the standard input produced by the companies is simple Koc-values or similar. The effect of kinetics is not straight forward. In some cases, a compound may leach faster, because it does not in reality have time to become adsorbed. On the other hand, equilibrium assumptions lead to that all adsorbed pesticide eventually leaves the soil column, while some observations show that sorption may be irreversible for some compounds.
7.2.5 Description of degradation in soil
The data is also a problem with respect to the description of degradation in MIKE SHE. It was attempted in the calibration procedure to calculate leaching with the assumption that adsorbed pesticide breaks down at with the same speed as pesticide in solution, or with the assumption that sorbed pesticide do not break down. The first of these assumptions is usually the one implemented in registration models. However, for some pesticides there may be a difference between the two phases, but this is not visible from the data available to the EPA's for registration. Assuming that pesticid breaks down in solution only, results in leaching over a much larger period and much higher residues in soils.
7.2.6 Diffusion and stratification in ponds
The value of the diffusion coefficient used for the pond model is associated with problems in relation to uncertainty. This is an indirect consequence of the fact that the diffusion into the sediment in many cases only penetrates the sediment in a very thin layer (see Appendix D). The layer thickness can be a range of 1/10 mm. This implies that the effective area of the water column/sediment interface is much larger than the simple cross-section area. One single m² of the bottom surface may have an effective area in the range of 10-100 m² if the surface roughness is taken into account on the length scale of 1/10 mm. This may explain why the diffusion coefficient for sediment transfer is calibrated to be higher than the value for molecular diffusion in the pond experiment (Styczen et al., 2004a and Mogensen et al., 2004). In addition, the effective diffusion coefficient might vary with a factor of at least 10 between two years in the same pond (Styczen et al., 2004a). As a compromise the effective diffusion coefficient in the registration model was set to the average of the diffusion coefficient obtained for the two year. However, it must be emphasised that the variation in effective diffusion coefficients between different ponds and years all over Denmark is not known, and this is a major source to uncertainty. The variability of the molecular diffusion coefficient due to substance specific properties seems limited compared to the factor mentioned above. But, the difference in adsorption characteristics may have a large influence on the sediment uptake by diffusion (see Appendix D).
Experimental studies conducted in the artificical ponds at NERI in Roskilde revealed that a vertical stratification of the pesticides was present within the first hours to day after the addition of a pulse of pesticide. This is not taken in to account by MIKE 11, which only has one vertical layer. In addition, the role of the macrophytes for the verical stratification is not taken in to account. Compared to the overall uncertainties of the model at catchment scale, the above deviations at pond scale is probably of minor importance for the fate and transport of pesticides at large. However, for the interpretation of model results in terms of pesticide exposure and toxicity, the deviation might be important. For instance, high concentrations in the upper part of the water column might give rise to higher concentrations in the surface microlayer, which migh be an important exposure route for some pond organisms.
Hence the importance of the deviation between the model and the “reality” observed by the pond experiments can only be determined through a linking of the fate model to an exposure and effect model.
In the ponds at NERI, Roskilde, the deviations between the model predictions and the measured data was detected through an intensive measurement program in a controlled system and the model for the pond was developed along with the results of these experiments. For instance, the mathematical description of the diffusion into the sediment and the effective diffusion coefficient is a direct result of the interaction between experiments and model. However, for the stream part of the surface water model the interaction between the measurement and the model work was fairly weak. Hence the calibration or verification of the stream model was conducted at catchment scale, where the MIKE SHE model, due to a longer residence time of the pesticides in the soil compartment, mainly determines, the occurrence of the pesticides in the surface water. Many of the processes in the stream have therefore not been been evaluated as intensively as the process for the ponds.
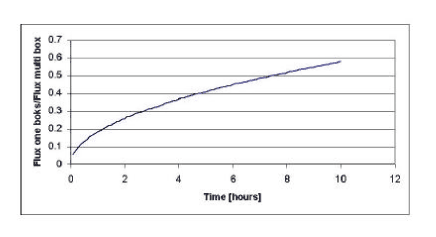
In accordance with the recommendation of the inception report (DHI et al., 1998) different mathematical descriptions of diffusion of active substance in to the sediment bed were applied in the stream and the ponds. However, through the project theoretical consideretations revealed that the choice of a single box approach for description of the diffusion in the streams might be dubios. Data for an experimental evaluation of the approach is, however, not availbable, since the calibration of the stream model was conducted at catchment scale omitting the options for an intensive evaluation of the process descriptions in the stream. The theoretical difference between the box approach applied for the streams and the diffusive approach applied for the ponds appear from Figure 7.1.

Figure 7.1 Ratio between flux of active substance into the sediment estimated by a single box approach and a multi box approach. The one box approach is used for the streams, whereas the multi box approach is used for the ponds.
Figure 7.1 Forholdet mellem optaget af aktivt stof i sedimentet estimeret med et en box og et multi box approach. En box approachet anvendes for vandløbsmodelen medens multibox apporachet anvendes for vandhullerne.
As it appears from Figure 7.1 the flux of active substance into the sediment is much smaller for the one box than for the multi box approach, espcecially at the time scale of less than an hour. Hence the flux of active substance in to the sediment might be underestimated by the one box approach. This might for instance explain why the concentrations in the water column of a highly sorbable compound like pendimethalin tend to be overestimated in Lillebæk stream by the model. Furthermore most of the degradation of active substances might take place in the sediment due to the local high concentration of degrading bacteria, whereby the effect of an underestimation of the flux is further enhanced. Hence an implementation of the multi box approach for description of diffusion into the stream model might be a significant improvement of the model.
7.3 Uncertainties related to the choice of scenarios
The two catchments were selected to represent a moraine clay area and a sandy area. It is, however, extremely difficult to judge the term “representative” in quantitative terms. It has already been described how the selected catchments compare to the rest of Denmark with respect to rainfall, soil types and crops. With respect to all of these parameters, the values fall within the normal range. None of them are extreme. The presence of buffer zones in the Lillebæk scenario may be compared to the study carried out by Syngenta (Hendley et al, presentation given to the Danish EPA at Syngenta) for all of Funen. The study identified that ponds have 49% of their 20 m margin cropped (and 51% not cropped), and 62% of the streams have their 20 m margin cropped. In comparison, the scenario pond in Lillebæk has a minimum buffer zone of 0. The “original” Lillebæk Stream has ((1080-230)/1080=) 79% of the length cropped within its 20 m margin. This appears to be more than the average value. 57% of the length that is cropped within the 10 m-margin. This value becomes somewhat distorted in the scenario as the piped part of the stream is opened and allocated a 0 m buffer zone. This means that 91% of the stream is cropped within its 20 m-zone. In this case, the scenarios are thus likely to overestimate the drift values by a factor of about 1.5.
A similar study does not exist for Northern Jutland, as mentioned earlier, the presence of permanent grass in the catchment is slightly lower than the average value for similar Danish counties.
There are no indications that the geology in the Lillebæk area should be particularly different from other moraine areas. The parameter values used are not extreme for this type of environment. The stream itself is, however, rather steep for Danish conditions. The main problem with Lillebæk as a scenario is that water actually runs into the area from the western side and that there are losses, probably to the south and definitely to the east, towards the Great Belt. This is, as far as possible, taken into account in the model, but there is, of course uncertainty related to the description of geology.
With respect to the Odder Bæk scenario, there are a number of problems related to the description itself. As described in Section 3.2, the catchment turned out to be less sandy than expected and pipe drained in some areas. The effect of the different soil texture in the root zone has been tried out by exchanging the texture over the entire catchment with a JB1 from the Jyndevad research station. Results indicate that discharge in the stream is increased by 11% and in the upstream drain by 17%, mainly due to an increased baseflow from groundwater (Figure 7.2).
Figure 7.2 Discharge in stream and drain at Odder Bæk, simulated with observed texture(a) and with JB1 texture (b), both compared to observed discharges.
Figur 7-2 Afstrømning fra å og dræn ved Odder Bæk, simuleret med observeret textur (a) og med JB1 textur (b), begge sammenlignet med observerede afstrømninger.
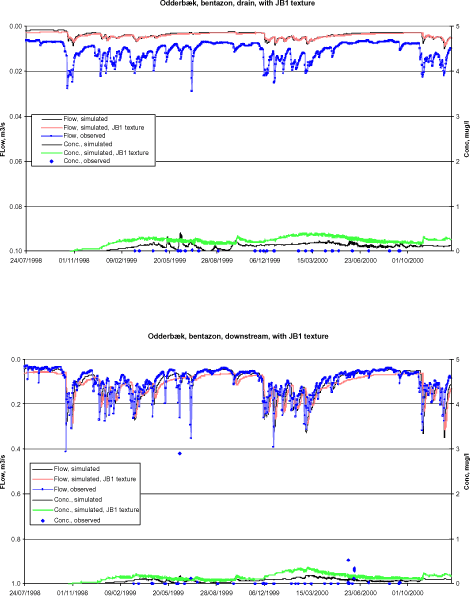
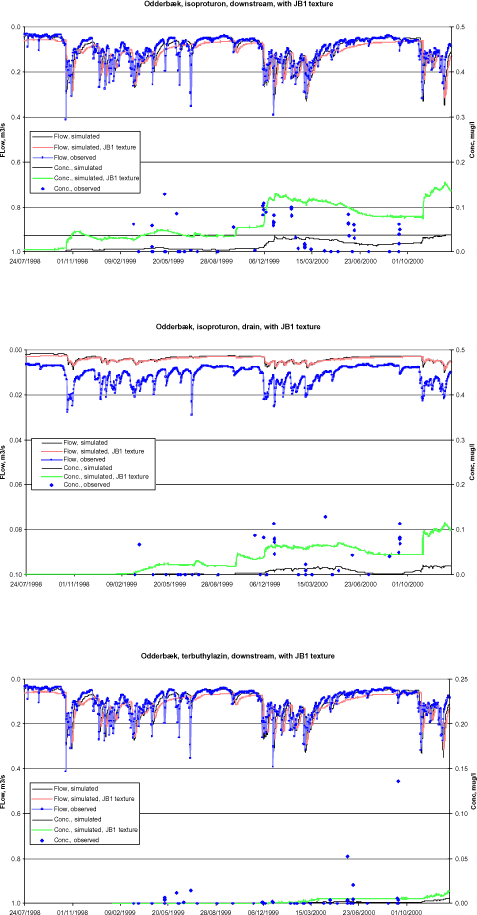
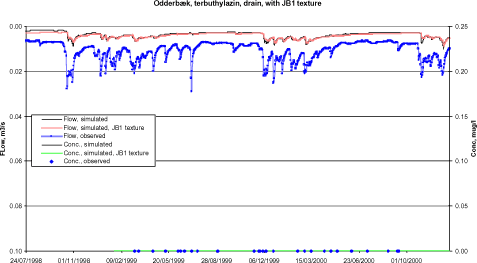
With regard to the effect on pesticide concentrations, it is seen from Figure 7.3 that in the situation with JB1 texture, the concentrations in the stream and in the drain are increased by a factor of 2 to 5. This is explained by the fact that the pesticides don’t reside as long time in the active upper soil layers where sorption and degradation is relatively significant, as compared to the case where the soil is more fine-textured. In conclusion, the flux of pesticides in the stream can be expected to increase by a factor of approximately 2 to 5 when the soil is more coarse-textured.


Figure 7.3 Pesticide concentration in stream and drain at Odder Bæk, simulated with observed and JB1 texture, both compared to observations, for bentazon, isoproturon, and terbuthylazin.
Figur 7-3 Pesticidkoncentration i å og dræn ved Odder Bæk, simuleret med observeret og JB1 textur, begge sammenlignet med observerede værdier, for bentazon, isoproturon, og terbuthylazin.
As a result of the problems described in Section 3.2, the fact that validation could not be carried out on the drain in Odder Bæk, and the fact that macropores appear to be present and important, the validation status of the Odder Bæk scenario is judged as poor.
7.4 Uncertainties related to input
The status of the basic inputs is described in Styczen et al., (2004a). The issue of the choice of foc-values has received attention there. The main additional inputs in the scenarios are the pesticide parameters.
The pesticide parameters used for calibration exercise came from the Pate database (The Danish EPA). It was generally very difficult to recalculate the values given to standard values as proposed by FOCUS (2000). This was particularly so for degradation values. Very often, the estimates of half-lives were effectively based on as little as two soil horizons. As these values are known to be very variable, the estimates are considered very uncertain. Estimates of Q10 were sometimes based on one observation only. With respect to sorption, Koc-factors in the database mostly lay within the interval of ±50 % of the average value.
Examples are given in Stycen et al. (2004a) of confidence intervals for pesticide simulations based on the uncertainty of Kd and DT50.
With respect to choice of sorption model, it was stated for several compounds in the database that sorption followed a Freundlich isotherm, but with no supporting information of the value of the exponent. For Bentazon, the dataset included experiments that clearly followed a linear isotherm and experiments that followed a Freundlich isotherm. The units of the Kd-values were not always clear in the database. It was decided in the calibration exercise to use linear isotherms for all compounds, not least because the choice of a Freundlich isotherm strongly increases sorption at the smallest concentrations, leading to very little leaching.
It is recommended that the EPA use linear sorption unless there is very strong evidence to support the choice of a Freundlich isotherm. In that case, it is important that the supporting documentation also has been generated in the concentration range of interest for leaching.
7.5 Uncertainties related to the interpretation of output
As a result of the errors and uncertainties discussed above, there is considerable uncertainty related to the output. There are, however, no expected errors generated by the methods of post-processing.
7.6 Strategies to further reduce the uncertainty
More work is required on the mechanism of generation of pesticide-loaded colloids. The developed description is included in the model, but it does not produce the concentrations observed in the field. The present oversimulation of groundwater concentration could be reduced somewhat by removing the colloid description and reparameterising the macropores.
It would be advantageous to include drain flow from the unsaturated zone in MIKE SHE. It is not an option in the existing model, but it is technically possible. It is expected that this would much improve the simulation of the peak concentrations in drain flow.
Thirdly, it would be advantageous to be able to store larger intermediate files with higher frequency than is presently the case. This could either be done if the 4.2 Giga limit could be broken or by changing the data storage system of MIKE SHE to open new files when the files had reached the maximum value. Alternatively the storage frequency should be made a function of concentration levels, and/or flow rates.
Version 1.0 Maj 2004, © Danish Environmental Protection Agency