|
4 Data handling
4.1 Data usedMost of the measurements were taken every two minutes. Due to the large amounts of data, hourly means were used in the calculations. Appendix F contains examples of the computed data from all four systems. 4.2 Calculation of refrigeration output and power consumptionThe specifications from the manufacturers were used to set up a formula for calculating the volumetric and isentropic efficiency of the compressors as a function of the pressure across the compressor and the condensation temperature.
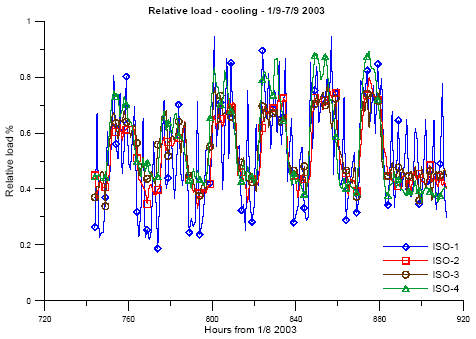
The formulas reproduce the data of the manufacturers in most of the temperature range better than 1% regarding refrigeration capacity and better than 2% regarding power consumption. Appendix A gives the information on the compressors in more detail. With the measured pressures and temperatures and the compressor capacity used, the formulas above yield refrigeration capacity and power consumption (See Appendix E). The power consumption calculated on the basis of compressor data was compared to the power consumption measured in order to get an estimate of the accuracy of the model. The actual coefficient of performance (COP) and the Carnot efficiency were also calculated. Since the condensation pressure can be influenced by heat recovery, a corrected COP corresponding to a condensation temperature of 30C was also calculated using the compressor models shown above. 4.3 Calculation of comparable energy consumptionsSince the four refrigeration systems were different in size, their energy consumptions could not be compared directly. Therefore, the energy consumption of a fictive supermarket with a reference load but with the COPs measured was calculated. The resulting energy consumptions were directly comparable, since the measured pump energy was added to the calculated energy consumption of the compressors of ISO-1 and ISO-3. The energy consumption was calculated for each day and for the period of measurement as a whole by summing the energy consumptions per hour. The energy consumptions per hour were calculated on the basis of hourly means of the power consumption. Two models were used to calculate comparable energy consumptions. The first model was based on a reference shop with a given specification of cooling and freezing gondolas, cooling racks, and cold and freeze storage. Appendix D gives a further description. The other model is based on the given cooling load and freezing load. This load is based on measurements made during the period 1/8 – 31/12, 2003. On the basis of these measurements relative load profiles were calculated for each of the four systems. The relative load profile expresses the immediate refrigeration requirement as a percentage of the maximum refrigeration requirement during the whole period of measurement. The relative load profiles for the four systems were almost identical. This can be seen in figure 4.1, which shows the relative cooling load for the period 1/9 - 7/9, 2003. Appendix C shows the relative load profiles of the entire period of measurement and for cooling and freezing in the period 1/9 - 7/9, 2004. The relative load profile of the ISO-2 system was used in the further calculations. For the reference system a maximum load of 110 kW was used on the cooling side and a maximum load of 40 kW was used on the freezing side. Appendix E gives a further description of the method.
Figure 4.1. Relative load profile for cooling section
|
