|
5 Comparisons
5.1 Measured and calculated power/energy consumptionThe measured energy consumption of ISO-2 and ISO-4 cannot be compared directly with the calculated energy consumption, since the measured energy consumption includes the consumption by anti sweat heaters, fans and defrosting. A correction was made for these loads. The number of defrosting events and their duration were estimated on the basis of the measurements. The calculated energy consumption was based on the assumption that the defrosting heaters were in use during the entire defrosting event. One of the power meters for ISO-4 was not working. But in February 2004 both of the power meters were functioning. Thus power consumption measured in February can be compared with the calculated consumption. The deviation between the corrected energy consumption per day and the calculated consumption per day in February is less than 11% for ISO-2, while ISO-4 produces a deviation of about 40% when corrections are made for anti sweat heat eTc. Without corrections the deviation is less than 10%. For ISO-1 and ISO-3 the measured and calculated consumptions are directly comparable if the circulation pump power consumption is added to the calculated consumption. For ISO-1 the deviation between measured and calculated consumption is 20%. The power measurement on ISO-3 has a calibration error since the measured power consumption is much greater than the installed compressor power consumption. In February 2004 an attempt was made at applying a correct calibration factor, but the measured power consumption was now much lower than the calculated consumption. This power meter should, therefore, be re-calibrated. (NB! In the following, measured consumption is the consumption calculated on the basis of measured used compressor capacity and the operational parameters for the compressors). 5.2 Mean coefficient of performance and Carnot efficiencyThe mean coefficient of performance and the Carnot efficiency was calculated for the period 1/8 - 31/12 2003 on the basis of condensation and evaporation temperatures, irrespective of the circulation pump consumption. The result is shown in table 5.1 below.
Table 5.1. Mean COPs and Carnot efficiencies In the table above, index C stands for the cooling circuit and index F stands for the freezing circuit. Index cor indicates that the mean has been calculated for a fixed condensation temperature of 30°C. For the cascade systems the index tot indicates that the data for the freezing circuits of the cascade system have been converted into a total COP/Carnot efficiency for the freezing circuit. This has been done adding the part of the consumption in the high-temperature circuit, which goes to the freezing circuit to the consumption of the freezing circuit. This corresponds to having a cascade system for freezing alone. Table 5.1 shows that the cascade systems have a higher COP than the other two systems. It also shows that the systems have almost the same Carnot efficiency in the cooling circuit, whereas ISO-4 has a considerably lower Carnot efficiency in the freezing circuit. 5.3 Consumption based on mean coefficient of performanceBased on the above means, energy consumption for the period of measurement was calculated for the fictive system with the reference profile as load. The result is shown in table 5.2 below. In table 5.2, (corrected) indicates that the energy consumption was calculated on the basis of means for COPCor with a fixed condensation temperature of 30°C, while (measured) indicates that the energy consumption was calculated on the basis of means for COP with the measured condensation temperature.
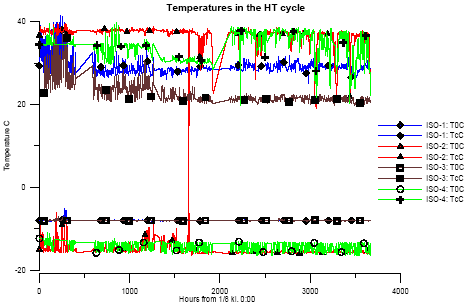
Table 5.2. Energy consumption based on mean COP for the period 1/8-31/12 2003 As can be seen in table 5.2, ISO-1, ISO-2, and ISO-3 have almost the same corrected consumption, whereas ISO-4 has consumption, which is almost 20% greater. With the measured mean for COP, ISO-3 has the lowest consumption, the consumption of ISO-1 is about 10% higher, that of ISO-2 is about 30% higher, and that of ISO-4 is about 50% higher than for ISO-3. This shows that the condensation temperature has a major influence on energy consumption. ISO-1 has operated with a mean condensation temperature of 28 °C, ISO-2 with a mean of 38 °C, ISO-3 with a mean of 28 °C, and ISO-4 with a mean of 32 °C during the first half of the period of measurement and 38 C during the second half. This change in condensation temperature is due to the heat requirement, which is met through heat recovery from the condensers. Figure 5.1 shows the condensation temperatures during the period of measurement.
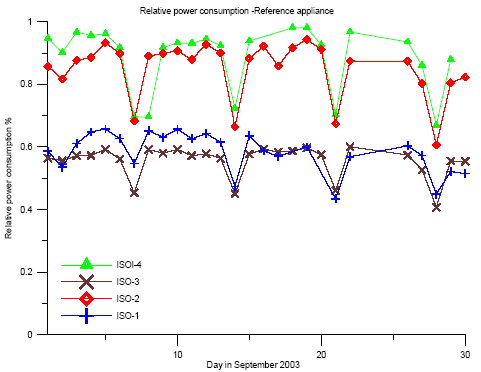
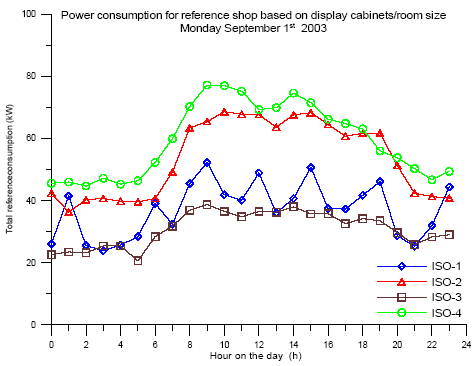
Figure 5.1. Condensation and evaporation temperatures Even though ISO-1 and ISO-3 are indirectly air-cooled via a cooling water circuit, they have lower condensation temperatures than the systems ISO-2 and ISO-4 which have directly air-cooled condensers. Since the cascade systems have the same refrigerant in the high-temperature circuit as the classic systems, it must be concluded that the cascade systems have more efficient/larger heat transfer surfaces. Figure 5.1 shows that the cascade systems operate with an evaporation temperature of –8 °C in the cooling circuit whereas the other two systems operate with a temperature of –15 °C. In the freezing circuits the evaporation temperature is –30°C in the cascade systems and –35 °C in the other systems. Since the evaporators are similar in the four systems, the higher temperatures in the cascade systems can only be due to the heat conductivity of the refrigerant. Part of the higher evaporation temperature in the ISO-1 and ISO-3 cooling circuits can also be due to the fact that these have flooded evaporators in the cooling circuits. The higher evaporation temperature results in a better COP, which is, however, outweighed by the energy consumption of the circulation pumps. Table 5.2 shows that the energy consumption of the pumps is about 10% of the total consumption. But the pumps operate unregulated and thus with full capacity even when the load is low. Introducing a capacity regulation of the pumps can probably lower the energy consumption. 5.4 Consumption based on reference shop and actual COPIn the previous section the four systems were evaluated on the basis of means. Due to the varying operational conditions, this can give an erroneous picture of the true energy consumption. Therefore, a calculation was made for the reference system using the measured COP. Two methods were used to determine the load on the reference system. With the first method the measured consumption was scaled using a scaling factor based on the specified appliance/store data. With the second method the load is determined on the basis of a maximum load and a reference load profile. 5.4.1 Specified appliance data/store dataFrom hourly means of measured values of evaporation and condensation pressures, suction temperatures of the compressors, and applied compressor capacity the energy consumption was calculated on the basis of data from the manufacturers of the compressors. The consumption was corrected to consumption at a condensation temperature of 30°C, in order to eliminate the effects of different operation strategies on the condenser side (e.g., heat recovery). Data on the refrigeration needs of each appliance and cooling/freezing store in the supermarkets weresupplied from the manufacture. These data were converted into nominal consumptions per appliance m and per store m 3. The consumption by the gondolas is given per circumference m in order to include the end gondolas. By this is taking into account that most of the gondolas are double gondolas. Since the nominal consumption per appliance m and per store m 3 in the supermarkets is not equal (the appliances in the newest supermarkets have a lower nominal consumption), means for the four supermarkets were calculated. A reference supermarket was defined with 50m cooling and freezing gondolas, 35m cooling racks, 12m counters, 350m 3 cold storage, and 100m 3 freeze storage. These figures constitute means from the four supermarkets. The energy consumption of each supermarket was converted to a consumption of the reference supermarket. This was done on the assumption that the ratio of nominal consumption to actual consumption is the same for the actual supermarkets and the reference supermarket. This means that the evaporation temperature of the reference supermarket is the same as the measured evaporation temperature. The reference loads on the cooling and frost sections of the cascade systems were determined first. The load on the high-temperature section is the sum of the load from freezing appliances plus the power consumption of the low-temperature compressors and the load from the cooling appliances. This method is described in more detail in Appendix D. Figure 5.2 shows a comparison of the energy consumptions during September, which are similar to those of the rest of the period of measurement.
Figure 5.2. Energy consumption of reference shop based on measured energy consumptions (month) Figure 5.3 shows a comparison of the energy consumptions during a single day (1 September 2003)
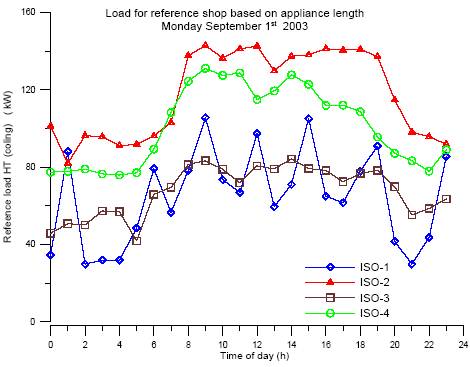
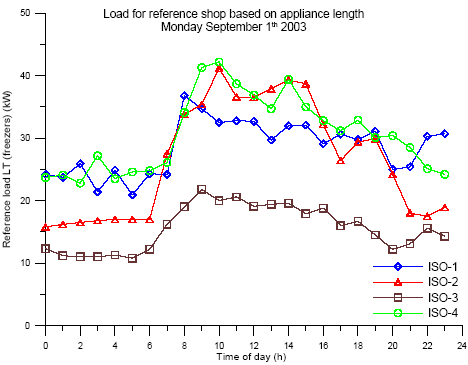
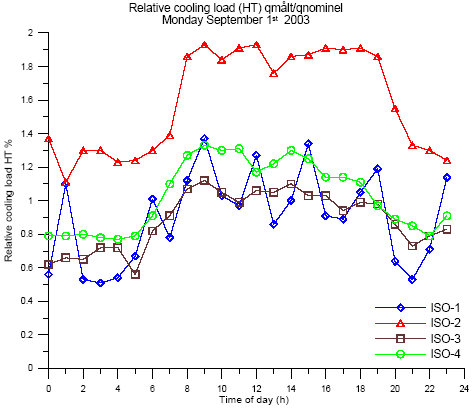
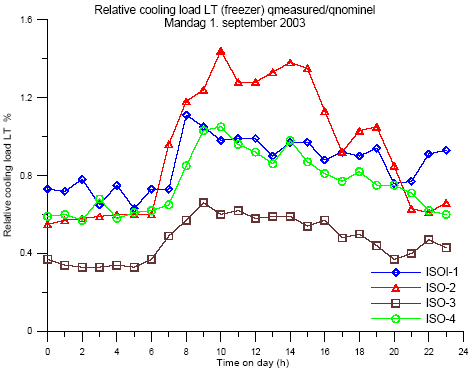
Figure 5.3. Energy consumption of reference shop based on measured energy consumptions (day). Figures 5.2 and 5.3 show that the energy consumptions of the reference shop with data from ISO-1 and ISO-3 are about 2/3 of the energy consumptions of the reference shop with data from ISO-2 and ISO-4. But a critical viewing of the calculated energy consumptions of the reference shop shows that the loads on the reference shop are not the same with data from the four supermarkets. This is shown in figure 5.4 (load on cooling). The loads on cooling for ISO-1 and ISO-3 are about 2/3 of the loads for ISO-2 and ISO-4. With respect to load on freezing, ISO-3 is different from ISO-1, ISO-2, and ISO-4. The load is considerably higher for these than for ISO-3, as shown in figure 5.5. This is in part due to difference in relative load qmeasured/qnominalt as shown in figures 5.6 and 5.7. These figures show that ISO-4 especially has a load profile, which is very different from those of the other three. This difference must be caused by a scaling factor, the nominal load, which is too uncertain. The conclusion must be that, due to uncertain nominal refrigeration requirements, a "simple" scaling based on nominal refrigeration requirements does not give a true picture of the energy consumption of the supermarkets.
Figure 5.4. Cooling load for reference shop based on measured loads (day).
Figure 5.5. Freezing load for reference shop based on measured loads (day)
Figure 5.6. Relative load on cooling (day).
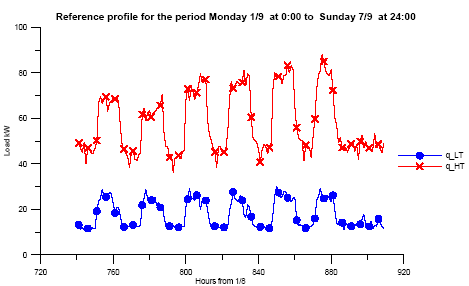
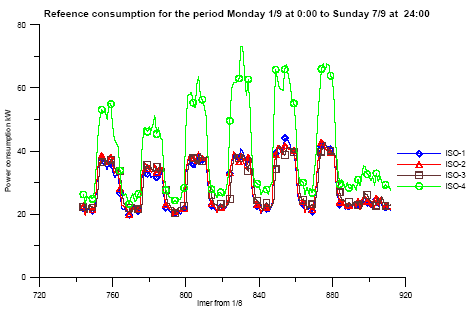
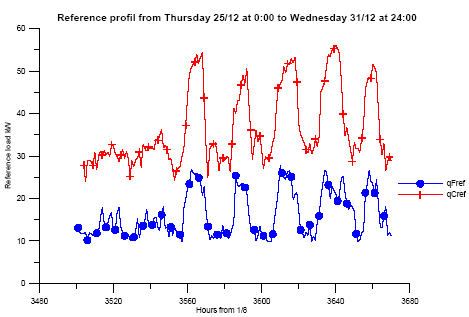
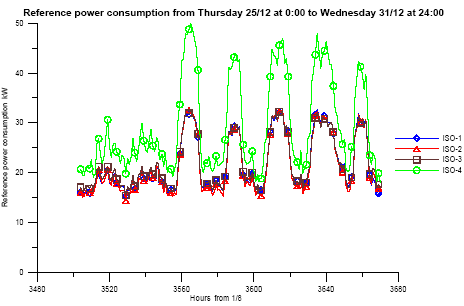
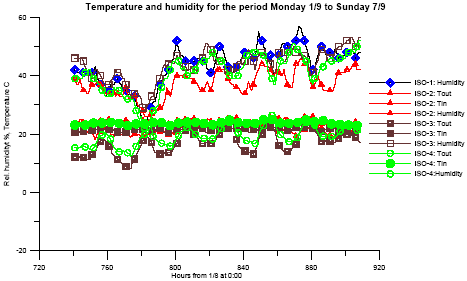
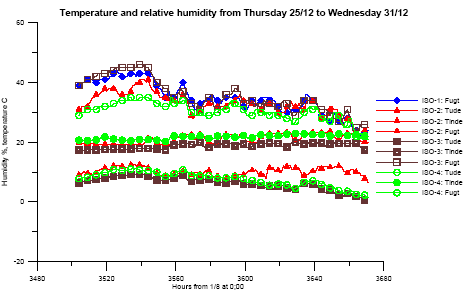
Figure 5.7. Relative load on freezing (day) 5.4.2 Specified load profileAs mentioned in section 4.3, relative load profiles were generated on the basis of measurements from the period 1/8 – 31/12 2003. The relative load profile expresses the immediate refrigeration requirement as a percentage of the maximum refrigeration requirement during the whole period of measurement. The relative load profiles for the ISO-2 system were used in the calculations. A maximum load on the cooling side of 110 kW and a maximum load on the freezing side of 40 kW has been used for the reference system. This method is described in more detail in Appendix E. The method corresponds to the method described in section 5.3, except that the actual COP was used here instead of the mean COP together with the load profile to determine the energy consumption. Figures 5.8 and 5.9 show the reference load and the corresponding total power consumption based on hourly means (consumption by pumps included) for the reference system during a week where the load was high. Similarly, figures 5.10 and 5.11 show load and power consumption during a week where the load was low. Figures 5.9 and 5.11 show that ISO-1, ISO-2, and ISO-3 have the same power consumptions when the load is the same, whereas ISO-4 has considerably higher power consumption. The considerably higher power consumption of ISO-4 must be due to the lower Carnot efficiency of the compressors. All shops have comparable ambient operation conditions: In- and outdoors temperatures and humidity in the shop (See figures 5.12 and 5.13).
Figure 5.8. Reference load with high load
Figure 5.9. Power consumption with high load
Figure 5.10. Load profile with low load
Figure 5.11. Power consumption with low load
Figure 5.12. Humidity and temperature conditions with high load
Figure 5.13. Humidity and temperature conditions with low load
|
