|
Survey of Estrogenic Activity in the Danish Aquatic Environment 2 Chemical analysis2.1 Overview of analytical concept The current document gives a detailed description of how results are generated and quantified in the current project. Several advanced techniques are used through out the project. As these often are linked together into a whole analytical method, an overview of the whole process is given in the main document. More detailed information of the different processes is only given in the separate sections in Appendix 1. 2.1 Overview of analytical conceptThe overall analytical procedure is as follows. One 8-10 litre sample is collected from the sample site and instantaneously acidified to pH 3. The samples are then transported to the laboratory within 24 hours. As illustrated in Figure 2.1, the 8-10 litre samples is divided on the sampling location into four 2 litres sub-samples that are treated differently. Therefore they are marked 01, 02, 03 and 04, respectively together with a label for identifying details on sampling location and time. Each of the four sub-samples marked 01, 02, 03 and 04 is treated as follows:
An overview of all sample treatment steps is shown in Figure 2.1. The rationale underlying this scheme is; 1) that samples are analysed both chemically (on GC-MS-MS) and biologically (with YES-assay), 2) that de-conjugation of 01A- and 03-samples enables the distinction between concentration levels of both the total estrogens and the free estrogens (01B and 02), and 3) an extra sample is stored for other purposes. The purpose of each step in the sample treatment is explained by the following procedure. After collection and sub-division into four sub-samples of 2 L, the samples are filtered to remove particles. Followed by addition to 02 and 03 samples of deutorated internal standards needed for the chemical analysis. All four samples are then eluted through a solid phase extraction (SPE) column which are stored at -18°C until further treatment. After storage, the analytes are eluted from the SPE columns using a few millilitres of acetone and the samples are thereby pre-concentrated up to 5000 times. Samples analyzed with GC-MS/MS, needs an additional clean-up step using silica gel to avoid interfering signals on the mass spectrometer. Prior to detection on GC-MS-MS, the analytes are derivatized using a mixture of N-methyl-N-(trimethylsilyl)-trifluoroacetamide (MSTFA), N-trimethylsilylimidazole (TMSI), and 1,4-dithioerythritol (DTE). Figure 2.1: Overview of the sample treatment from sampling to chemical or biological analysis. In the following chapters, each sample preparation step is described in detail. Separate sections describe the GC-MS-MS method and the YES-assay as well and the data treatment used to these two methods. 2.2 Sample preparation2.2.1 Particle filtering and solid phase extractionEach sub-sample is filtered two times using glass fibre filters (type GF/C and GF/D) in a vacuum filtration system. The filtered sub-samples are thereafter weighed out and applied onto the solid phase extraction system (SPE). After particle filtering the internal standards d4E1, d5E2 and d4EE2 are added to 02 and 03 sub-samples, using a 250 µL methanol solution at concentrations of 0.080, 0.079 and 0.078 ng/µL, respectively. Furthermore the deconjugation standards MUF-G and EQ-S are also added to 02 and 03 sub-samples, with a 250 µL methanol solution at concentrations of 0.112 and 0.101 ng/µL, respectively. The C18-columns (Varian, Mega Bond Elut® 1 g/6 mL) are preconditioned before use by serial washing with 5 mL hexane, 2 mL acetone, 5 mL methanol and 7 mL water (with sulphuric acid added to pH=3), respectively. The sub-sample is then applied to the C18-column by a vacuum manifold and Teflon® tubes. After extraction, the SPE columns are dried by pressing N2-gas through the column for one hour. The SPE cartridges were stored at –18°C until analysis. After storage, 5 mL of acetone was used to elute the analytes from the SPE-cartridge. 2.2.2 DeconjugationThe acetone extract from the SPE column (only half of the 5 mL is used for the 01 sample) is evaporated to dryness under N2-gas. Then, the samples are re-dissolved in 2 mL 0.1 M acetic acid buffer (pH=5), containing -glucuronidase enzyme with minimum 2000 units glucuronidase activity and 150 units sulphatase activity (HP-2 from Helix pomatia (Sigma, Germany)) and incubated for 24 h at 40°C to deconjugate the glucuronide or sulphate moiety. The incubation is terminated by addition of 5 mL acidified water (pH=3). The incubation mixture is then extracted on preconditioned C18-columns as described previously. 2.2.3 Silica gel clean upSilica gel clean up were performed on columns prepared by suspending 1 g of silica gel 60 (Merck, Germany) in hexane/acetone mixture (65/35), thereafter transferring the slurry into a 3 mL glass column (Merck LiChrolut®, Germany) with a bottom-filter installed (MN Chromabond®, Denmark). Only sub-samples 02 and 03 are cleaned up using silica gel. The SPE extract (5 mL acetone) is evaporated to dryness under N2 gas and re-suspended in approx. 200 µL hexane/acetone mixture (65/35 by volume). The 200 µL suspension is transferred to a freshly prepared silica gel column and eluted with 5 mL of the hexane/acetone mixture (65/35 by volume). 2.2.4 DerivatisationTo the extract from silica gel clean up (200 µL), the derivatisation standard 17β-estradiole-17-acetate (AE2) dissolved in acetone were added to achieve 20 ng in the sample. Then the solution was evaporated to dryness under N2-gas. The analytes were derivatized by adding 50 µL derivatisation mixture and then incubating for 1 hour at 60 °C. The composition of this mixture is 1000 µL (N-methyl-N-(trimethylsilyl)-trifluoroacetamide (MSTFA) mixed with 2 µL of N-trimethylsilylimidazole (TMSI) in which 2 mg 1,4-dithioerythritol (DTE) was dissolved. Thereafter the liquid were evaporated to dryness using N2-gas and dissolved in 200 µL heptane solutions containing 0.02 ng/µL of 3-methyl-estrone (MeE1) and transferred to an autosampler vial. 2.2.5 GC-MS/MSSeparation and detection of the analytes were accomplished using a gaschromatographic-tandem mass spectrometry system (GC-MS/MS) consisting of a gas-chromatograph (Varian, CP-3800) and a triple quadrupole mass spectrometer (Varian, MS 1200 Quadrupole MS/MS system). A programmable temperature vaporiser injector (PTV) was installed on the GC. The MS was operated in the electron impact mode (EI). Retention times, ion masses and collision energies for all analytes are presented on Figure 2-2 on the following page. 10 µL of analytes were injected, at 1 µL/second, in the PTV at a temperature of 120 °C. After 0.3 min the split was closed and the PTV-temperature where elevated at a rate of 200 °C/minute to 300 °C. Two minutes after injection the split were opened at a ratio of 30/100. The GC where operated at a constant flow of helium (He, purity level, Alphagaz, Germany) at 1 mL/minute though a Varian FactorFour capillary column (30 m 0.25 mm i.d.). The temperature programme of the GC is described in Table 2.1. The total run-time including cooling before next run was approximately 30 minutes. Table 2.1: GC temperature programme
The temperature in the transfer line was constant at 300 °C. Argon (purity level , Alphagaz, Germany) was used as collision gas. CO2 was applied as injector coolant for a faster cooling/equilibration for returning to starting point temperature. 2.2.6 Identification of analytes and specification of MS-conditionsThe identities of the analytes were proven on basis of their chromatographic retention time and the masses of precursor and product ions. Furthermore the ratio between product ions should not vary more than 20%. Figure 2.2 lists the parameters needed for unambiguous identification of the analytes.
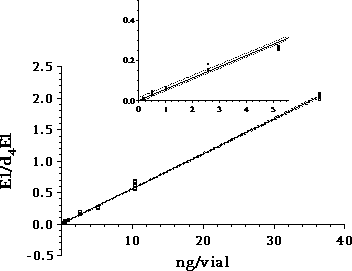
Figure 2.2: GC-MS-MS parameters for analytes included in the chemical analysis. 2.2.7 QuantificationWithin each series of samples analyzed on GC-MS/MS, a calibration curve with standard samples was analysed (ranging from 0.2 to 200 ng/vial). The standard samples undergo only derivatization. The deuterated internal standards are added in amounts as close to those of the samples analyzed in the project (approx. 10 ng/L in samples, corresponding to approximately 20 ng/vial). The calibration curve for the steroid estrogens E1, E2 and EE2 are generated relative to the internal standards d4E1, d5E2 and d4EE2, respectively. Deuterated E2 was not available, therefore this substances is related to the d5E2 standard. The standard curve with steroid estrogens was prepared by analyzing 8 to 10 samples evenly distributed in the range from 0.2 to 200 ng/vial. The calibration curve is fitted to a linear equation. An example of a standard curve is given in Figure 2.3. During the analyses, the sensitivity of the instrument decreased gradually. Therefore the ionisation region was cleaned after approximately 48 injections. As all vials were injected three times, the number vials analysed in an analytical batch was approximately 16. When analysing a set of samples and standards, the number of vials was typically above this number and therefore the samples and standards was distributed in several analytical batches. In order to control that the analytical signal was unchanged between batches two standards was analysed in each batch whereas the remaining standards and samples were only analysed once.
Figure 2.3: Standard curve for E1. Detailed view of the low concentrations is shown in the small curve.
|