|
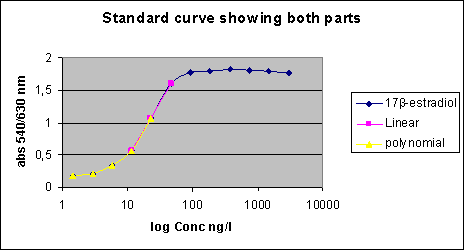
Survey of Estrogenic Activity in the Danish Aquatic Environment 3 In vitro test - YES assay standard curves3.1 Calculation of E2 equivalents in the YES-assay 3.1 Calculation of E2 equivalents in the YES-assayResults from in vitro bioassays are normally expressed in terms of relative potencies (in our case 17β-estradiol equivalents) and in the calculation of relative potencies, the response from the sample with an unknown content is compared with the response of a dilution series of the agent in question. The relative potency is then calculated from the ratio between the EC50 values of the standard curve and the sample response curve. This fairly simple calculation is only possible if standard curves and response curves show identical slope and efficacy (maximum response), which was not the case in the majority of the YES-assays conducted on environmental samples in the present project. Sample response curves in the present project showed a variety of different shapes as shown in the figure below. Besides these types of curves (that are real results from the project), some standard curves and sample response curves showed decreased absorbance for the least diluted samples; however, the latter phenomenon does not affect the calculation of E2 equivalents. Figure 3.1 Sample response curves It is convincingly argued by Villeneuve et al. (2000) that results from in vitro bioassays should only be expressed in terms of relative potencies with care if standard curves and response curves have different shapes and it should be noted in the presentation of the results which values are calculated by means of a simple EC50 ratio and which values are the result of calculations on non-identically shaped standard curves and sample response curves. Villeneuve et al.'s (2000) considerations are mainly based on interaction between dioxins and cell lines responding to Ah-receptor agonists. Most of the pure chemicals tested in the YES-assay yield response curves that are parallel with the 17β-estradiol standard curve; this is true for the estrone, estriol, diethylstilbestrone, genistein and bisphenol A (Routledge & Sumpter 1996), butyl-, pentyl-, hexyl-, heptyl-, octyl- and nonylphenol (Routledge & Sumpter 1997), methyl-, ethyl-, propyl- and butylparaben (Routledge et al. 1998). o,p-DDT, however, yield response curves with a slope and an efficacy lower than the 17β-estradiol standard curve (Routledge & Sumpter 1996). Deviation from parallelism in the environmental samples may indicate:
It is apparent from Table 3.1 that the samples with non-parallel response curves are not randomly distributed among the different types of environmental samples. WWTP effluents from categories A and especially C and D in our investigation show a majority of parallel response curves, whereas this is not the case for the B category. WWTP effluents are – according to the scientific literature (e.g. Desbrow et al. 1998; Witters et al. 2001; Kirk et al 2002; Svenson et al. 2003; Aerni et al. 2004; Rutishauser et al. 2004) - the ones most often assayed with the YES-assay and it is thus not surprising that the issue of non-parallelism has not been dealt with by previous investigators, simply because there has not necessarily been any need to consider this aspect. Table 3.1. The number of individual samples in each category of environmental samples exhibiting parallel and non-parallel response curves relative to the 17β-estradiol standard curve. Both free and deconjugated samples are treated as individual samples in this table and samples with no response are not included.
The majority of non-parallel response curves appears in samples from the general freshwater environment (especially categories L and M ). Published data on the use of the YES-assay for these types of samples are very scarce. Witters et al. (2001) determined estrogenic activity in Flemish WWTP effluents and general surface waters and they actually show the response curves in their paper. Parallel and non-parallel response curves were obtained for WWTP effluents and general surface water, respectively, and Witters et al. (2001) do not explain how 17β-estradiol equivalents were calculated for the non-parallel surface water samples (except that the linear part of the standard curve was used). In chemical analysis, matrix effects can often be overcome by use of the standard addition method. The standard addition method, however, requires a higher amount of sample and, also, the consummation of time and resources in the analysis is considerable. Furthermore, the use of the standard addition method is not validated for use in in vitro bioassays. In spite of these considerations, standard addition has been tested for a few of the environmental samples with slopes differing from the slope of the 17β-estradiol standard curve. However, standard addition does not seem to consistently be able to deal with and overcome the problems associated this type of response. 3.2 How E2 equivalents were calculatedThe 17β-estradiol standard curve and the sample response curves are S-shaped and another way of attempting to overcome the problem with lack of parallelism is to use the lower, curved part of the graphs, only. This part of the curves can be efficiently regressed by the use of second order polynomia. It was decided to use the following procedure in the evaluation of the results:
Since the shapes of the lower part of the standard curve and the curves from the environmental samples are not necessarily identical, the 17β-estradiol equivalents calculated from sample response curves of a different shape than the standard curve are associated with a higher uncertainty than the E2 equivalents calculated from sample response curves and standard curves of identical form. Therefore, in the results datasheet, the shapes of all of the individual response curves have been indicated by the marks shown in the figure in section 3.1. For sample response curves with slopes similar to the standard curve, the two ways of calculation basically gave the same results (see example 3 on the next pages) and the average of both methods has been given. 3.3 Explanation of data treatment exemplified in a spreadsheet
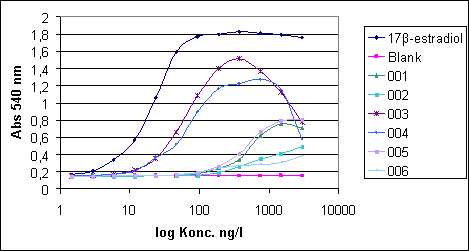
Absorbances are converted to concentrations by means of the equations for the straight line and the second order equation. The degree of up-concentration of the sample is included. Based on the shape and the slope of the standard curve and the sample response curve and the consistency of the calculated data, it is assessed (visually) which part of the standard curve that corresponds best with the shape and slope of the sample response curve. 3.4 Six real examplesThe calculation of E2 equivalents from 6 typical sample response curves are shown below. Spreadsheets for values calculated from both linear and polynomial regressions are shown. The values finally used in the calculations of E2 equivalents are highlighted in the spreadsheets.
Figure 3.3 Six typical sample response curves Click here to see Absorbtion tables Considerations regarding the calculation of the E2 equivalents from the individual sample response curves. Sample 001: The slope of the response curve is very different from the slope of the E2 standard curve which makes it difficult to use the straight part of the E2 standard curve for comparison; in fact, only point 3 (0.27) is situated on the linear part of the curve. Contrary to this, there is a good correspondence with the polynomial part of the curve from point 3 to point 6 (0.32; 0.29; 0.32; 0.33). In this case only the lower polynomial part of the curve is used in the calculation with the result 0.32 ng/l. Sample 002: The sample response curve is linear between point 1 and 5, but the slope is different from the slope of the E2 standard curve. Between point 4 and 6 (0.19; 0.20; 0.24) there is some similarity – although far from perfect - with the polynomial part of the E2 standard curve. Only the polynomial curve is used in the calculation and the result from the calculation for sample 2, which is 0.21 ng/l has less certainty than the result from sample 1. Sample 003: The sample response curve is largely parallel with E2 standard curve. Point 5,6 and 7 (3.77; 5,38; 4.98) correspond to the linear part of the E2 standard curve and point 7 to10 (5,48; 4.88; 4,53; 4.89) correspond with the polynomial part. An average of the results from the to curves is used to determine the concentration to 4.82 ng/l Sample 004: The slope of the sample response curve is so different from the slope of the E2 standard curve that only one point (point 6: 4,10) on the sample response curve falls on the linear part. Again, there is a nice correspondence with the polynomial part (Point 7-10: 4,11; 5,18; 4,08; 4,89) which is used in the calculation to determine the concentration to 4,57 ng/l. Sample 005: Similar to sample 1 and treated identically. Point 3 (0.31) on the linear part is not used. Point 3 to 6 (0.34; 0.38; 0.39; 0.39) on the polynomial part are used to calculate the result: 0.38 ng/l. Sample 006: The correspondence with the polynomial part is weak – too weak for a calculation of a result. Means are calculated and the amount of original water sample is included in the calculation for each sample. 3.5 ReferencesAerni, H-R, B Kobler, BV Rutishauser, FE Wettstein, R Fischer, W Giger, A Hungerbühler, MD Marazuela, A Peter, R Schönenberger, AC Vögeli, M J-F Suter, RIK Eggen. 2004. Combined biological and chemical assessment of estrogenic activities in wastewater treatment plant effluents. Anal. Bioanal. Chem. 378, 688-696. Desbrow, C, EJ Routledge, GC Brighty, JP Sumpter, M Waldock.1998. Identification of estrogenic chemicals in STW effluent. 1. Chemical fractionation and in vitro biological screeing. Environ. Sci. Technol. 32, 1549-1558. Kirk, LA, CR Tyler, CM Lye, JP Sumpter. 2002. Changes in estrogenic and androgenic activities at different stages of treatment in wastewater treatment works. Environ. Toxicol. Chem. 21, 972-979. Routledge, EJ, JP Sumpter. 1996. Estrogenic activity of surfactants and some of their degradation products assessed using a recombinant yeast screen. Environ. Toxicol. Chem. 15, 241-248. Routledge, EJ, J Parker, J Odum, J Ashby, JP Sumpter. 1998. Some alkyl hydroxy benzoate preservatives (parabens) are estrogenic. Toxicol. Appl. Pharmacol. 153, 12-19. Rutishauser, BV, M Pesonen, BI Escher, GE Ackermann, H-R Aerni, M J-F Suter, RIL Eggen. 2004. Comparative analysis of estrogenic activity in sewage treatment plant effluents involving three in vitro assays and chemical analysis of steroids. Environ. Toxicol. Chem. 23, 857-864. Svenson, A, A-S Allard, M Ek. 2003. Removal of estrogenicity in Swedish municipal sewage treatment plants. Wat. Res. 37, 4433-4443. Villeneuve, DL, AL Blankenship, JP Giesy. 2000. Derivation and application of relative potency estimates based on in vitro bioassay results. Environ. Toxicol Chem. 19, 2835-2843. Witters, HE, C Vangenechten, P Berckmans. 2001. Detection of estrogenic activity in Flemish surface waters using an in vitro recombinant assay with yeast cells. Wat. Sci. Technol. 43, 117-123.
|