|
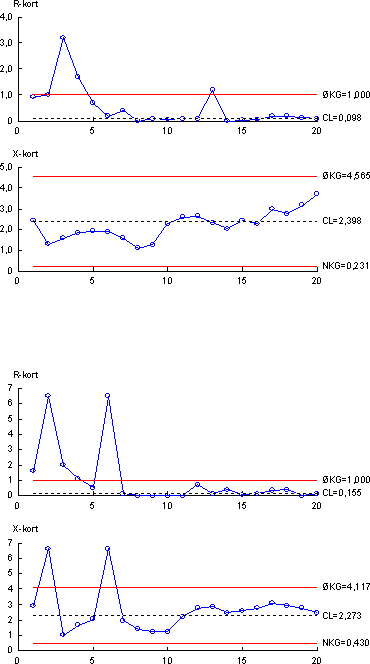
Survey of Estrogenic Activity in the Danish Aquatic Environment 4 Quality assurance data for YES assay and chemical analysis4.1 Quality assurance measures 4.1 Quality assurance measuresSeveral different measures have been used to ensure the quality of the results obtained during this project. The quality assurance elements consist of 1) an internal quality control scheme and 2) measures to compare results with other laboratories. 4.1.1 Internal quality controlIn connection with every series of samples a set of quality control samples is analysed along with the real samples, i.e. taken through the total analytical procedure. The set of quality control samples consists of one blank sample (tap water) and two identical control samples (tap water to which a mixture of the three estrogens estrone, β-estradiol and ethynylestradiol (E1, E2 and EE2) has been added at a level 2.5 ng/l of each analyte). The same set of quality control samples are used for the biological assay and for the chemical analytical method. Results from the control samples are collected in quality control charts. The four quality control charts are shown in Figure 4.1. The control chart displays mean values of the two control samples for each series of samples (X-chart) as well as the difference between duplicate results (R-chart). 4.1.2 Precision and Limit of DetectionFrom the control charts the precision can be calculated for each parameter measured. The control chart with results from the biological assay gave an overall precision (RSD, reproducibility)) of 29 % from measurement of estrogenic activity. Similarly, overall precision from the chemical determination of the three analytes were 30 % (E2), 17 % (E1) and 27 % (EE2), respectively. From the total number of mean values in the control chart the measured overall mean value is calculated. The overall calculated mean values for each parameter can be compared to the nominal values for the control samples to estimate accuracy of the two (biological assay and analytical chemical) methods. For the biological assay an overall mean value of 6.80 ng/l was calculated. When compared to a nominal value of 5.92, this indicates an accuracy (or recovery) of 115 %. Similarly for the analytical chemical method, overall mean values of 2.40 ng/l E2), 2.65 ng/l (E1) and 2,27 ng/l (EE2), respectively were calculated. When compared to the nominal values of 2.78 ng/l (E2), 2.78 ng/l (E1), and 2.65 ng/l (EE2) respectively, this indicates accuracies of 86 % (E2), 95 % (E1) and 86 % (EE2).
Figure 4.1 Control chart showing results from YES-assay measurements of estrogenic actvity (top) and analytical chemical determination of estrone (bottom) in quality control samples. (Upper part of each chart shows difference of duplicate measurements, lower part of each chart shows mean values).
Figure 4.2 Control chart showing results from analytical chemical determination of -estradiol (top) and ethynylestradiol (bottom) in quality control samples. (Upper part of each chart shows difference of duplicate measurements, lower part of each chart shows mean values). For the chemical parameters the Limit of Detection (LOD) was used as a measurement of the lowest amount that can be determined by the method used. The LOD is defined by the formula:
where Sw is the standard deviation determined in the same series of samples (repeatability) at concentrations near LOD and t0.995(f) is between 3 and 4 with more than 6 repetitions. The LOD was determined by an 8-fold determination of tap water spiked with 0.2 ng/L of each of the 4 components. This resulted in calculated LODs well below 0.1 ng/L and on this basis a general LOD of 0.1 was determined. 4.1.3 Interlaboratory comparison - chemical analysesThe two laboratories were performing chemical analysis using two instruments of same brand and model. In order to verify that all data produced during the project were uniform, an internal control study was performed. This involved analysis of identical samples on both laboratories. Briefly, three surface water samples and three WWTP-effluent samples were collected and divided into two four litre samples. One of these was spiked with E1, E2, EE2 and α-E2 to concentrations of 2.5 and 10 ng/L. The deuterated standards were added to both spiked and un-spiked water samples. Both were divided in two 2-litre samples that were eluted through SPE-columns. The resulting two sets of identical SPE-columns (spiked and un-spiked) were analysed on each laboratory producing data to the project. 4.1.3.1 ResultsTable 4.1 lists all results measured by the two laboratories. The measured concentrations are presented together with 95% confidence limits. Confidence limits are calculated on basis of the relative standard deviations (RSD) obtained for the control samples analysed throughout the project (see previous section). An illustration of the results are given in Figure 4.3, which shows the results obtained for E1 and as can be seen, the confidence intervals overlap in the majority of samples, indicating that the results from the two laboratories are uniform. This conclusion is supported by the fact that the high number of quality control samples that has been analyzed during the project also shows an acceptable agreement between the two laboratories. In the current study, there are however, a few results showing diverging concentration in identical samples (marked with asterix in the table). These erroneous results relate to the fact that the samples used in the current study were unusually dirty and therefore resulted in high matrix interference. Table 4.1: Results obtained in interlaboratory comparison. Samples which could not be considered as uniform within 95% confidence limits are marked with asterix.
Figure 4.3: Results obtained in inter-laboratory comparison for E1. Error bars indicate 95% confidence intervals. The abbreviations denote surface water (SW) and wastewater treatment effluent (WWTP). 4.1.4 Interlaboratory comparison - YES assayFor method calibration, seven samples were analysed in Professor John Sumpter's laboratory at Brunel University as well as in SDU's laboratory. The result of this exercise is shown in Table 4.2 below. Table 4.2: Results from the intercalibration of the YES-assay between professor John Sumpter's laboratory at Brunel University and the Institute of Biology, SDU.
It should be mentioned that in order to enable direct comparison between the two sets of data, the raw data from Brunel have been re-calculated by entering them into the SDU-spreadsheet normally used to calculate the results in this project. The two sets of results are considered to be in acceptable agreement. 4.1.5 Comparison between control sample results from biological and chemical measurementsSince the control samples used for the quality control in both the biological assay and the chemical analysis are identical, data from the control charts can be used to compare the overall agreement between the two methods. When comparing results from the two methods a conversion of contents of individual estrogens to estrogenic activity in the biological assay is necessary. Therefore conversion factors were determined by biological measurement on the individual estrogens. The estrogenic activity is expressed as E2 equivalents and the conversion factors used are 0.29 (E1) and 0.88 (EE2) respectively. The nominal content of the control samples is 2.78 ng/l E2, 2.78 ng/l E1 and 2.65 ng/l EE2. Since estrogenic activities displayed by the individual estrogens in the assay are considered additive a calculated nominal estrogenic activity of 5.92 ng/l of the control samples is calculated. The calculated mean estrogenic activity of the control samples measured by YES assay was 6.8 ng/l. whereas the calculated mean content (expressed as E2 equivalents) from the chemical analysis was 5.2 ng/l. These results indicate that the ratio (biological/chemical) between measurements performed on identical samples is 1.3. From the control chart of the biological assay a RSD of 29 % is calculated. For the chemical results converted to E2-equivalents the RSD can be calculated from the individual RSD's from the control charts, and this results in a RSD of 39% for the chemical analysis. This means that measurements of ratios between biological and chemical results are accompanied by a combined RSD (((RSDbiol)²+(RSDchem)²)½ ) of 49 %. Consequently, a ratio of 1.3 with a RSD of 49% indicates that ratios (biological/chemical measurements) lower than approximately 2.6 are not statistically significant (given a 95% level).
|
|||||||||||||||||||||||||||||||||||||||||||||||||||||||||||||||||||||||||||||||||||||||||||||||||||||||||||||||||||||||||||||||||||||||||||||||||||||||||||||||||||||||||||||||||||||||||||