|
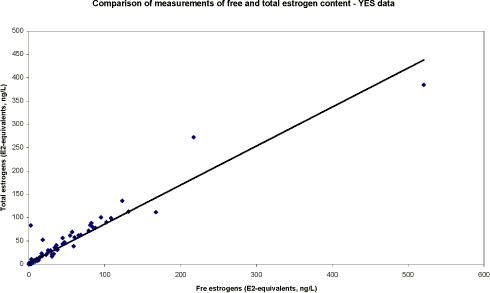
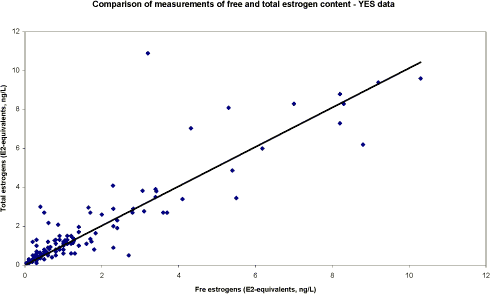
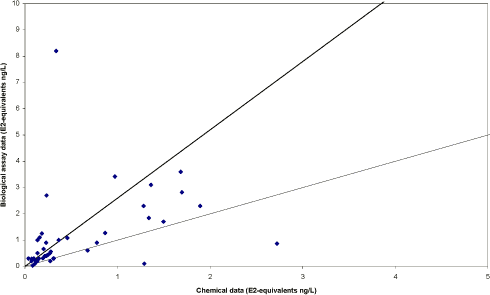
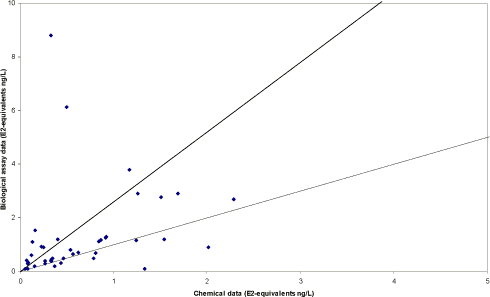
Survey of Estrogenic Activity in the Danish Aquatic Environment 5 Steroid estrogens versus estrogenic activity5.1 Free versus total estrogens 5.1 Free versus total estrogensIn order to assess the amount of conjugated estrogens in wastewater influent, wastewater effluent and surface water, plots of the results obtained by measuring the free estrogens versus the free and conjugated estrogens (total estrogens) are shown in Figure 5.1 and Figure 5.2. The full drawn lines indicate where measurements of total and free estrogens are equal. Generally, a good agreement among the measured amounts of free and total estrogens was observed. In most of the cases the concentrations measured as total estrogens was above the free estrogen concentrations. The few examples of the opposite occur at low concentrations and are attributed to the variability of the analytical methods used. Samples taken from the open land sources and the aquatic environment (G-R) rarely contain more than 10-20% conjugated estrogens, and in most environmental samples almost 100% of the total estrogenic activity can be attributed to free estrogens. Therefore the concern that a major part of the potential aquatic estrogenic activity occurs in a form that is mobilised during deconjugation is not supported with the present data. By far the highest activity of a water sample from the environment will be found in the free estrogenic fraction compared to the conjugated. The samples taken directly in the WWTP effluents are somewhat higher in the concentration of conjugates, and typically display a 20% contribution from the conjugated species when concentrations exceed 5 ng/L. Because of uncertainty of the measurements, it is not clear whether this trend is also observed at lower concentrations. All values are included in Figure 1 with an expansion of the 0-12 ng/L range in Figure 5.2. At unity the total activity is completely derived from free estrogens. The samples with conjugated species reveal themselves by occurring above the line of unity. In the lower range, i.e. without the WWTP samples, most samples occur close to unity, but a few of the very low (<0.5 ng/L) show high levels of conjugated species.
Figure 5.1 Comparison of total and free estrogens determined in YES assay.
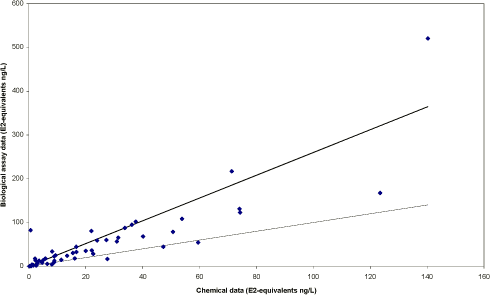
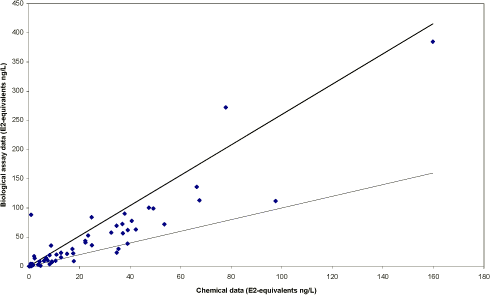
Figure 5.2 Expansion of the lower range 0-12 ng/L of the data set. 5.2 Biological assay versus chemical analysisIn the following figures and table, only paired YES and chemical analysis data are included in the presentation unless otherwise stated. First, the data set containing the samples of major direct sources of steroid estrogens is isolated. This is composed of the categories A-F comprising samples of waste water effluents shown for free estrogens in Figure 5.3 and for total estrogens in Figure 5.4. The area between the lines show the range in which biological and chemical measurements are considered statistically equal, given the uncertainties mentioned in section 4.3 of the main report.
Figure 5.3 Free estrogens. YES results vs. Chemical results converted to E2 equivalents for free estrogens in waste water samples (A-F categories). The lower Line show unity and the upper line show where the difference between measurements exceeds statistical uncertainty of 2.6.
Figure 5.4. Total estrogens. YES results vs. Chemical results converted to E2 equivalents for total estrogens in waste water samples (A-F). The lower Line show unity and the upper line show where the difference between measurements exceeds statistical uncertainty of 2.6. In the effluent samples from wastewater treatment plants several data sets show additional estrogenic activity in YES assay compared to the activity calculated from the measurement of three steroid estrogens. In the second grouping, the remaining data sets are lumped together (see Figure 5.5 and 5.6). This include samples from the main category of "Other sources" (G-K), those taken from recipients of waste water (L) and the diffusely exposed aquatic environments (M-R).
Figure 5.5 Free estrogens. YES results vs. Chemical results converted to E2 equivalents for total estrogens in surface water samples (G-R). The lower Line show unity and the upper line show where the difference between measurements exceed statistical uncertainty of 2.6.
Figure 5.6 Total estrogens. YES results vs. Chemical results converted to E2 equivalents for total estrogens in surface water samples (H-R). The lower Line show unity and the upper line show where the difference between measurements exceeds statistical uncertainty of 2.6. Thus, in samples from aquatic environments believed to be at risk of receiving estrogenic activity, up to 25 to 30 % of the samples appear to be affected by other components with estrogenic activity than the steroid estrogens measured here. In samples from anticipated "clean" environments less than a fifth of the samples may be affected. In this latter category many samples have less than 1 ng/L E2 activity and test uncertainties will increase as the detection limits are approached. The majority of results in the data presented above show that the biological assay shows a higher estrogenic activity than the chemical detection of four analytes and recalculation of E2 equivalent activity suggests, as shown in Table 5.1. Given the statistical uncertainty of the two methods, a ratio of 2.6 between YES and chemical data is suggested and below is shown a tabulation of the data set relative to this criterion (Table 5.1). These uncertainties include standard analytical issues such as dilution effects, determination of recoveries etc, but also possible matrix effects and synergism. In 104 samples that were analysed for total estrogens detections were made using both the chemical method and the YES-assay. As a measure of agreement among the two methods, we propose that the ratio between YES and chemistry data must be below 2.6 as a criterion determining whether the methods are concordant. This proposal is based on the uncertainty obtained for the control samples analysed in the project. Using this criterion, we see that 77% of all samples fulfil this criterion. We also see that this conclusion appear to be valid also if sewage influent/effluent or surface water samples are considered separately. Amongst the results with a positive detection in both YES assay and chemical analysis, 24 results exceeded a YES-to-chemical ratio of 2.6. These fall in three groups: 11 from A-F (out of 60 samples), 6 from G-K (out of 11 samples), 2 from L (out of 14) and 5 from surface water (out of 19 M-R samples). Table 5.1 Number of comparable samples, i.e. over detection limit in both tests, and Samples within uncertainty range. YES-to-Chemical ratio of 2.6 is significance criteria.
One important prerequisite for interpretation is that the data are corrected for known losses in analytical procedures by internal recovery standards, but the data set is uncorrected for recovery as measured against standards in quality control samples. This is a choice made to present the data as little manipulated as possible. 5.2.1 Samples with non-steroid estrogenic activityA consequence of the results presented in Table 8.1 is that in 24 samples a contribution from other chemical components must be considered. These samples typically come from the categories of waste water effluents. The number of samples which may be affected by non-steroid estrogens are approximately 20%. This is in agreement with the findings reported in Kjølholt 2003, showing that steroid estrogens accounted for 80-95% of the activity in treated waste water. This study did not include the simple WWTPs of categories C and D. In 32 cases (in addition to the 104 paired data set) the chemical analysis detects estrogens without a recording in the YES assay. The average value for calculated estrogen activity is 0.3 ng/L with a median of 0.1 ng/L. Five values exceed 0.5 ng/L ranging from 0.6 to 1.6 ng/L. 5.2.1.1 WWTPsOf the 11 samples from A-F categories where ratios exceed 2.6, four are from C and D categories. These two categories also have high concentrations of steroid estrogens and the data demonstrates that the efficiency in removing these substances and presumably also xenobiotics is much smaller than in A-B and E-F. Thus, there is a suggestion in the data for C and D that non-SE compounds contribute to the observed YES activity. 5.2.1.2 Open land sources and surface watersThe activities in samples from G-R exceeding a ratio of 2.6 may have several causes: Some are from L-samples taken down stream of A-F sites with high ratios and so this is hardly surprising. Two come from K-samples (fish farms) with a possible content of hormone disrupting agents from fodder. Three come from “background” sites, but with concentrations measured that are approaching the lower bound of the analysis dynamic range. Based on the available data it is therefore our preliminary conclusion that there is no indication of widespread occurrence of non-steroid estrogen related activity in the aquatic environments. In effluents from particular sources (in particular categories C, D and possibly K) the activity from steroid estrogens is rivalled by non-steroid estrogen compounds achieving perhaps similar or double the activity of the former.
|
