|
Update on Impact Categories, Normalisation and Weighting in LCA 4 Global warming
Leif Hoffmann, dk-TEKNIK ENERGY & ENVIRONMENT 4.1 SummaryThis chapter summarises the presently available data of 1994 on worldwide consumption/.emission of substances contribution to global warming. Global warming is a global effect. The substances or emissions included are:
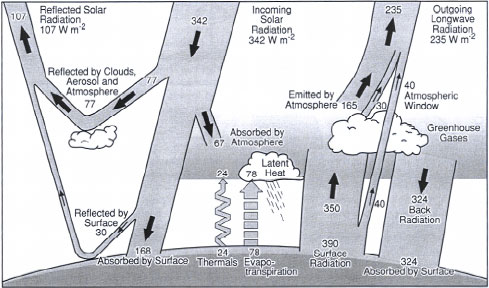
The CFCs, HCFCs, HFCs, tetrachloromethane, and 1,1,1-trichloromethane are also considered as ozone depleting substances and their contribution to the stratospheric ozone depletion is described in chapter 5, Stratopheric ozone depletion. Consumption data/emission data are generally available worldwide as the substances are regulated according to the Kyoto Protocol and the Montreal Protocol. The normalisation reference for global warming has been calculated to: 8.7 ton CO2-eq./capita/year Carbon dioxide (CO2) and methane (CH4) are accounting for more than 80% of the effect potential contributing to the normalisation reference for global warming. The normalisation reference is relatively certain as almost complete data are easy available due to the regulation of consumption/.emission according to the Kyoto Protocol and the Montreal Protocol. The ozone depleting substances are measured as consumption whereas the other greenhouse gasses are measured as emissions. 4.2 Description of the impact categoryGlobal warming is considered as a global effect. Global warming - or the "greenhouse effect" - is the effect of increasing temperature in the lower atmosphere. The lower atmosphere is normally heated by incoming radiation from the outer atmosphere (from the sun). A part of the radiation is normally reflected from the surface of the earth (land or oceans). The content of carbon dioxide (CO2) and other "greenhouse" gasses (e.g. methane (CH4), nitrogen dioxide (NO2), chlorofluorocarbons etc.) in the atmosphere reflect the infrared (IR)-radiation, resulting in the greenhouse effect i.e. an increase of temperature in the lower atmosphere to a level above normal. The energy balance is illustrated in Figure 4.1.
Figure 4.1 The possible consequences of the greenhouse effect include an increase of the temperature level leading to increased temparatures in the oceans and melting of the polar ice caps and glaciers in mountain areas, resulting in elevated sea levels. The increasing temperature level may also result in regional climate changes. See also Hauschild and Wenzel (1998) for further description of the impact category. 4.3 Substances contributing to the impact categoryThe substances contributing to global warming are defined as substances which at normal temperature and pressure are gases and:
The substances considered as primary contributors to global warming are:
For CO2 it is a special requirement that the emission must represent a net contribution, i.e. it must increase the content of CO2 in the atmosphere beyond that would be observed if the emission did not take place. Examples of this are burning of fossil fuels and changes in land use, e.g. as a cause of deforestation. Use of biomass (wood, straw, etc.) for energy production does not give a net contribution, because it can be assumed that the materials would degrade under all circumstances. The CFCs, HCFCs, HFCs, tetrachloromethane, and 1,1,1-trichloromethane are also considered as ozone depleting substances and their contribution to the stratospheric ozone depletion is described in chapter 5, Stratopheric ozone depletion. GWPs are normally based on modelling and are quantified for time horizons of 20, 100 or 500 years for a number of known greenhouse gasses (e.g. CO2, CH4, N2O, CFCs, HCFCs, HFCs and several halogenated hydrocarbons etc.). The modelling is done by a working group under the Intergovernmental Panel on Climate Change (IPCC) and is described in a number of reports from IPCC e.g. Houghton et al. (1996) and recently by Albritton and Meira Filho (2001). The emission of greenhouse gasses are regulated by the Kyoto Protocol (UN 1997) under the Climate Convention (UN 1992). The equivalency factors for the greenhouse gasses are expressed relatively to the effect of carbon dioxide i.e. as CO2-equivalents. The equivalency factors are compiled in Table 4-1. Please note that not all greenhouse gasses mentioned in Table 4-1 are included in the calculation of the normalisation reference due to lack of knowledge about the consumption or emissions; see Appendix B for details about the included substances. This may cause the normalisation reference to be underestimated by a few percent. Table 4-1
The potential global warming or greenhouse effect is normally quantified by using global warming potentials (GWP) for substances having the same effect as CO2 in reflection of heat radiation. The GWP for greenhouse gases is expressed as CO2-equivalents, i.e. the effects are expressed relatively to the effect of CO2. The potential greenhouse effect of a process can be estimated by calculating the product of the amount of emitted greenhouse gas per functional unit and the potential for greenhouse effect given in kg CO2-equivalents per kg for each gas. Finally, the contribution to the potential greenhouse effect from each gas has to be summarised:
where GWPi is the equivalency factor for the substance i mi is the emission of the substance i 4.4 MethodologyThe calculation of the normalisation reference for global warming has been carried out according to the methodology described in Hauschild and Wenzel (1998). The normalisation factor is calculated as:
where Normref GWP is the normalisation reference for the greenhouse effect mi is emitted quantity of substance i GWPi is the equivalence factor for the substance i N is the number of capita in the considered area Included in the normalisation reference are the following substances:
These substances are included due to ready availability of data on emission or consumption of these substances. 4.5 Normalisation referenceGlobal warming is a global impact and therefore only a global normalisation reference is relevant. For comparison the Danish emission/consumption of greenhouse gasses is presented in Appendix C to this chapter, showing that the consumption pattern has changed as the consumption of CFC is nearly phased out. This tendency has continued in the subsequent years. The data used in calculation of the normalisation reference for potential global warming is presented in Appendix B. The emissions of CO2 and CH4 are based on estimates made by the Oak Ridge National Laboratory in the U.S. Houghton & Hackler (2002), Marland, Boden & Andres (2002), Stern & Kaufman (1998), emissions of N2O and CO are estimated by RIVM/TNO in the Netherlands (Olivier et al. (2002), and consumption of CFCs, HCFCs, HFCs and halogenated carbons (CCl4 and CH3CCl3) are based on estimates made by the "Intergovernmental Panel on Climate Change" (IPCC) (Schimel et al. 1996). The information on consumption of halons is based on reports from countries that have ratified/accessed/accepted/approved the Montreal Protocol (UNEP 1987; 1999). The normalisation reference for global warming potential can be calculated to: 8.7 ton CO2-eq./capita/year The value is similar to that for 1990, i.e. app. 8.7 ton CO2-eq./capita/year. The total global warming potential has increased with about 5% (from 46.1*109 ton CO2-eq. in 1990 to 48.6*109 ton CO2-eq. in 1994 and the world population has increased from 5.3*109 in 1990 to 5.6*109 in 1994. CO2 and CH4 are the main contributors to the total global warming potential for both years, as they constitute approximately 80 % of the effect potential. N2O, CFC-12 and CO constitute 15% of the impact potential. The quality of the data varies from substance to substance. None of the emissions are measured in countries all over the world and often they are not measured in the same year or by the same method. The total emissions of energy related substances are based on emission factors for the relevant processes (e.g. energy production) and models developed by IPCC have been used for estimation of world emissions. Emissions of CFCs, HCFCs, HFCs, and halogenated carbons (CCl4 and CH3CCl3) are not measured regularly. The potential emissions are estimated by using the assumption that all the consumed amount of the actual substances will be emitted sooner or later due to their chemical stability. This methodology is problematic as the lifetime of the substances in the products is different depending on the purpose of the actual product (substances used as degreasing agents are supposed to be emitted immediately during the use phase and substances used as cooling agents are supposed to be emitted after the use phase i.e. when the goods are disposed off). However, the last assumption is only valid for some countries. Collection of goods containing cooling agents has been established in some countries (e.g. Denmark) in order to recycle the cooling agent or to ensure proper destruction of the cooling agent. 4.6 Recommendations for future updateThe future updating of the normalisation reference for global warming is recommended to be based on the same methodology and data sources as used in the present update. The statistical information used in this report is compiled by IPCC (greenhouse gasses) and for the greenhouse gasses with ozone depleting potential from the statistical information compiled by UNEP. All the data have to be reported regularly according to the Kyoto Protocol as well as the Montreal Protocol. 4.7 ReferencesAlbritton, D.L. and Meira Filho, L.G. (eds.): Climate Change 2001: The scientific basis. ISBN: 0521014956, Earthprint Ltd. U.K., 2001. Hansen, J.H. 1995, Ozonlagsnedbrydende stoffer og HFC - forbrug i 1994. Miljøprojekt nr. 302. København: Miljøstyrelsen. Hauschild, M. & Wenzel, H. 1998, Global warming as a criterion in the environmental assessment of products. In Hauschild M, Wenzel H (eds.). Environmental assessment of products. Volume 2: Scientific background. London: Chapman & Hall. Houghton, J.T., Meira Filho, L.G., Callander, B.A., Harris, N., Kattenberg, A. & Maskell, K. (eds.) Climate change 1995 - The science of climate change. Cambridge: Cambridge University Press. Houghton RA, Hackler JL (2002). Carbon flux to the atmosphere from land-use changes. In Trends: A compendium of data on global change. Carbon dioxide information analysis center, Oak Ridge National Laboratory, U.S. Department of Energy, Oak Ridge, Tennessee, USA. Marland G, Boden TA, Andres RJ (2002). Global, regional and national CO2 emissions. In Trends: A compendium of data on global change. Carbon dioxide information analysis center, Oak Ridge National Laboratory, U.S. Department of Energy, Oak Ridge, Tennessee, USA. Olivier JGJ, Berdowski JJM, Peters JAHW, Bakker J, Visschedijk AJH, Bloos JPJ. Applications of EDGAR. Including a description of EDGAR 3.2: reference database with trend data for 1970-1995. RIVM report 773301001 / NRP 410 200 051. Schimel, D., Alves, D., Enting, M., Heimann, M., Joos, F., Raynaud, D., Wigley, T., Prather, M., Derwent, R., Ehhalt, D., Fraser, P., Sanhueza, E., Zhou, X., Jonas, P., Charlson, R., Rodhe, H., Sadasivan, S., Shine, K.P., Fouquart, Y., Ramaswamy, V., Solomon, S., Srinivasan, J., Albritton, D., Isaksen, I., Lal, M. & Wuebbles, D. (eds.) 1996, Radiative forcing of climate change. Chapter 2 in Houghton, J.T., Meira Filho, L.G., Callander, B.A., Harris, N., Kattenberg, A. & Maskell, K. (eds.) Climate change 1995 - The science of climate change. Cambridge: Cambridge University Press. Stern DI, Kaufmann RK (1998). Annual estimations of global anthropogenic methane emissions. Trends Online: A compendium of data on global change. Carbon dioxide information analysis center, Oak Ridge National Laboratory, U.S. Department of Energy, Oak Ridge, Tennessee, USA. Trenberth, K.E., Houghton, J.T., Meira Filho, L.G. (1996). The climate system: an overview. Chapter 1 in Houghton, J.T., Meira Filho, L.G., Callander, B.A., Harris, N., Kattenberg, A. & Maskell, K. (eds.) Climate change 1995 - The science of climate change. Cambridge: Cambridge University Press. UN 1992, United Nations Framework Convention on Climate Change. May 1992. UN 1997, Kyoto Ptotocol to the United Nations Framework Convention on Climate Change. December 1997. UNEP 1987, The 1987 Montreal Protocol on Substances that Deplete the Ozone Layer as adjusted and amended by the second Meeting of the Parties (London, 27-29 June 1990) and by the fourth Meeting of the Parties (Copenhagen, 23-25 November 1992) and further adjusted by the seventh Meeting of the Parties (Vienna, 5-7 December 1995) and further adjusted and amended by the ninth Meeting of the Parties (Montreal, 15-17 September 1997). Available at: http://www.unep.org. UNEP 1998, Data report on production and consumption of ODSs - 1986 - 1996. United Nations Environment Programme, Ozone Secretariat. UNEP 1999, Status of Ratification/Accession/Acceptance/Approval of the agreements on the protection of the stratospheric ozone layer. The Vienna Convention for the Protection of the Ozone Layer (1985); The Montreal Protocol on Substances that Deplete the Ozone Layer (1987); The London Amendment to the Montreal Protocol (1990); The Copenhagen Amendment to the Montreal Protocol (1992); and the Montreal Amendment to the Montreal Protocol (1997). February 8 1999. UNEP: The Ozone Secretariat. (Available at: http://www.unep.ch) .Appendix A: Data sourcesDatabases (paper)
Organisations The following institutions are relevant in relation to obtaining data on the consumption/emission of greenhouse gasses:
Appendix B: Data used in the calculation of normalisation references for global warming.
1. Hauschild & Wenzel (1998). 2. Houghton & Hackler (2002) 3. Marland, Boden & Andres (2002) 4. Stern & Kaufman (1998) 5. Olivier et al (2002) 6. Schimel et al. (1996). See chapter 5 for description of the procedure used for estimation of emission/consumption of halon (sum). In the calculation of global warming potential the halons are assumed to be 100% halon 1301. Appendix C: Consumption/emission of greenhouse gassesConsumption of greenhouse gasses/ozone depleting substances and emission of greenhouse gasses in Denmark in 1994.
1 Hansen (1995). 2 Corinair 90 3 Ritter (1997).
|
|||||||||||||||||||||||||||||||||||||||||||||||||||||||||||||||||||||||||||||||||||||||||||||||||||||||||||||||||||||||||||||||||||||||||||||||||||||||||||||||||||||||||||||||||||||||||||||||||||||||||||||||||||||||||||||||||||||||||||||||||||||||||||||||||||||||||||||||||||||||||||||||||||||||||||||||||||||||||||||||||||||||||||||||||||||||||||||||||||||||||||||||||||||||||||||||||||||||||||||||||||||||||||||||||||||||||||||||||||||||||||||||||||||||||||||||||||||||||||||||||||||||||||||||||||||||||||||||||||||||||||||||||||||||||||||||||||||||||||||||||||||||||||||||||||||||||||||||||||||||||||||||||||||||||||||||||||||||||||||||||||||||||||||||||||||||||||||||||||||||||||||||||||||||||||||||||||||||||||||||||||||||||||||||||||||||||||||||||||||||||||||||||||||||||||||||||||||||||||||||||||||||||||||||||||||||||||||||||||||||||||||||||||||||||||||||||||||||||||||||||||||||||