|
Background for spatial differentiation in LCA impact assessment - The EDIP2003 methodology 9 Integration of external noise nuisance from road and rail transportation in lifecycle assessment9.1 Introduction Authors: Per H. Nielsen [79], Jens E. Laursen [80] 9.1 IntroductionNoise nuisance from transportation of goods is a well-known environmental impact, which has received a lot of attention in the literature (Vejdirektoratet, 1998) and in practical noise control projects (Vejdirektoratet, 1999). However, it is a general impression of noise reduction activities that the existing noise producing processes are taken for granted and/or that the products or services that are provided by the noise producing processes are taken for granted. The consequence is that following two means are primarily used in addressing the noise nuisance problem:
Only few activities attempt at modifying the products and services and hereby reducing or eliminating the noise generating processes. The purpose of this chapter is to analyse noise nuisance from a product-oriented point of view and to make some first attempts to integrate noise nuisance from transportation processes as an impact category in LCA. This will allow an integration of noise nuisance as an environmental consideration in product development and environmental comparison of products and services based on quantitative LCA, so that noise can be evaluated and accounted for at the same level as other environmental impact categories in the future. The focus of the present report is merely on noise that is annoying human beings during transportation of products. Nuisance, perceived by employees during the production process is not dealt with since this is an issue of working environment that is already addressed separately, see (Wenzel et al., 1997). The disturbance of sensitive areas by noise (e.g. nature parks and recreational areas) and the disturbance of animals are not addressed in this report. These aspects could, however, be addressed in future studies to provide a more complete representation of the noise problem associated with production of services and goods. As will become clear in the following, several simplifications with respect to e.g. noise distribution and quantification of the noise nuisance, are required to make generic noise models applicable for LCA. However, these simplifications are necessary and justified by the general need for a quantitative relation between the production of goods and generation of noise nuisance, otherwise the omission of noise nuisance data in LCA would be the only alternative. The degree of detail in modelling generic environmental impacts is always a compromise between making the model feasible and sufficiently precise, and the simplifications suggested in the following is not an exception. However, nothing prevents that more details are taken into account in the future or in specific cases where more accurate results are required. Readers who are not familiar with measurements and calculations of noise are encouraged to consult Annex 9.1 in order to ease the understanding of the following sections. 9.2 General approachThe noise nuisance NNd at a specific distance d from a point source can be quantified in terms of "person hour" by the following equation: NNd = Pd• Tproc •NNFLp (9.1) where Pd is the number of persons in the distance d from the source [dim. less] Tproc is the duration of the noisy process [h] and NNFLp is a noise nuisance factor specific for the actual noise level, Lp relative to the background noise level. [dim. less]. The number of people in the distance d from the noise source can be determined by counting or by average estimation. The duration of the noisy operation is the time that is used to produce one unit of the product or service according to the functional unit, and can also be determined by measurements or by average calculations. The noise nuisance factor NNFLp, represents the inconvenience caused by the noise to humans. The noise nuisance factor is a subjective parameter, which is determined by several aspects such as
Formula 9.2 shows the relation between the noise pressure and the nuisance factor as determined by interviews for traffic noise (see Anonymous, 1989) and Annex 9.1). NNFLp = 0.01 •4.22 0,1 (Lp - K) (9.2) Where Lp is the noise level and K is the background noise level in dB relative to 20 µPa. The exponent factor (Lp – K) expresses the part of the noise that exceeds the background noise.
Figure 9.1. Relation between noise pressure level, Lp [dB(A)] and nuisance factor NNF Lp for traffic noise, (Anonymous, 1989). Figure 9.1 illustrates the relation between outdoor noise and the nuisance factor graphically. The magnitude of the noise, Lp in various distances from the source can be determined either by measurements or by calculations.
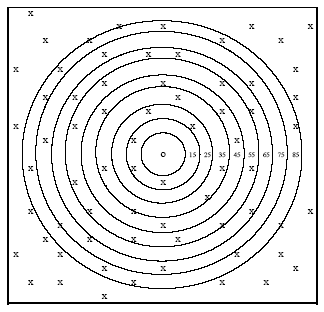
Figure 9.2. Distribution of population (x) within 10 meter wide circular rings (isobars) in different distances, d (0 - 85 m) around a point noise source (o). Figure 9.2 illustrates the noise isobars around a point noise source as well as the number of people in each isobar. The noise level is high close to the source and decreases with increasing distance from the source due to attenuation caused by divergence of the sound waves and by absorption. The reduction of the noise is determined by several factors, such as
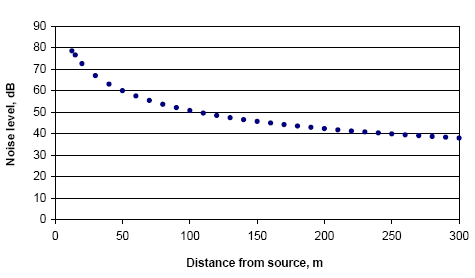
Circular noise isobars as shown in Figure 9.2 appear only in open, flat landscapes when the atmosphere is still and homogenous. Thus, in most situations, the isobars are non-circular as they are shaped according to the actual conditions. As a simplified average consideration, however, the noise isobars are assumed in this model to be circular, and the noise level in various distances from the point source can be calculated according to the mathematics in Annex 9.1. As an example, the noise levels in various distances from the source are shown in Figure 9.3. The strength of the noise source and other input parameters for the calculations are listed in Table 9.1.
Figure 9.3. Example of calculated noise levels in various distances from the source. Table 9.1. Input parameters for calculation of noise levels in Figure 9.3.
Figure 9.3 shows that the noise level is quite high close to the source but decreases significantly within the first 100 m. At the distance of 300 m from the source the noise level is 38 dB(A) (near to the background noise level of the area). The number of people annoyed by the noise from a specific source may vary as people move between the noise isobars as well as in and out of the area influenced by the noise (see Figure 9.2). However, average considerations taking the general population density ( pop) into account provide a useful estimate of the number of people, Pn in each isobar around a noise source and are used in the present model. Hence the number of people in the n'th isobar is
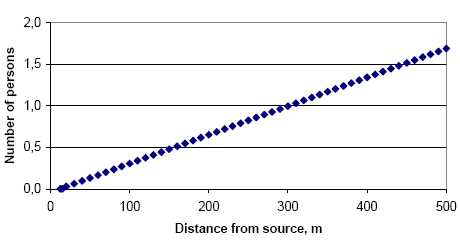
Assuming as an example that the population density is 55 people pr. km2 around a noise source with no one situated closer to the source than 13 m, Figure 9.4 shows the average number of people within 10 meter circular rings (isobars) at various distances from the noise source.
Figure 9.4. Example of average number of people in 10 meter wide circular rings at various distances from a noise source. ( pop = 55 pr. km-2) The total noise nuisance caused by a specific process NNproc can be determined by summarising the nuisance on all persons within each isobar sector as shown in Formula 9.4.
Where Lp(d) is the noise level at the distance d from the noise source. The total noise nuisance NNprod from a product or a service can be determined by adding all nuisance contributions from all processes in the entire lifecycle of the products or the services.
Although some people located in the area influenced by the noise are actually situated in buildings, it is assumed in the present model that all noise perceived by humans is perceived outside. Thus, the noise level in various distances from the source is calculated as "outdoor-levels" and the noise nuisance is presented as a "noise nuisance impact potential" (NNIP). 9.3 TransportationTransportation by truck and train are generally quite noisy and the noise nuisance from these processes must be quantified. However, two aspects of the transportation processes complicate the quantification of the noise nuisance.
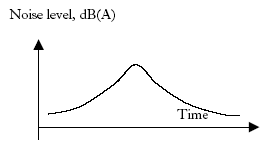
9.3.1 General approach to noise from transportationBecause the noise source is moving during the transportation process, the number of people who are hearing the noise changes continuously and the noise level experienced by individual persons changes as shown in Figure 9.5.
Figure 9.5. The noise level experienced by a person who is passed by the transportation unit. A person's experience of the noise level is low when the transportation unit is far from the perceiving person and increases up to a maximum when the person is passed. After that the noise level decreases to the level of the background noise as the transportation unit moves out of hearing. In the present model it is assumed that
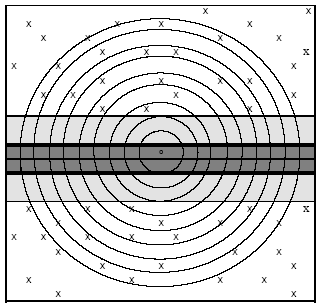
Based on these assumptions, the noise nuisance impact potential from a moving transportation unit can be determined by Formula (9.4) as if the noise source was standing still. Figure 9.6 shows the noise isobars around a moving truck on the motorway. The figure illustrate that even though the truck is moving, the same average number of people are influenced by the same amount of noise as long as the landscape, the population density and the noise remain the same.
Figure 9.6. Example of noise isobars around a truck (o) on the motorway (dark grey). Light grey colour illustrates the road border, (x) represents the population density and rings represent noise isobars. Since the noise nuisance impact potential may vary significantly during a transportation process from A to B it can be useful to compose a transportation scenario with different transportation types, different population densities and different acoustic conditions as illustrated in Table 9.2. Table 9.2. Examples of transportation types during transportation from A to B by a truck.
Table 9.2 suggests that the transportation type can vary significantly even during a simple transportation with the same transportation unit and that the most important transportation types must be included to give a true impression of the noise nuisance impact potential. However, the degree of detail must always be determined according to the scope definition of the actual LCA. 9.3.2 Truck transportationThe noise emitted from trucks depends on the size of the truck, the transportation speed, the road surface and the general condition of vehicle. The noise-LCA model is implemented in a spreadsheet model (LCA-noise.xls) which as input parameters takes three different truck weight categories, five different types of residential areas and three different road types. The model can be downloaded from the homepage of the Danish EPA (www.mst.dk). Different noise propagation set-ups are used for calculations of noise levels in each type of area. Each set-up contains typical average parameters like minimum distances to the nearest houses, distances between houses and height of houses. The traffic noise propagation model then calculates the shielding effect and the damping due to terrain hardness in various distances from the road. Table 9.3 provides three examples of the input parameters from the transportation of 5 kg product in three different types of trucks each one driving on different types of road through different types of areas. Table 9.3. Examples of input parameters for model calculation of noise nuisance from three different trucks carrying cargo through different areas. Parameters marked with * are default in the model.
1) See (Vejdirektoratet, 1996). 2) See Annex 9.2. 3) See (Vejdirektoratet, 1998), 4) See Anonymous, 1989, Lydteknisk Institut, 1984 and sheet about background noise. Output from the noise model will be presented and discussed in Section 9.3.4. 9.3.3 Railway transportationThe sound emission from train transportation comes partly from the interaction between rail and wheels and partly from the locomotive. At high speed (>80 km/h) the noise from the rail and wheels contribute mostly to the noise emission while at low speed (<30 km/h) the noise from the locomotive is dominant. Table 9.4 shows the input parameters for noise nuisance calculations in the model at the transportation speed of 100 respectively 60 km/h. Table 9.4. Example from a case where a train passes through different landscapes. Parameters marked with * are default in the model.
1) Nielsen, 1999. 2) See Annex 9.2. 3) See Anonymous, 1989, Lydteknisk Institut, 1984 and sheet about background noise. 9.3.4 Output from spreadsheet modelThe output generated by the LCA-noise spreadsheet model is the noise nuisance impact potential, NNIP caused by the transportation of the product. Table 5 shows the result from the above-mentioned cases given the input parameters from table 3. The greatest contribution comes from the van driving on highway through countryside where the background noise level is low. Although the large truck is the noisiest and although it passes through the most densely populated area its contribution to the noise annoyance is small. This is partly due to the shielding effect of the houses close to the road and partly because of the higher background noise in inner city areas and the greater load capacity of the truck. Table 9.5. Example of outputs generated by LCA-noise model. Input parameters to the model are listed in Table 3.
The noise nuisance factor (NNFLp) in formula (1) is a unit less parameter, and hence the noise nuisance impact potential calculated in the model comes out in the unit "person seconds", which can be interpreted as a "number of persons annoyed by the noise in a certain time". It may surprise that the calculated noise annoyance is relatively small for all the three types of road transportation. Hence, it should be noted that the calculated noise nuisance impact potential (NNIP) is only calculated for transportation of 5 kg cargo. The noise nuisance impact potential for the whole transportation unit is 300 times higher for the small van (3 t) and 2000 times higher for the big van (20 t) with the actual payload of 50%. 9.4 DiscussionThe present report presents a method to calculate noise nuisance from transportation of cargo by road and railway. With a number of modifications the same principles can be used for noise nuisance calculations for other noise sources such as industry, cargo loading, construction work and transportation with ship or aeroplane. The sound propagation model for road traffic noise is in this paper applied on train noise as well. At low speed the sound propagation does not differ significantly from that of a moving truck but at higher speed this method needs to be modified with respect to calculation of noise propagation zones and data for the noise emission relative to the train length. In the present model, daytime levels of background noise are used as standard parameters when calculating the noise nuisance. Thus, if a certain transportation process actually takes place in the night-time, the actual noise nuisance is slightly higher than calculated in the standard mode of the model. However, it is possible in the present model to enter another background noise level and the calculations can thus be adapted to the actual time of the transportation. Since much transportation of goods actually takes place during the night time (especially in the countryside), it would be desirable if standard night transportation scenarios would be addressed in future studies. 9.5 References:Anonymous: Noise considerations in construction of new roads (in Danish) Vejregel 2.30.02, June 1989. DS/ISO: Acoustics - Description and measurement of environmental noise - Part 1: Basic quantities and procedures. DS/ISO 1996/1. March 1983. Lydteknisk Institut: Acoustic warning (in Danish). Report no. 116, 1984. Miljøstyrelsen: External noise from companies (in Danish). Miljøstyrelsens vejledning nr. 5/1984. Miljøstyrelsen: Calculation of external noise from companies (in Danish). Miljøstyrelsens vejledning nr. 5/1993. Nielsen, J.S.: Correspondence with John Skafte Nielsen, DSB. 07. Sept.1999. Nordic Council of Ministers: Road Traffic Noise – Nordic Prediction Method. TemaNord 1996. Vejdirektoratet : Routes to less noise (in Danish). Report no. 80, 1999. Vejdirektoratet: Road traffic and noise – basic concepts (in Danish) Report no. 146, 1998. Vejdirektoratet: Velocity report – velocities on the main roads 1992-1994 (in Danish). Report no. 49, 1996. Wenzel, H., Hauschild M.Z. and Alting, L.: Environmental assessment of products. Vol. 1 - Methodology, tools, techniques and case studies, 544 pp. Chapman & Hall, United Kingdom, ISBN 0 412 80800 5, Kluwer Academic Publishers, Hingham, MA. USA., 1997. Annex 9.1 Assessment and regulation of noiseSound pressure. The central parameter to measure sound is the sound pressure p (in Pascal) at a given point. The sound pressure can vary in time, in strength and in frequency composition. It is measured with a microphone and a sound level meter. For this purpose several measuring methods and -equipment can be used. The sound pressure level is defined as Lp = 20log (p/p0) where p0 is a reference sound pressure 20 µPa, which is the smallest detectable sound pressure for humans. The unit is deciBel or dB relative to the reference p0. When measuring noise a spectral filter - an A-weighting filter - is commonly used. A-weighting. The A-filtering assures that only the sound level frequencies where the human hearing is good is dealt with in the evaluation of the measurement. The shape of the filter is similar to the inverse of the human hearing threshold. Thus noise signals having the same A-weighted sound pressure level will also have approximately the same subjective hearing level - irrespective on their frequency composition. If the assessment of noise nuisance to animals should ever come in question, another frequency filter shape should be used since animals hearing threshold can look very much different from ours. Sound power level is a source specific acoustic parameter, which is commonly used as an objective way of describing noise sources since it is independent of time and place. The reference quantity is 1 picoWatt or 1 pW (10-12 W). Sound power level is derived from sound pressure level as LW = Lp + 10log (S) where Lp is the sound pressure level at a measurement surface surrounding the source and S is the surface area in m2. The sound power level is measured in dB relative to 1 pW. Example: A point sound source is emitting sound equally in all directions and is placed freely on the ground. The wave front surface is then a hemisphere in which the sound pressure is the same everywhere along the surface. The sound power for the source is then calculated as
The corresponding A-weighted levels are called LWA and LpA. Also see Miljøstyrelsen, (1993) and DS/ISO (1983). Predicting sound pressure level from several sound sources. When predicting sound from one or more sound sources - each with a given sound power Lw - in a noise sensitive spot e.g. at the neighbour of a industrial plant, the sound reduction (due to distance, shielding from buildings etc.) from each source is calculated to this receiving point (see Miljøstyrelsen, 1984). Each noise source contributes to the total sound pressure level with L p = L W - 10•log (S) - F, where 10•log (S) is the divergence correction factor and F is a factor depending on the obstacles on the sound's path to the receiving point. S is the surface area of hemisphere with a radius equal to the distance from each source centre to the receiving point. The total sound pressure level at the receiving point is finally calculated by logarithmically adding each contribution from n sources:
Mapping of traffic noise. Normally the method for calculating noise from road traffic is to regard the traffic noise as coming from an indefinitely long straight line, a so-called line source. The sound emission from a line source consists of a mean average of sound from several sources passing a given point over a time period. However when dealing with noise from one single source emitting to a whole area, we have to use a very different approach since
In order to consider the impact of the single moving vehicle on the environment we have introduced a method based upon a co-ordinate system that follows the moving vehicle. The vehicle is then assumed to be a point source in the centre of this co-ordinate system emitting spherical sound waves in all directions. For simplicity the co-ordinate system is considered to pass through different types of uniform landscapes with uniform distribution of inhabitants. The sound propagation is thereby the same within each type of landscape. The sound field from the vehicle is regarded as that of a point source. Area of influence. Point source. The influence area from a point source is a circle with a radius of d, which is the distance from the road centre of the vehicle to the furthest sound zone.4 The number of influenced people depends upon the population density in the areas that the vehicle passes through. These areas are chosen so that the population density and the shape of the landscape are reasonably constant within the area. For a point source the number of people in the n'th noise zone within an area is
where d i is the distance from the road centre to the n'th noise zone and σpopulation is the population density of the area (P of peoples per km2). The influence area is local in the sense that it is restricted to the point source circular surroundings. It does not cover the whole geographical area of the route of the vehicle. The total area of influence is then found by time weighing and adding the number of noise influenced persons for each type of area according to the duration of the vehicle passing through an area. Line source. The sound field along a road, where many vehicles pass, has the shape of a cylinder. The influence area from line sources is a rectangular area covering both sides of the road, i.e. 2 d multiplied with the transport distance, where d is the distance from the road centre line to the furthest sound zone. For 1 km of road in a population area the number of influenced people is
The total area of influence for the whole route is found by weighing and adding the number of noise influenced peoples for each type of population area according to the length of the area. Hence
where P j is the number of influenced people in the j'th area and D j is the length of the corresponding area. Sound propagation model. In this paper the sound propagation model "Road Traffic Noise - Nordic Prediction Method" (Nordic Council of Ministers, 1996) is used for calculating the equivalent sound pressure level LAeq in various distances form the road centre line. In (Nordic Council of Ministers, 1996) the road traffic is considered to be an infinitely long, straight-line source emitting constant noise in cylindrical sound waves. The passages of individual vehicles are not dealt with directly in (Nordic Council of Ministers, 1996). The formulas for maximum sound pressure level is comparable to the sound propagation from a point source and is in this paper used to describe noise from the passing a single vehicle. The validity of the method is restricted to distances up to 300 meter. LAeq is calculated from the following input parameters:
Noise nuisance. People living in the above described noise influenced areas do not all experience the same amount of noise since the sound pressure decreases with the distance from the road, shielding objects, height above terrain etc. Secondly the human ear does not perceive noise levels linearly in frequency but "A-filtered" and thirdly the nuisance experienced from a given noise level does not depend linearly of the level of the noise (Anonymous, 1989). A common used method of calculating noise annoyance in areas near to road (or railway) traffic lines is to estimate the number of inhabitants in a certain area and calculating how many of these that is exposed to certain noise levels. In Denmark the concept SBT (noise load figure, which in this paper is referred to as noise nuisance, NN) is widely used in traffic planning. SBT incorporates noise nuisance i.e. the fact that noise in different distances from the road causes different levels of nuisance for the people living close to and further away from the road. SBT contains an empirically found nuisance factor that weighs the calculated noise level according to the human hearing perception. The noise nuisance factor is
where LAeq, i is the A-weighted, energy equivalent sound pressure level in decibel (dB) in the i' th noise zone. K is 41 dB for outdoor noise in all-year residential areas. For summerhouses K = 36 dB because of the lower background noise in summerhouse areas. K = 16 dB for indoor noise. The noise nuisance factor is dimensionless. It is valid down to LAeq = 45 dB. Normally SBT is based upon 24-hour energy mean level of traffic noise but since we consider noise impact from single vehicles we will in this paper consider the nuisance factor to be applicable when using maximum sound pressure level of a single vehicle passing. The sound pressure LAF,max, 10m 10 meters from the road centre line is therefore used as a basic input parameter. The total noise nuisance caused by the road traffic in a certain area is calculated by multiplying the noise nuisance factor with the number of people in each noise zone and summarising all the noise zones
where P i is the number of people living in the i' th noise zone. The lower limit for summarisation of noise zones is set to 45 dB. Finally the noise nuisance for the whole route is found by summarising NN for all the different areas that the vehicle passes through. Hence
Annex 9.2 Estimation of average population densities in three different area categories in Denmark
Reference: Danmarks Statistik, kommuner i tal (http://www.dst.dk/siab.asp?o_id=11). Approximate average population density, pers./km2
Footnotes [79] Institute of Product Development (IPU) in Denmark [80] dk-TEKNIK, ENERGY & ENVIRONMENT
|
![Figure 9.1. Relation between noise pressure level, Lp [dB(A)] and nuisance factor NNF Lp for traffic noise, (Anonymous, 1989)](images/280.gif)
