|
| Front page | | Contents | | Previous | | Next |
The indoor and outdoor concentrations of particulate air-pollution and PAHs in different size fractions and assessment of exposure and health impacts in the Copenhagen population
Appendix B
Description of collection methods and filter weighing procedure
PM measurements
PM1, PM2.5, PMinh and PAH's were collected on GFC glass fibre filters (Millipore AP 4003705) using stationary mounted personal samplers. PM1 and PM2.5 were collected using Triplex SCC 1.062
cyclones (BGI Inc.). Inhalable dust (PMinh) was collected using CIS's (Conical Inhalable Samplers). Figure B.1 show the performance of the Triplex cyclones at the three cut-points possible. Figure B.2
shows the convention for inhalable dust sampling. The inhalable dust fraction is defined as the "mass fraction of total airborne particulates, which may be inhaled through the nose and mouth". The inhalable
fraction is defined as:
EI = 50(1+exp[-0.06Da];
Where EI is the percentage of airborne particles and Da is the aerodynamic particle size in m. A study of the performance of the CIS sampler has shown that the collection efficiency of the CIS may deviate
from the sampling convention for particles coarser than ~ 10 m at wind velocities above 0.5 m/sec. Hence, the outdoor PMinh mass concentration in this study should be considered minimum values.
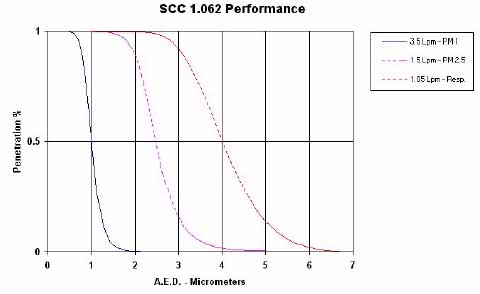
Figure B.1: Performance of the Triplex SCC 1.062 sampler set for collection of PM1, PM2.5 and respirable dust (www.bgiusa.com/ihi/triplex.htm)
The appropriate flows (1.5 L/min for PM1; 3.5 L/min for PM2.5 and PMinh) were achieved using single (1.5 L/min) or parallel-coupled (3.5 L/min) Dupont pumps. The only exception was the outdoor
measurement of inhalable dust at NIOH, where the CIS was connected to an AirCon2 High Volume Air Sampler (Struers, DK). The flow at the sampler inlets was checked at the beginning and at the end of
the sampling periods with random checks during the experiments. The volume of sampled air was calculated based on these measurements.
The PM samplers used for outdoor sampling were mounted next to each other appr. 10-15 cm apart at the top of a white plastic bucket turned upside-down to protect the samplers from direct sunlight and
rain. At Jagtvej, tubes were led through drilled and sealed holes in a wooden plate replacing one of the window sections in the living room window to the pumps, which were placed in the kitchen as
described in section 2.2.1.
Figure B.2: Convention for the collection efficiency (EI) in sampling inhalable dust (PMinh). The CIS sampler comply with this CEN 1993 standard.
Filter cleaning and weighing procedure
Prior to weighing and sampling, the glass fibre filters were cleaned in an EMITECH K1050X plasma asher (Emitech Ltd. Kent, U.K.) operated at 85 W using 15 mL O2 per minute for 15 minutes at an
air-pressure of 6 10-1 mbar. This was completed to prevent potential contamination of PAH's on the filters for the subsequent HPLC analysis.
Filters were weighed using a Sartorius Micro Scale (Sartorius AG, Göttingen, Germany) after 24 hours of equilibration in a climate controlled weighing room (20°C; 50% RH). Each filter series included
three blind filters used as internal controls for passive mass changes and chemical analysis of sorbed volatiles. A 20 mg standard was used to establish accuracy and the weighing uncertainty (±0,003 mg)
based on 10 measurements before each weighing. Weight-loss during mounting and dismounting of glass fiber filters were corrected using empirical correction factors according to the type of sampler used
(see below). After weighing, the filters were stored in a freezer (–20°C) placed in individual glass petri dishes and wrapped in aluminum foil until extraction for chemical analysis of organic compounds.
Figure B.3: Probability plot based on least squares estimates (LSXY) for mass-loss (in mg) from glasfiber filters during mounting and demounting in Millipore cassettes. AD*: Result from Anderson-Darling
normality test.
Mass-Loss Correction for Mass Concentration Measurements
Glass filters may be slightly damaged during mounting and dismounting in the filter cassettes. This is particularly true for glass fibre filters. Figure B.3 shows a probability plot for the mass-loss mounting and
demounting glass fibre filters in Millipore Cassettes. The average mass-loss was 48.019±28.42 g and there is less than 5% risk of a mass-loss larger than 90 μg at a 95% confidence interval. A similar test was
conducted for mounting and demounting glass-fibre filters in the CIS cassettes (Fig. B.4). The average mass-loss using CIS cassettes was 30.90±16.85 μg and there is less than 5% risk of a mass-loss larger
than 55 g at a 95% confidence interval. The measured particle concentrations were corrected by the appropriate average mass-loss values depending on sampling devise. The standard deviation of the
mass-loss data were included in the uncertainty for each mass concentration measurement according to the error propagation method: ΔF = √(Σxn2) for n = 1 – n.
Figure B.4: Probability plot based on least squares estimates (LSXY) for mass-loss (in mg) from glasfiber filters during mounting and demounting in CIS cassettes. AD*: Result from Anderson-Darling
normality test.
| Front page | | Contents | | Previous | | Next | | Top |
Version 1.0 May 2005, © Danish Environmental Protection Agency
|