|
| Front page | | Contents | | Previous | | Next |
The indoor and outdoor concentrations of particulate air-pollution and PAHs in different size fractions and assessment of exposure and health impacts in the Copenhagen population
Appendix D
Analysis of PAHs
Solvents and standards
Solvents
Acetonitrile and methanol was from Merck (pro analysi, >99.5%) and water from a Milli-Q water purification system (Millipore Waters). Acetone was from Rathburn (HPLC grade) or Merck (pro
analysis).
Standards
The PAH standard solution was from Supelco (610 Polynuclear Aromatic Hydrocabons Mix (610 PAH Mix)) and contained 16 PAHs naphthalene, acenaphthylene, acenaphthene, fluorene, phenanthrene,
anthracene, fluoranthene, pyrene, benzo[a]anthracene, chrysene, benzo[b]fluoranthene, benzo[k]fluoranthene, benz[a]pyrene, dibenzo[a,h]anthrancene, benzo[ghi]perylene, and indeno[1,2,3-cd]pyrene.
Certified Standard Reference Materials (SRMs) were from NIST (National Institute of Standards and Technology) and was Standard Reference Material 1647d, (in acetonitrile) and Standard Reference
Material 1649a, Urban Dust.
Preparation of bias control samples
For routinely evaluation of the bias of the HPLC analysis a batch of control samples were prepared from the SRM 1647d containing certified concentrations of the 16 PAHs. The PAH mixture was diluted
with acetonitrile to obtain the concentrations within the method range, transferred to micro vials containing ca. 200 μl and stored in a freezer until analysis. The resulting peak area count and the concentrations
of the selected compounds were plotted in an X-R control chart using the AMIQAS PC-Program .
Preparation of instrument control samples and calibration solutions
Retention time and stability of the response from the system and the detectors were monitored with instrument control samples produced by diluting 610 PAH Mix 125 times in acetonitrile. The resulting
peak area counts were plotted in an X-R chart. The standard solutions for the calibration curves (six points) were also made from 610 PAH Mix by different dilutions in actonitrile. The instrument controls
and the calibration solutions, respectively, were transferred to clean micro vials and stored in a freezer.
Samples for recovery experiments
Different studies were made to determine the recovery of the PLE extraction followed by HPLC or GC-MS analysis. All the recovery samples were prepared by loading filters or Tenax TA into clean PLE
extraction cells as described below. The samples were then spiked with 0.5 mL to 1 mL of a diluted 610 PAH Mix with a volumetric pipette or SRM 1649a dust weighed onto the filters in the cell.
Afterwards the cells were closed and extracted. A potion of the extracts was concentrated to ca. 400 μl by gentle evaporation in a stream of charcoal filtered N2. The concentrated and non-concentrated
extracts were stored in a refrigerator until analysis.
Sample preparation
Glass fibre filter cleaning
The glass fibre filters were cleaned in an EMITECH K1050X plasma asher (Emitech Ltd. Kent, U.K.) operated at 85 W using 15 mL O2 per minute for 15 minutes at an air-pressure of 6 10-1 mbar.
Tenax Ta tube cleaning
The sample tubes contained 40 mg 35-60 mesh Tenax TA (Chrompack) and the backup tubes 20 mg Tenax TA that was kept in place by small steel grids. The tubes were cleaned in a stream of ca. 60 ml
nitrogen per min at 275 °C for at least 2 h. The tubes were checked for contaminations by thermal desorption and GC with FID detection (TD-GC-FID).
Glassware cleaning
Glassware was washed by the normal procedure in the central dishwasher and afterwards cleaned by Oxygen Plasma Ashing for 60 minutes at 100 W and stored in cleaned aluminium-foil (rinsed with
acetone). After use, the glassware was placed in a saturated solution of KMnO4 overnight and afterwards placed in a saturated oxalic acid solution for a minimum of 4 hours. Subsequently the glassware
was rinsed in water and returned to central dishwasher. Before use, disposable glassware (micro vials) was cleaned by Oxygen Plasma Ashing for 60 minutes at 100 W and stored in cleaned aluminium-foil.
PLE cell cleaning
The PLE extraction cells were cleaned by sonication of the body and end caps in acetone for at least 5 minutes. Then the cells were assembled and filter papers (supplied by Dionex) were placed in the
bottom to prevent clogging of the metal frit. Ottawa sand (Fisher S23-3) was filled into the cells to reduce the amount of solvent. Subsequently a second filter was placed on the top of the sand before the
cells were closed. The cells, filters and sand were cleaned by a treatment identical to the one used for the samples by running the PLE extraction method.
Pressurized Liquid Extraction (PLE) of filters and Tenax TA
PLE extractions were carried out using an automated ASE 200 Accelerated Solvent Extractor (ASE) (Dionex, Sunnyvale, CA, USA) equipped with 1-mL or 5-mL stainless steel extraction cells as
previously described for phthalates in house dust . After cleaning of the extraction cells the top filter and the Ottawa sand was removed. Then the samples (glass fibre filter or Tenax TA) were carefully
loaded into the cells and the Ottawa sand and the top filter replaced. The glass fibre filters and the Tenax TA samples were treated in similar ways. The glass fibre filter samples were placed in 5-mL cells and
the Tenax TA samples were placed in 1-mL cells to avoid a large extraction volume. The filter samples were extracted two times consecutively and the Tenax TA samples extracted once. The extraction
procedure started with a 7-min thermal equilibration time during which the cells were heated to 150°C, filled with acetonitrile and pressurized to 2000 psi. The extraction was continued under static
conditions for 10 min. After the static extraction the samples were flushed with ca. 2.8 ml fresh acetonitrile. Finally, the cells were purged with gaseous nitrogen for 60 s at 150 psi.
After the extraction the samples were stored in brown vials protected from light, and refrigerated prior to the solvent volume reduction of only the filter samples. The filter samples were concentrated from ca.
5 mL to ca. 0.3 mL by evaporation in a gentle stream of nitrogen. The Tenax TA extracts were not concentrated in order to avoid evaporation losses of low boiling PAHs . The exact amount of the
extraction solvent was found by weighing of the vials before and after the concentration by evaporation. All the extracts were transferred to micro vials containing ca. 200 μl and stored in freezer until analysis
by HPLC. Beside the filter and Tenax TA blanks, also PLE system blanks were extracted. The PLE system blanks were cells only filled with Ottawa sand and filter papers.
High Performance Liquid Chromatography (HPLC) analysis of extracts
The PAHs were separated by reversed-phase HPLC using the following equipment : Pumps model 625 LC systems, a Waters 717 autosampler, a model 600E system controller and a SAT/IN data module
(all from Waters Associates Inc., Milford U.S.A). The column (250x 4.6 mm inner diameter) was a Supelcosil LC-PAH column (5μm packing) protected with a Waters Guard column Bondapak
C18/Corasil (37-50μm) and a pre-column Lichrocart 4-4, Lichrospher 100 RP-18, 5μm. Two different detectors were used: a Waters model 996 Photodiode Array Detector (DAD) (254nm); and a
Perkin-Elmer fluorescence detector model LS-5 (FD) (Perkin-Elmer Corp.,Noewalk, U.S.A.). The mobile phase was acetonitrile-water (40:60) held for 5 min, then increasing linearly to 90% acetoniltril
during 20 min, and held for 15 min. The flow rate was 1.0 ml/min and the injection volume was 25 μl. All injections and runs were performed at room temperature (20-22°C). The DAD was used for
quantification of acenaphtylene, fluoranthene and indeno[1,2,3-cd]pyrene and the FD for quantification of the other 13 PAHs using multiple wavelength shifts (see Appendix C).
Analysis sequence
The construction of the sequence was as follows: 6 calibrations standards, 4-6 bias control samples, 1 instrument control, 10-25 samples including blanks (filters/Tenax Ta tubes) and system blanks. Only
one injection per sample was used.
Calibration
Six points calibration curves were made for each analysis series. No calibration curves had intercepts significant different from zero and r² was between 0.9 and 0.999.
Blanks
From every one-week fieLD sampling 2-3 blank filters and one Tenax Ta blank was included. The blank samples had generally a low content of PAHs (see Appendix E). In most of the filter blanks no peaks
or only small peaks (under the detection limits) could be detected. In few cases larger amounts on filters was measured. This may be attributed to contaminations from handling or insufficient cleaning. Also
the Tenax TA blank tubes had generally low content of PAHs, but for acenapthylene 6 out of 14 blank tubes had amounts at or above the limit of detection. The explanation is probably interference in the
non-specific PDA detector, see more details in the section "Data treatment".
Gas chromatography combined with mass spectrometry (GC-MS)
GC-MS (Perkin Elmer Autosystem XL / TurboMass) was used for the recovery study and for verification of some of the HPLC result. The GC-MS had a constant flow of He (carrier gas) of
about 1 ml min-1 and was equipped with 30-m x 0.25 mm-i.d. Chrompack CP Sil 8 CB Low Bleed/MS (0.25 μm film thickness) column. The temperature program was 60 °C, held for 2 min, increased to
320 °C at 10 °C min-1 and held for 2 min. The splitless injector temperature was 250 °C (standard liner). The MS transfer line was 275 °C. The mass spectrometer was operated in the electron impact
ionization mode (EI+, 70 eV) with a source temperature of 175 °C using full scan mode (m/z 50 – 300) and single ion monitoring (SIM). No internal standards were used and the molecular ions were used
for SIM and quantification (see Appendix C).
Validation of the method
Recovery
The PLE extraction recovery of PAHs from filters and Tenax TA was studied. The samples was prepared and analysed with GC-MS or HPLC as described above. For the filters spiked with the SRM
1649a dust 10 out of 13 PAHs had recoveries better than 80%±20% (see Figure D 1). Fluorenthene had a mean recovery at 142%±23%, but two out of the six samples gave recoveries within 100±10%.
Benzo[a]pyrene and dibenzo[a,h]anthracene had a large variation with mean recoveries lower than 70%. However, for both compounds the confidence limits included 100% recovery.
For the Tenax TA tubes spiked with 610 PAH Mix and no concentration of the extracts, 11 out of 16 compounds had recoveries better than 75±25% (see Figure D 2). The other 5 PAHs were mostly high
boiling compounds and had recoveries better than 60%. For the Tenax TA tubes spiked with 610 PAH Mix and evaporation of the extracts to nearly dryness, the lowest boiling compounds from naphthalen
to pyrene had recoveries lower than 50%.
Limit of detection (LD)
The LD of HPLC-DAD/FD was estimated as three times the standard deviation of 18 low standards. The LDs varied between 0.002 to 0.028 ng/μl depending on the PAH (see Table B1).
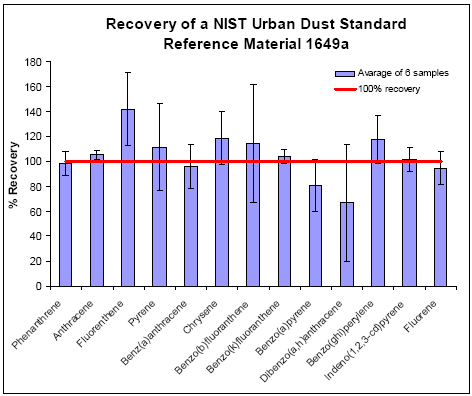
Figure D 1: Recovery of PAHs from the filters
Table D 1: Validation and quality assurance parameters.
| PAH |
Limit of detektion (LD) |
Break through |
Filter blanks |
Tenax TA blanks |
Accuracy |
| |
ng/μl |
% |
SD |
% n.d. |
% below or equally LD |
% above LD |
% n.d. |
% below or equally LD |
% above LD |
% |
| Naph |
0,018 |
15 |
18 |
36 |
19 |
44 |
75 |
8 |
17 |
3,0 |
| Acy |
0,028 |
n.a. |
|
72 |
14 |
14 |
33 |
50 |
17 |
7,2 |
| Ace |
0,013 |
7 |
20 |
61 |
33 |
6 |
92 |
8 |
0 |
2,2 |
| Flr |
0,003 |
11 |
26 |
72 |
28 |
0 |
75 |
17 |
8 |
3,9 |
| Phe |
0,005 |
14 |
26 |
39 |
58 |
3 |
92 |
8 |
0 |
5,3 |
| Ant |
0,002 |
1 |
8 |
67 |
19 |
14 |
92 |
8 |
0 |
9,6 |
| Flt |
0,004 |
6 |
18 |
72 |
0 |
28 |
92 |
0 |
8 |
8,3 |
| Pyr |
0,003 |
2 |
10 |
28 |
47 |
25 |
75 |
25 |
0 |
5,1 |
| B(a)A |
0,003 |
n.a. |
|
69 |
25 |
6 |
92 |
8 |
0 |
1,6 |
| Chry |
0,002 |
n.a. |
|
50 |
25 |
42 |
75 |
17 |
8 |
1,2 |
| B(b)F |
0,009 |
n.a. |
|
28 |
53 |
19 |
83 |
17 |
0 |
1,1 |
| B(k)F |
0,002 |
n.a. |
|
36 |
33 |
31 |
75 |
25 |
0 |
1,1 |
| B(a)P |
0,005 |
n.a. |
|
44 |
50 |
6 |
75 |
25 |
0 |
5,6 |
| DiB(a,h)A |
0,005 |
n.a. |
|
33 |
47 |
19 |
50 |
33 |
17 |
14 |
| B(ghi)Pe |
0,003 |
n.a. |
|
33 |
42 |
33 |
50 |
33 |
17 |
0,1 |
| I(1,2,3-cd)P |
0,004 |
n.a. |
|
100 |
0 |
0 |
0 |
100 |
0 |
7,5 |
n.a..= not available
Accuracy = the difference between the "true" and the measured PAH concentration divided with the "true" PAH value in the standard reference solution based on SRM 1647d.
Evaluation of breakthrough
The breakthrough for the PM2.5 Tenax TA tubes shown in Table B1 was calculated as the PAH amount on the backup tube divided by the amount on the sample tube and the backup tube in total. Break
through could not be calculated for high boiling PAHs due to interference. However, the breakthrough is probably insignificant (see discussion in section 4.1.1).
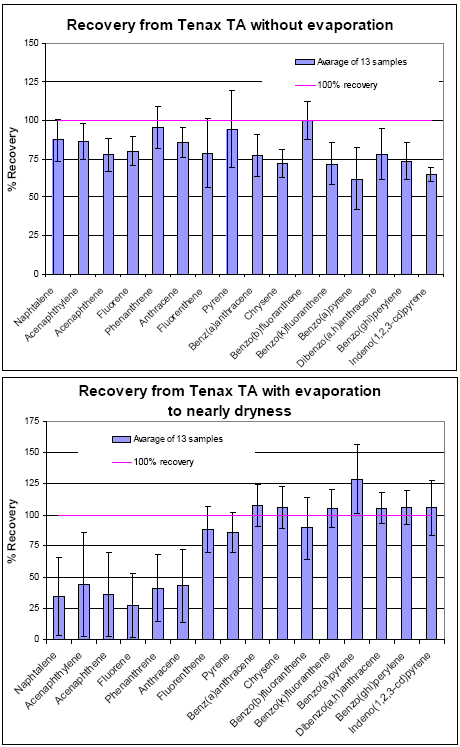
Figure D 2: Recovery af PAHs from the Tenax TA with and without concentration of the extract by evaporation
Evaluation of the blanks
The filter and Tenax TA blanks were evaluated as the fractions of all blanks that were n.d., below or equal to LD, and above LD (see Table B1).
Evaluation of the accuracy
The accuracy of the analysis was estimated from analysis of the bias control samples (se Table B1).
Quality assurance (QA)
X-R Control charts were established and were the basic tools to test the statistical control of the analytical method. They were used to document that the random and the systematic errors of the method
stayed within acceptable limits during the period of the analyses. These limits were estimated from the standard deviation x numbers of analysis of the control samples. The control charts were generated with
the statistical QA program AMIQAS .
To follow the stability of the response. five X-R control charts were set up. The peak area counts from the instrument control samples in each run were plotted in the charts. For the DAD detector the area
counts of acenaptylene and fluorenthene were plotted and for the FD detector the area counts of napthalene. pyrene and phenanthrene were plotted.
To evaluate the precision and statistical control of the analysis method. X-R control charts for five PAHs were established. In each sequence 4-6 bias control samples were run and from the peak area
counts the concentrations of the samples were calculated using the calibration data. X-R charts were made for the DAD and the FD detector for the following PAHs: naphthalene. acenaptylene.
phenanthrene. fluoranthene. and pyrene.
The results of the control samples were > 3 standard deviations (STDs) from the mean values in the following cases:
Area counts control charts (instrument control samples)
| detector |
Acenaptylene |
Fluorenthene |
Pyrene |
comments |
| PDA |
040204
040301
|
030507
040204
040301
|
|
|
| LS-5 |
|
|
030527
040204*
|
*New lamp (respond high) |
The response of the detectors will decrease with the age of the lamps. The start and the end of a lamps lifetime will often provoke a rejection.
Concentration control charts (bias control samples)
| detector |
Naphthalene |
Fluorenthene |
Phenanthrene |
comments |
| PDA |
|
040109
040204
|
|
|
| LS-5 |
030829**
040109
|
|
031030
040128
|
**Repair of autosampler |
When a control sample > 3 STDs from the mean value it indicates that the run was not in statistical control at the shown dates. The samples analysed in the sequence with the rejected control component.
was not automatically rejected since ca. 0.5% of the bias controls will statistically be out of range. A summery of all the controls and all the control component analysed on the same day indicates whether the
analyses was out of statistical control or not. In these cases it was found that the analysis method was in statistical control.
Data treatment
A spreadsheet (Excel) was used for most data treatment, calculation and plots. For some statistical tests and plots MiniTab was used. In the raw data table (Appendix E) concentrations within the calibration
limits are in normal font, concentrations below the instrumental LD are reported in italics, and when no HPLC peak in the chromatogram was found the results are reported as n.d. (not detected). In the
calculations all data (including data below LD) was used except data reported as n.d. that was treated as missing values (empty section/cell). Acenaphtylene concentrations measured by the non-specific
DAD detector were very high in all Tenax samples compared to the other PAHs. Therefore all the Tenax TA samples were analysed (semi quantitative) with GC/MS to check the acnaphtylene response. It
appeared that there was an interfering compound in the HPLC system, since acenaphtylene could not be detected with GC-MS. The lowest amounts that could be detected on the GC-MS were ca. 0.3
ng/0.5μl. Because of the much higher detection level on the GC-MS, quantification on Tenax tubes could not be performed. If an acenaptylene peak for Tenax TA extracts was reported by HPLC-DAD but
not by GC-MS, it was set equal to the detection limit of HPLC method and used as such in the calculations. When no acenaphtylene peak in the HPLC chromatogram of Tenax TA extracts was found the
results are reported as n.d. The filter concentrations of acenaphtylene were treated as the other PAHs.
| Front page | | Contents | | Previous | | Next | | Top |
Version 1.0 May 2005, © Danish Environmental Protection Agency
|