Denmark's Fourth National Communication on Climate Change
3. Greenhouse gas inventory information
- 3.1 Greenhouse gas inventories
- 3.2 Denmark's emissions and removals of greenhouse gases
- 3.3 Denmark's, Greenland's and the Faroe Islands' total emissions and removals of greenhouse gases
- 3.4 Supplemental information under the Kyoto Protocol
3.1 GREENHOUSE GAS INVENTORIES
Denmark's greenhouse gas inventories are prepared in accordance with the guidelines from the Intergovernmental Panel on Climate Change (IPCC) and are based on the methods developed under the European CORINAIR programme.1
The Danish emission inventories follow the method described in CORINAIR's guidelines2 and IPCC's guidelines3. In accordance with the latter guidelines, some of the default methods and emission factors have been modified so that they reflect better Danish conditions.
A description of methods, emission factors and activity data is given in Denmark's national emission inventory reports (NIR)4 to the Climate Convention, which also include data in the common reporting format (CRF). The latest NIR and the latest combined Danish inventory of greenhouse gases and other air pollutants can be seen at the National Environmental Research Institute's website5 and in Illerup et al, 2005.
Greenhouse gas inventories for Greenland and the Faroe Islands are included in the national emissions inventory reports to the Climate Convention.
3.2 DENMARK'S EMISSIONS AND REMOVALS OF GREENHOUSE GASES
Denmark's emission of the greenhouse gases CO2 (carbon dioxide), CH4 (methane), N2O (nitrous oxide), and the so-called potent greenhouse gases (F gasses), which include HFCs (hydrofluorocarbons), PFCs (perfluorocarbons), and SF6 (sulphurhexafluoride) during the period 1990-2003 are shown in Figures 3.1-3.4 aggregated into the IPCC's 6 main sectors and the most relevant sub-sectors. Denmark's total greenhouse gas emissions measured in CO2 equivalents on the basis of the potential of each gas for global warming is shown together with the distribution with respect to gas and source/sector in Table 3.1 and Figures 3.5 and 3.6 respectively. The development in 1990-2003 broken down by sources from Table 10 of the CRF are shown in Annex A.
3.2.1 Carbon dioxide, CO2
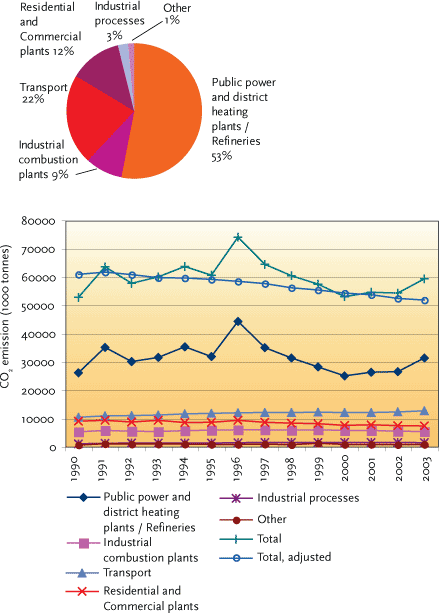
Almost all CO2 emissions come from combustion of coal, oil and natural gas at power stations and in residential properties and industry, although road transport also contributes a considerable proportion.
The relatively large fluctuations in the emissions from year to year are due to trade in electricity with other countries - primarily the Nordic countries. The large emissions in 1991, 1994, 1996, and 2003 are due to large electricity exports.
From 1990 to 1996, emissions showed a rising trend, but they have fallen since 1997 because many power stations have changed their fuel mix from coal to natural gas and renewable energy. As a result of the reduced use of coal in recent years, most of the CO2 emissions now come from combustion of oil.
Emissions from road transport in 2003 accounted for approx. 22% of the total CO2 emissions.
In 2003, total actual CO2 emissions inventoried under the Climate Convention, excluding land-use change and forestry (LUCF), were 12% higher than in 1990. If LUCF is included, net emissions were 10% higher. Corrected for exchange of electricity with other countries and annual temperature variations, CO2 emissions dropped 13% with and 15% without LUCF during the same period.
FIGURE 3.1: CO2 EMISSIONS BY SECTOR ANS DEVELOPMENT IN 1990-2003
Source: The National Environmental Research Institute (NERI)
3.2.2 Methane, CH4
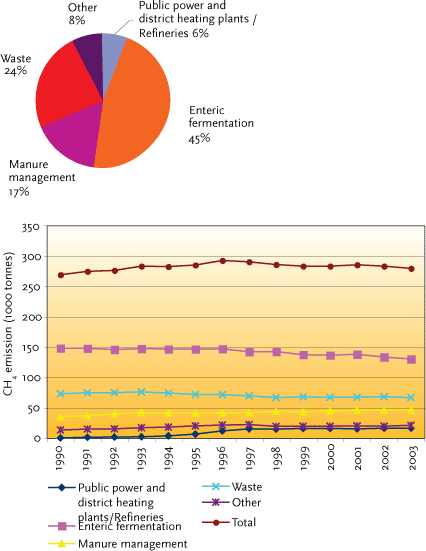
Anthropogenic methane (CH4) emissions primarily stem from agriculture, landfills, and the energy sector, among which agriculture contributes the most by far.
The emissions from agriculture are due to the formation of methane in the digestive system of farm animals (enteric fermentation) and manure management.
Emissions of methane from landfills are decreasing, because the production of methane has fallen year by year since the abrupt fall in landfilling in 1997.
Emissions of methane from the energy sector have been increasing due to an increased use of gas-driven engines, which emit large amounts of methane compared to other combustion technologies. However, all other things remaining equal, these emissions are expected to be reduced by 5% from 2006, when new emission limits for existing gas-driven engines come into force pursuant to Statutory Order No. 720 of 5 October 1998 on the limitation of emissions of nitrogen oxides, unburned carbon hydrides and carbon monoxide from gas motors and gas turbines.
In 2003, total methane emissions were 3% above the 1990 level.
3.2.3 Nitrous oxide, N2O
Agriculture constitutes the largest source by far of nitrous oxide (N2O) emissions, since N2O can be formed in the ground, where bacteria convert nitrous compounds from fertilizer and manure. Bacterial conversion of nitrogen also occurs in drain water and coastal water. This nitrogen largely comes from agriculture's use of fertiliser, and emissions from these sources are therefore included under agriculture. From 1990, N2O emissions from agriculture had dropped 30%6 due to the reduced use of commercial fertilizers and more efficient use of manure. From 1990, N2O emissions from agriculture had dropped 30%f due to the reduced use of commercial fertilizers and more efficient use of manure. A small share of the nitrous oxide emissions originates from power and district heating plants, and cars with catalytic converters.
FIGURE 3.2 CH4 EMISSIONS BY SECTOR AND DEVELOPMENT IN 1990-2003
Source: The National Environmental Research Institute (NERI)
In 2003, total nitrous oxide emissions were 25% below the 1990 level.
FIGURE 3.3 NO2 EMISSIONS BY SECTOR AND DEVELOPMENT IN 1990-2003
Source: The National Environmental Research Institute (NERI)
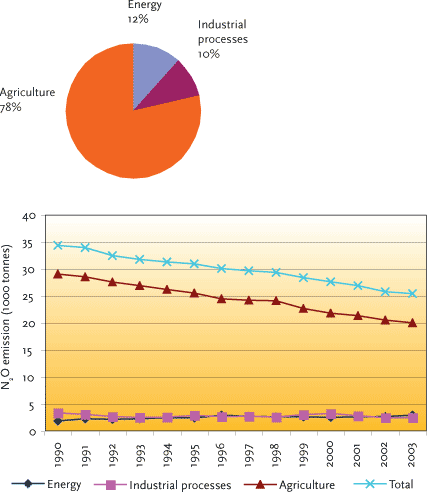
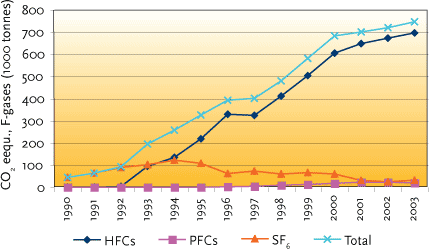
FIGURE 3.4 DEVELOPMENT IN HFC, PFC, AND SF6 EMISSIONS IN 1990-2003
Source: The National Environmental Research Institute (NERI)
3.2.4 The potent greenhouse gases HFCs, PFCs, and SF6
The contribution of the potent greenhouse gases, also known as F-gases (HFCs, PFCs and SF6), to Denmark's total emissions of greenhouse gases is relatively modest. However, the emissions of these gases rose strongly during the 1990s. Collection of data on the consumption of these substances started in the mid 1990s. Therefore, F-gas data and emissions inventories from before 1995 are somewhat less certain than in 1995 and later. In accordance with the Kyoto Protocol, Denmark has selected 1995 as the base year for the F-gases.
The HFCs, which are primarily used in the refrigeration industry, are the biggest contributor to F-gas emissions. From 1995 to 2003 annual HFC emissions increased from 218,000 to 695,000 tonnes CO2 equivalents. PFC emissions rose in the same period from 1,000 to 19,000 tonnes CO2 equivalents, however with a slight fall in 2003 compared to 2002. SF6 emissions dropped by 71% from 107,000 to 31,000 tonnes of CO2 equivalents in the period.
Total F-gas emissions rose by 129% from 1995 to 2003.
TABLE 3.1 DANISH GREENHOUSE GAS EMISSIONS AND REMOVALS BY GAS AND SOURCE AND SINK CATEGORIES IN 1990-2003
Source: The National Environmental Research Institute (NERI)
3.2.5 Denmark's total emissions and removals of greenhouse gases
Table 3.1, figures 3.5 and 3.6 show the development in Denmark's greenhouse gas emissions and removals as CO2 equivalents and by gases and sources according to the guidelines on reporting of summary information under the Climate Convention. CO2 is the most important greenhouse gas followed by N2O and CH4. From 1996, when total emissions (excl. LUCF) corresponded to 90 mill. tonnes of CO2 equivalents, there has been a general reduction until 2000, when total emissions corresponded to 68.3 mill. tonnes of CO2 equivalents, whereas total greenhouse gas emissions corresponded to 74 mill. tonnes of CO2 equivalents (excl. LUCF) in 2003. The increase of 7.3% from 2002 to 2003 is due to large exports of electricity to other Scandinavian countries in 2003. Of the total greenhouse gas emissions in 2003, CO2 made up 80%, methane 8%, nitrous oxide 11%, and F-gasses 1%. If net contributions of CO2 emissions by sources and removals by sinks from forests and soil are included (i.e. with LUCF), then net total Danish greenhouse gas emissions corresponded to 72.8 mill. tonnes of CO2 equivalents in 2003.
As will be shown in section 3.4, this inventory according to regulations under the Kyoto Protocol implies certain changes with regard to base year and emissions by sources and removals by sinks in the land use and forestry sector (LUCF).
3.2.6 Danish emissions of indirect greenhouse gases and SO2
NOX
The three largest sources of emissions of nitrogen oxide (NOx) are transport, power and district heating plants and other mobile sources such as fishing vessels and agricultural vehicles. In 2003, the transport sector contributed 37% of total Danish NOx emissions, which had fallen from approximately 300,000 tonnes in the mid 1980s to 200,000 tonnes in 2003 – a fall of 32%. The increased use of low-NOx burners and de-NOx units at power and district heating plants have reduced emissions from these plants. In addition, the increased number of cars fitted with catalytic converters has contributed to the trend in reductions.
CO
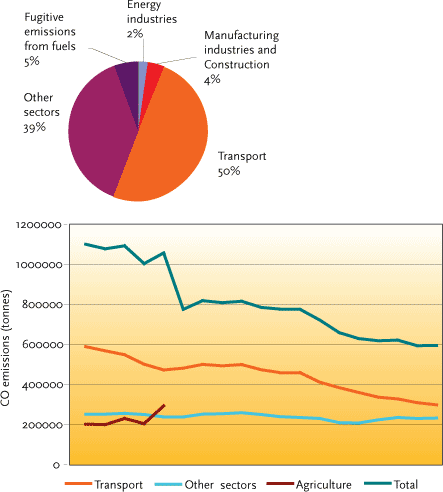
Road transport still accounts for the largest part of CO emissions despite a fall in CO emissions from this source due to the introduction of catalytic converters for vehicles in 1990. In addition, other mobile sources and combustion of wood by households are significant sources. Emissions of CO were reduced by 35% from 1990 to 2003.
NMVOC
The most significant emission sources of NMVOC are use of solvents, road traffic and other mobile sources. Total anthropogenic emissions of NMVOC were reduced by 39% from 1985 to 2003 – especially due to the increased number of cars fitted with catalytic converters and reduced emissions in connection with use of organic solvents.
SO2
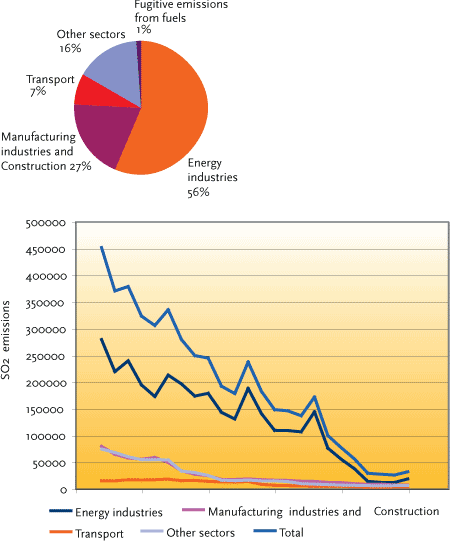
The greater part of all SO2 emissions comes from combustion of coal and oil at power and district heating plants. Emissions of SO2 have undergone a remarkable development - from 1980 to 2003 total emissions fell by 93%. The reason for this is primarily the installation of desulphurisation units at the large power plants as well as the use of fuels with low sulphur content for power stations, industry and the transport sector. From 2002 to 2003 there was however an increase of 23% because of large exports of electricity to Sweden and Norway. The extra electricity was primarily produced at the large coal-fired power plants.
FIGURE 3.5 DANISH GREENHOUSE GAS EMISSIONS BY TYPE OF GAS IN 1990-2003.
Source: The National Environmental Research Institute (NERI)
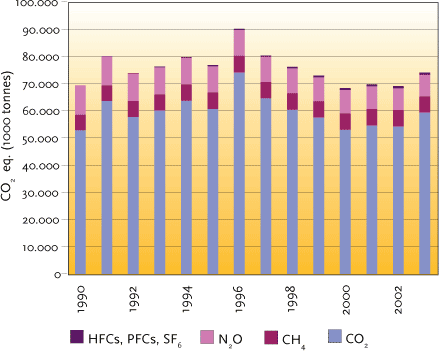
FIGURE 3.6 DANISH GREENHOUSE GAS EMISSIONS BY SOURCE/SECTOR IN 1990-2003
Source: The National Environmental Research Institute (NERI)
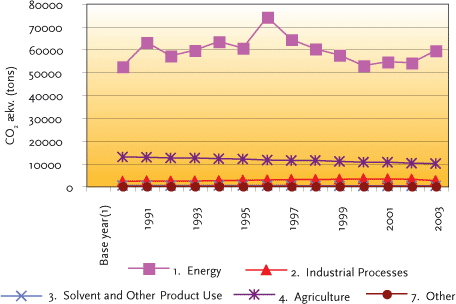
FIGURE 3.7: NOX EMISSIONS BY SECTOR AND DEVELOPMENT IN 1985-2003
Source: The National Environmental Research Institute (NERI)
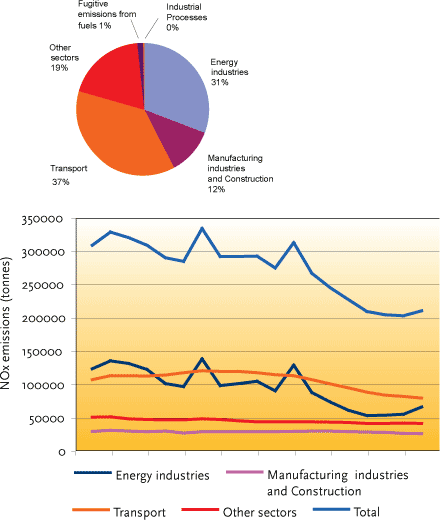
FIGURE 3.8: CO2 EMISSIONS BY SECTOR AND DEVELOPMENT IN 1985-2003
Source: The National Environmental Research Institute (NERI)
3.3 DENMARK'S, GREENLAND'S AND THE FAROE ISLANDS' TOTAL EMISSIONS AND REMOVALS OF GREENHOUSE GASES
The total inventories for Denmark, Greenland and the Faroe Islands (the Realm) are given in Table 3.2, and emissions from Greenland and the Faroe Islands are indicated under the box ”Other”. As will be seen, the Climate Convention's goal of reducing the level to the 1990 level by 2000 was reached in the inventory without CO2 from land-use changes and forestry (LUCF) with a 1.4% decrease in emissions. Including CO2 from LUCF the combined level for Denmark, Greenland and the Faroe Islands in 2000 was 0.9% above the level in 1990, because windfall in Danish forests in December 1999 resulted in increased CO2 emissions in the year of forest statistics 2000.For the time being, the inventories from Greenland contain only inventories of the CO2 emissions from combustion of fossil fuels. However, this is regarded as by far the main source of greenhouse gases.
FIGURE 3.9: NMVOC EMISSIONS BY SECTOR AND DEVELOPMENT IN 1985-2003
Source: The National Environmental Research Institute (NERI)
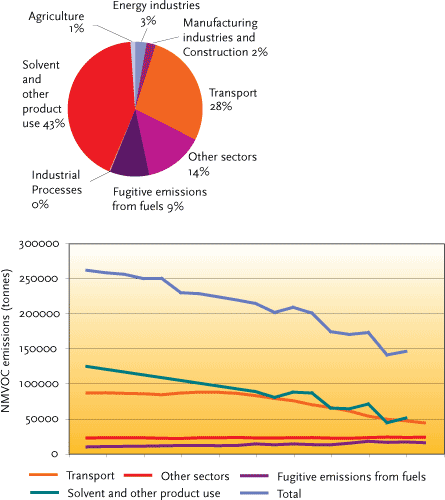
FIGURE 3.10: SO2 EMISSIONS BY SECTOR AND DEVELOPMENT IN 1980-2003
Source: The National Environmental Research Institute (NERI)
The inventories from the Faroe Islands contain not only the CO2 emissions from fossil fuel but also the methane and nitrous oxide emissions from agriculture.
TABLE 3.2 DENMARK'S, GREENLAND'S AND THE FAROE ISLANDS' TOTAL EMISSIONS AND REMOVALS OF GREENHOUSE GASES, 1990-2003
Source: The National Environmental Research Institute (NERI).
As will be seen from Table 3.2, Greenland's and the Faroe Islands' greenhouse gas emissions are small compared with those of Denmark (each about 1% of the total emissions), and they have been almost constant since 1990.
3.4 SUPPLEMENTAL INFORMATION UNDER THE KYOTO PROTOCOL
3.4.1 National systems for greenhouse gas inventories pursuant to Article 5, Section 1 of the Protocol
Objectives
In pursuance of Article 5, Section 1 of the Kyoto Protocol, the Parties to the Protocol shall establish national systems for the estimation of greenhouse gas emissions. The objective of establishing the national systems is to ensure good quality inventories. This is achieved by following the IPCC Guidelines for planning, implementation and execution of the activities connected with the work on the greenhouse gas inventories. The national system must also ensure that the inventories are transparent, consistent, comparable, complete and accurate.
Organisation of work etc.
The Danish National Environmental Research Institute (NERI) is responsible for producing the Danish greenhouse gas emission inventories and the annual reporting to the UNFCCC. NERI is therefore the contact point for Denmark's national system for greenhouse gas inventories under the Kyoto Protocol. Furthermore NERI participates in work under the auspices of the UNFCCC, where guidelines for reporting are discussed and decided upon, as well as participating in the EU monitoring mechanism for inventories of greenhouse gases, where guidelines for reporting to the EU are regulated.
The work on the annual inventories is carried out in cooperation with other Danish ministries, research institutes, organisations and private enterprises. The most important partners for this work are shown in the following text box.
These partners provide a range of data that are needed to produce the inventory. NERI is therefore in the process of drawing up formal agreements that will ensure that NERI receives the necessary data on time.
Calculation methods
The Danish emissions inventory is based on the IPCC guidelines for calculation of greenhouse gas emissions (the Revised 1996 Intergovernmental Panel on Climate Change (IPCC) Guidelines for National Greenhouse Gas Inventories (Houghton et al., 1997) and the Good Practice Guidance and Uncertainty Management in National Greenhouse Gas Inventories (Penman et al., 2000)) and the European CORINAIR (COoRdination of INformation on AIR emissions) program for calculation of national emissions. Generally, emissions are calculated by multiplying the activity data (e.g. fuel consumption, number of animals or vehicles) by an emission factor (e.g. the mass of material emitted per unit of energy, per animal or per vehicle). Activity data are mainly based on official statistics. The emission factors are either national values or values recommended in the IPCC guidelines.
The Danish Energy Authority, the Danish Ministry of Transport and Energy:
Annual energy statistics that are compatible with the format used for emission inventories and fuel consumption data for large incineration plants.
The Danish Environmental Protection Agency, the Danish Ministry of the Environment:
Database on waste volumes and emissions for potent greenhouse gases (F gasses).
Statistics Denmark, the Danish Ministry of Economic and Business Affairs:
Statistical yearbook, sales statistics for industry, and agricultural statistics.
The Danish Institute of Agricultural Sciences, the Danish Ministry of Food, Agriculture and Fisheries:
Data on use of fertilizer, fodder, and nitrogen emissions from livestock.
The Danish Road Directorate, the Danish Ministry of Transport and Energy:
Number of vehicles grouped by categories corresponding to the EU classifications, kilometres travelled and speeds shown by town, main roads and motorways.
Forest and Landscape Denmark, the Royal Veterinary and Agricultural University, the Danish Ministry of Food, Agriculture and Fisheries:
Background data for forests and removals of CO2 by forests.
The Civil Aviation Administration, the Danish Ministry of Transport and Energy:
Aircraft data (aircraft types and flight routes) for all flight departures and arrivals in Danish airports.
DSB, the Danish Ministry of Transport and Energy:
Fuel related emission factors for diesel locomotives.
Danish enterprises:
Environmental accounts and other information.
Important sources
Choice of calculation method for the individual sources depends among other things on how significant the source is. The sources that together accounted for 95% of greenhouse gas emissions in 2003 or accounted for 95% of the change in emission levels from 1990 to the most recently calculated year (2003) are defined as significant sources according to the IPCC guidelines. An analysis of the Danish sources shows that 21 sources account for 95% of total greenhouse gas emissions and that the three largest sources – that together account for 62% – are CO2 from the combustion of coal at stationary incineration plants, CO2 from road transport and CO2 from combustion of natural gas at stationary incineration plants.
Procedure for recalculation
At the same time as the annual calculation of emissions for a new year takes place, any necessary recalculations of emission inventories from previous years are also carried out. Recalculations are made if errors or oversights are found or if better knowledge becomes available. If better knowledge becomes available, statistical data, improvements of method, activity data or emission factors are updated according to new knowledge and research. In order to ensure consistent emission inventories, recalculations will be carried out on the whole time series, as much as circumstances permit.
Uncertainty
Uncertainty in the greenhouse gas inventories is calculated as recommended in the IPCC guidelines and covers 93% of total Danish greenhouse gas (GHG) emissions. The result of the calculations shows that total GHG emissions were calculated to have an uncertainty of 46% and the increase in GHG emissions since 1990 was calculated to be 4.8% ± 19%. Uncertainty is greatest for N2O emissions from agricultural land, whilst the uncertainty for CO2 emissions from stationary incineration plants is only 8% and the uncertainty for the development is 1.8%.
Quality assurance and quality control
As part of the national system, NERI is drawing up a manual to use in quality assurance and quality control of the emission inventories. The manual contains precise and detailed guidelines on how to assure and control quality of the inventories. The quality plan described in the manual is based on the IPCC guidelines and ISO 9000, 9001, 9004 and 10005 standards. The objective of the quality planning is to ensure the quality of the inventories in a manner that optimises resources. The quality control includes routine checks of data correctness and completeness as well as ensuring that any possible errors and deficiencies are identified and corrected. All calculation methods are documented and all material concerning data, methods and recalculations is archived.
Reports are written for all sources of emissions that describe in detail and document the data and calculation methods used. These reports are evaluated by persons external to NERI who are experts in the area in question, but not directly involved in the inventory work. In addition, a project has been started in which the Danish calculation methods, emission factors and uncertainties are compared with those of other countries, in order to further verify the correctness of the inventories.
Annual reporting
NERI produces an annual report (National Inventory Report4) for the Climate Convention in which the results of the calculations are presented and the background data, calculation methods, plan for quality assurance and control, uncertainty and recalculations are described and documented. At the request of the Climate Convention, the report is evaluated each year by international experts. During the last few years, improvements have been made in the inventories' quality and documentation, as a result of the quality assurance and control procedures and the evaluations of national and international experts. The planned improvements can be found in section 3.4.2.
3.4.2 Information under Article 10(a) of the Protocol on improvements of emission inventories
Since Denmark's Third National Communication to the Climate Convention (NC3) a number of improvements have been made to the Danish greenhouse gas emission inventories in terms of methodology used, emission factors, and documentation. On evaluation of NC3, certain deficiencies were pointed out in the Danish inventories, including lack of an inventory for emissions for waste water treatment and certain industrial processes, as well as a lack of organisation of the industrial incineration plants into subsectors. These deficiencies have now been corrected to a large degree, and only few improvements are planned that will influence the actual level of the greenhouse gas inventory. Before the next report for April 2006 CO2 emissions from the use of lime and limestone in flue gas desulphurisation, production of expanded clay and production of sugar will be included in the inventories. These sources are expected to contribute approximately 0.2% of the total greenhouse gas emissions. Improved and more detailed inventory methodologies will be developed for agricultural machinery and fisheries, and the issue of whether the data basis for calculating CH4 from landfills can be improved will be considered. These improvements are not expected to change the scale of the total greenhouse gas emissions.
Furthermore, overall focus will be on improving procedures for quality assurance and control and on improving documentation of the national emission factors.
Notes
1 A detailed description of the CORINAIR system used for Danish emissions inventories is given in Illerup et al. 2000 and Winther et al., 1998.
2 IPCC (1997): Greenhouse Gas Inventory Reporting Instructions. Revised 1996 IPCC Guidelines for National Greenhouse Gas Inventories, Vol 1, 2 and 3. The Intergovernmental Panel on Climate Change (IPCC), IPCC WGI Technical Support Unit, United Kingdom. http://www.ipcc-nggip.iges.or.jp/public/gl/invs1.htm
3 EMEP/Corinair (2003): Emission Inventory Guidebook. 3rd edition, prepared by the UNECE/EMEP Task Force on Emissions Inventories and Projections, 2003 update. Available at http://reports.eea.eu.int/EMEPCORINAIR3/en (10-05-2004).
4 al., 2000, 2001, 2002 and 2003al., 2000, 2001, 2002 and 2003.
6 DJF no. 113. January 2005, DJF (Danish Institute of Agricultural Sciences).
Version 1.0 December 2005, © Danish Environmental Protection Agency