Denmark's Climate Policy Objectives and Achievements
3. Description of Trends in, and Projections of greenhouse gas emissions and removals
- 3.1 Past trends in greenhouse gas emissions and removals
- 3.2 Projected trends in greenhouse gas emissions and removals in the "with measures" baseline scenario
- 3.3 The projection without measures
- 3.4 Projected trends in greenhouse gas emissions and removals in a scenario including additional measures
3.1 PAST TRENDS IN GREENHOUSE GAS EMISSIONS AND REMOVALS
In accordance with the Climate Convention, Denmark sends annual reports on greenhouse gas emissions and removals, etc. to the climate secretariat. The most recent inventory on emissions covering the period 1990-2003 was forwarded in April 2005 in the so-called National Inventory Report (NIR2005), which is referred to for further details.
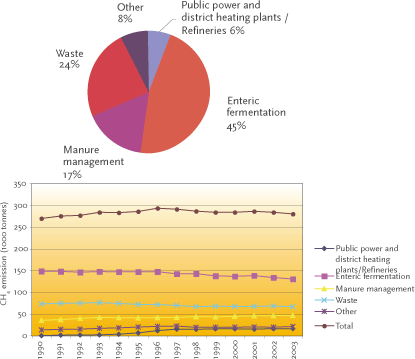
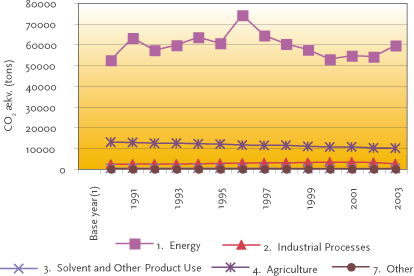
Denmark’s emission of the greenhouse gases CO2 (carbon dioxide), CH4 (methane), N2O (nitrous oxide), and the so-called potent greenhouse gases (F gasses), which include HFCs (hydrofluorcarbons), PFCs (perfluorcarbons), and SF6 (sulphurhexafluorid) during the period 1990-2003 are shown in Figures 3.1-3.4 aggregated into the IPCC’s 6 main sectors and the most relevant sub-sectors. Denmark’s total greenhouse gas emissions measured in CO2 equivalents on the basis of the potential of each gas for global warming is shown together with the distribution with respect to gas and source/sector in Table 3.1 and Figures 3.5 and 3.6 respectively.3.1.1 Carbon dioxide (CO2)
CO2 emissions primarily stem from the combustion of coal, oil and natural gas at power plants and in the domestic sector. But road traffic also contributes substantially.
The relatively great variations in emissions from year to year are due to trading in electricity with other countries, especially Scandinavian countries. The large emissions in 1991, 1994, 1996, and 2003 are due to large exports.
Emissions tended to rise from 1990 to 1996, whereas they have dropped from 1997. This is due to the fact that more power plants change from using coal to using natural gas and renewable energy. As a result of the reduction in the use of coal in recent years, most of the CO2 emissions come from the burning of oil.
FIGURE 3.1: CO2 EMISSIONS BY SECTOR AND DEVELOPMENT IN 1990-2003
Source: The National Environmental Research Institute
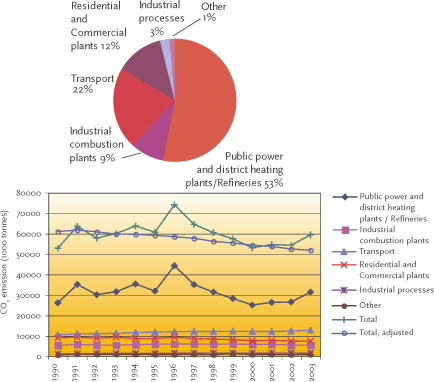
In 2003, road traffic was responsible for 22% of total CO2 emissions.
3.1.2 Methane (CH4)
Anthropogenic methane (CH4) emissions primarily stem from agriculture, landfills, and the energy sector, among which agriculture contributes the most by far.
Emissions from agriculture stem from the digestive tracts of domestic animals (enteric fermentation) and from manure.
Emissions of methane from landfills are decreasing, because the production of methane has fallen year by year since the abrupt fall in landfilling in 1997.
Emissions of methane from the energy sector have been increasing due to an increased use of gas-driven engines, which emit large amounts of methane compared to other combustion technologies. These emissions are, however, expected to be reduced from 2006, when new emission limits for existing gas-driven engines come into force.
In 2003, total methane emissions
were 3% above the 1990 level.
FIGURE 3.2 CH4 EMISSIONS BY SECTOR AND DEVELOPMENT IN 1990-2003
Source: The National Environmental Research Institute
3.1.3 Nitrous oxide, N2O
Agriculture constitutes the largest source by far of nitrous oxide (N2O) emissions, since N2O can be formed in the ground, where bacteria convert nitrous compounds from fertilizer and manure. Bacteria can also convert nitrous compounds in drainage water and coastal waters. These compounds primarily originate from fertilizers. Therefore emissions from these sources are included under agriculture. From 1990, N2O emissions from agriculture had dropped 30% due to the reduced use of commercial fertilizers and more efficient use of manure. A small share of the nitrous oxide emissions originates from power and district heating plants, and cars with catalytic converters.
In 2003, total nitrous oxide emissions were 25% below the 1990 level.
3.1.4 The potent greenhouse gases HFCs, PFCs, and SF6
The contribution of the potent greenhouse gases, also known as F-gases (HFCs, PFCs and SF6), to Denmark's total emissions of greenhouse gases is relatively modest. However, the emissions of these gases rose strongly during the 1990s. Collection of data on the consumption of these substances started in the mid 1990s. Therefore, F-gas data and emissions inventories from before 1995 are somewhat less certain than in 1995 and later. In accordance with the Kyoto Protocol, Denmark has selected 1995 as the base year for the F-gases.
The HFCs, which are primarily used in the refrigeration industry, are the biggest contributor to F-gas emissions. From 1995 to 2003 annual HFC emissions increased from 218,000 to 695,000 tonnes of CO2 equivalents. PFC emissions rose in the same period from 1,000 to 19,000 tonnes CO2 equivalents, however with a slight fall in 2003 compared to 2002. SF6 emissions dropped by 71% from 107,000 to 31,000 tonnes of CO2 equivalents in the period.
FIGURE 3.3 N2O EMISSIONS BY SECTOR AND DEVELOPMENT IN 1990-2003
Source: The National Environmental Research Institute
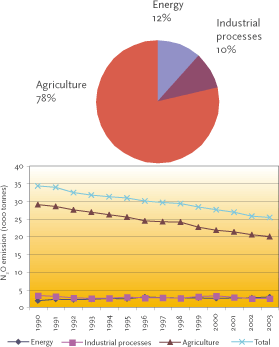
FIGURE 3.4 DEVELOPMENT IN HFC, PFC, AND SF6 EMISSIONS IN 1990-2003
Source: The National Environmental Research Institute
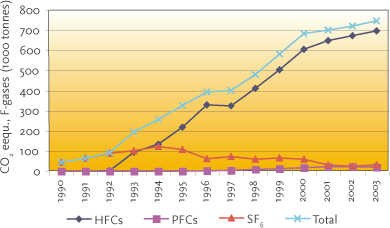
Total F-gas emissions rose by 129% from 1995 to 2003.
3.1.5 Denmark's total greenhouse gas emissions and removals
Table 3.1, figures 3.5 and 3.6 show the development in Denmark's greenhouse gas emissions and removals as CO2 equivalents and by gases and sources according to inventory guidelines on summary information under the Climate Convention. CO2 is the most important greenhouse gas followed by N2O and CH4. From 1996, when total emissions (excl. LUCF) corresponded to 90 million tonnes of CO2 equivalents, there has been a general reduction until 2000, when total emissions corresponded to 68.3 million tonnes of CO2 equivalents, whereas total greenhouse gas emissions corresponded to 74 million tonnes of CO2 equivalents (excl. LUCF) in 2003. The increase of 7.3% from 2002 to 2003 is due to large exports of electricity to other Scandinavian countries. Of the total greenhouse gas emissions in 2003, CO2 made up 80%, methane 8%, nitrous oxide 11%, and F-gasses 1%. If net contributions from forests and land and removal of CO2 (i.e. with LUCF) are included, then net total Danish greenhouse gas emissions corresponded to 72.8 million tonnes of CO2 equivalents in 2003.
TABLE 3.1 DANISH GREENHOUSE GAS EMISSIONS AND REMOVALS BY GAS AND SOURCE IN 1990 – 2003
Source: The National Environmental Research Institute (NERI)
FIGURE 3.5 DANISH GREENHOUSE GAS EMISSIONS BY TYPE OF GAS IN 1990 - 2003.
Source: The National Environmental Research Institute
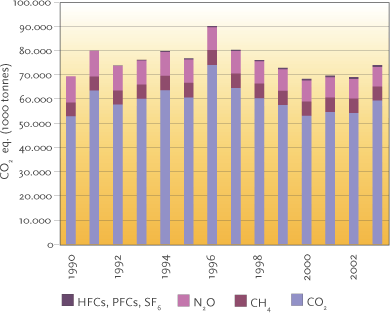
FIGURE 3.6 DANISH GREENHOUSE GAS EMISSIONS BY SOURCE/SECTOR IN 1990 – 2003
Source: The National Environmental Research Institute
3.2 PROJECTED TRENDS IN GREENHOUSE GAS EMISSIONS AND REMOVALS IN THE "WITH MEASURES" BASELINE SCENARIO
3.2.1 Total effect of measures
According to the EU's burden sharing agreement, Denmark has committed itself to a reduction of greenhouse gas emissions by 21% in the period 2008-2012 in relation to the base year 1990/95 under the Kyoto Protocol.
In connection with this agreement, Denmark had reservations with respect to effects of large imports of electricity from Norway and Sweden in the base year 1990, which reduced Denmark's emissions that year by 6.3 mill. tonnes of CO2 compared to the domestic production of electricity to cover consumption. The Danish position was, and is, that the Danish EU reduction commitment should not be based on low emissions in a single year like in 1990, where low emissions were due to exceptionally large imports of electricity. In March 2002, Denmark had to accept a Council decision subjecting Denmark to the legal commitment to reduce emissions by 21% compared to the base year, without correcting for imports of electricity.
Denmark was, however, assured in a political declaration from the EU Council of Ministers and the European Commission that the assumptions relating to base year emissions will be taken into account in connection with fixing the assigned amount of emissions in 2006, measured in tonnes of CO2 equivalents. The government, therefore, aims at a reduction burden for Denmark in 2008-2012 which is equal to 21% of the 1990 level corrected for imports of electricity. The difference corresponds to 5 mill. tonnes of CO2 equivalents annually in 2008-2012.
The shortfall in respect of fulfilling Denmark's obligations with the existing policies and measures has been calculated both for a situation in which account is taken of the electricity import in 1990 and for a situation in which account is not taken of this.
The projections are based on a number of sector-specific projections of domestic emissions for the period. These emissions depend on the extent of economic activity in all sectors of society, energy prices, technological development, and legislation regulating individual activities in relation to the environment, energy efficiency, etc. Among the most important preconditions are the Ministry of Finances' estimate of economic development and the IEA's expectations regarding future energy prices. The projections are also based on measures already adopted described in the Fourth National Communication (Chapter 4 and Annex B). Corresponding to the most recent inventory of greenhouse gas emissions, Denmark's reduction commitment of 21% entails that emissions must be reduced from an amount corresponding to 69.6 million tonnes of CO2 equivalents in the base year 1990/95 to 55 million tonnes of CO2 equivalents in 2008.2012.
The most recent projections from May 2005 include the period 2004.2030 and are shown in Annex E of the Fourth National Communication. Computations for 2013-2030 are, however, somewhat more uncertain than the projections up to 2013, due to several factors, including the fact that uncertainties concerning measures and their expected effects increase with projection length. The projection is a ”with measures” projection, which includes measures that have been or are expected to be implemented. Therefore the projection must not be confused with the most likely development, since effects of new political initiatives, which will most likely be implemented as part of the continued follow-up to the Climate Strategy, have not been taken into account.
Since the Climate Strategy of 2003 and the associated baseline projection without additional measures, a baseline projection has been prepared and the previous emission inventories have been up-dated as a result of new knowledge, including new figures for the base year. Therefore the climate deficit has changed in comparison to the inventory in the Climate Strategy. The deficit is what Denmark lacks to fulfill the target for reduction of greenhouse gas emissions under the Kyoto Protocol and EU burden sharing.
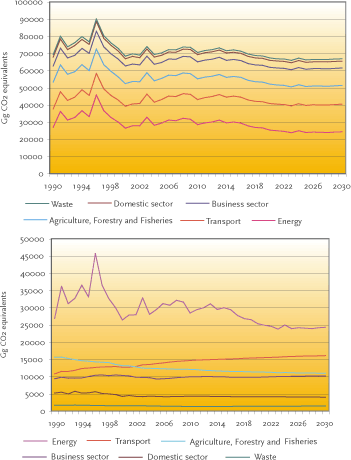
In the new baseline projection, Denmark's expected annual net greenhouse gas emissions under the Kyoto Protocol for the period 2008-2012 correspond to 72.3 million tonnes of CO2 equivalents, as shown in Table 3.2. The emissions in the new baseline projection are 7.8 million tonnes of CO2 equivalents lower than in the previous baseline projection without additional measures, on which the Climate Strategy was based. The new baseline projection for the entire period 2004-2030 is shown in Figure 3.7, altogether and aggregated into the economic sectors described in chapter 4 of the Fourth National Communication.
The projection for the period 2008.2012 is 7.8 million tonnes of CO2 equivalents less than the previous projection. This is primarily due to the reduction in exports of electricity, e.g. as a result of price effects of new electricity production capacity in Finland and Sweden and of the introduction of the EU allowance regulation. The reduction in exports of electricity corresponds to almost 5.5 million tonnes of CO2 (from 9.9 to 4.4 million tonnes of CO2). To this can be added a reduction corresponding to approx. 2 million tonnes of CO2 equivalents in the energy sector due to the continued shift towards more natural gas and renewable energy, which is in reality even bigger, since the figure also includes expectations adjusted upward to emissions corresponding to approx. 1.3 million tonnes of CO2 equivalents from extraction in the North Sea.
In the business sector, the change in the new projection corresponds to the effect of Kemira's termination of nitric acid production in Denmark, since the reduction in the industry's energy consumption, corresponding to approx. 0.5 million tonnes of CO2 equivalents has largely been compensated for by a similar increase in process emissions, where the increase from cement production contributes the most (almost 0.4 million tonnes of CO2 equivalents).
FIGURE 3.7 DENMARK'S EXPECTED NET GREENHOUSE GAS EMISSIONS UNDER THE KYOTO PROTOCOL FOR 2004-2030 IN THE NEW BASE PROJECTION, WHICH IS A PROJECTION ”WITH MEASURES”, I.E., A PROJECTION THAT ONLY INCLUDES EXPECTED EFFECTS OF EXISTING AND ADOPTED MEASURES
Source: 1990-2003: The National Inventory Report (NIR), the National Environmental Research Institute (NERI), April 2005. 2004-2030: Projection of greenhouse gas emissions, Memorandum to the Danish EPA, NERI, May 2005.
The increase in the domestic sector follows the upward-adjusted projection of energy consumption.
Of the increase of 0.4 million tonnes of CO2 equivalents from waste, almost 0.3 million tonnes are due to the new inclusion of methane and nitrous oxide from wastewater. Since this source has also been included in the base year 1990 and it is almost unchanged, up-dating emission inventories and projections to include this source does not alter the deficit. But the deficit is influenced slightly by the up-dated projection of 0.1 million tonnes of CO2 equivalents of methane from landfills.
To these expected effects of new measures and changes on the total result due to the new projection of emissions should be added expected effects of funds allocated for projects reducing greenhouse gas emissions in other countries – that is the JI and CDM projects, cf. articles 6 and 12 in the Kyoto Protocol. Since the Climate Strategy for the period 2003-2008 was agreed, Denmark has allocated DKK 1,130 million to such projects, corresponding to 4.5 million tonnes of CO2 equivalents annually in 2008-2012 with an average cost of DKK 50 per tone.
As shown in Table 3.2, the Danish deficit is estimated on this background to be approx. 13 million tonnes of CO2 equivalents annually, based on Denmark's legal commitment under the EU Burden Sharing Agreement. This is based on a situation where no corrections has been made for the particularly large imports of electricity in 1990.
If this correction is made as assumed by Denmark, the deficit is reduced to approx. 8 million tonnes of CO2 equivalents annually in 2008-2012, as shown in Table 3.2.
Compared to the deficit of 20-25 million tonnes of CO2 equivalents annually in 2008-2012, inventoried on the basis of the projection which was presented together with the Government's Proposal for a Climate Strategy for Denmark in February 2003 to show the expected development without implementation of additional measures, there is a reduction of approx. 12 million tonnes of CO2 equivalents annually in 2008.2012.
Using this method, the deficit expresses the need for buying allowances abroad or for implementing additional measures outside sectors subject to allowances. As a result of the introduction of the CO2 allowance scheme, the deficit is not in principle directly comparable to the deficit in the Government's Climate Strategy, since the cost effects of the allowances have been taken into account, whereas it is ultimately only the allocation of allowances that decides the climatic effects of the scheme.
Note that the projection, and therefore also the deficit, is based on model predictions, which are subject to uncertainty. This applies, not least, to expected developments in energy prices, prices of CO2 allowances, and the developments in the Nordic electricity market, which have a direct influence on the size of exports of electricity. This is illustrated in more detail through sensitivity analyses, cf. section 5.2.4. The implementation of the EU allowance scheme has, however, created a basis for greater certainty regarding the fulfilment of Denmark's climate commitments under the Kyoto Protocol and the EU Burden Sharing Agreement.
The “with measures” projection presented in this report is the most recent projection. It was finalised in May 2005 and it is in general based on expected effects of policies and measures implemented or adopted until the end of 2004. Due to the adoption of additional energy-savings initiatives in 2005, up-dated projections in the offshore sector and new IEA projections of energy prices, an up-date of the May 2005 “with measures” projection has been initiated. However, results from this up-date will not be available until the beginning of 2006. Preliminary results suggests that the action plan on additional energy-savings initiatives could lead to a 2 mill. tonnes further reduction in annual CO2 emissions 2008-2012.
TABLE 3.2 DENMARK'S EXPECTED GREENHOUSE GAS EMISSIONS AND THE EXPECTED DEFICIT COMPARED TO THE EU BURDEN SHARING OF THE EU REDUCTION TARGET UNDER THE KYOTO PROTOCOL.
Source: 1990-2003: The National Inventory Report (NIR), the National Environmental Research Institute (NERI), April 2005. 2004-2030: Projection of greenhouse gas emissions, Memorandum to the Danish EPA, NERI, May 2005.
| Million tonnes of CO2 equivalents | Base year¹ 1990/95 |
2003 | “2010”² | “2015”³ | 2020 | 2025 | 2030 |
| CO24 | 52.9 | 59.2 | 59.0 | 58.8 | 55.2 | 54.2 | 54.9 |
| Methane, CH4 | 5.7 | 5.9 | 5.6 | 5.3 | 5.2 | 5.2 | 5.2 |
| Nitrous oxide, N2O | 10.7 | 8.1 | 6.9 | 6.8 | 6.6 | 6.5 | 6.5 |
| Industrial gases HFCs, PFCs and SF6 | 0.3 | 0.7 | 0.8 | 0.5 | 0.2 | 0.2 | 0.2 |
| Total emissions | 69.6 | 73.9 | 72.3 | 71.4 | 67.2 | 66.1 | 66.8 |
| Of which exports of electricity: (-means imports) |
-6.3 | 6.9 | 4.4 | 2.3 | 1.4 | 0.9 | 2.7 |
| Kyoto target: -21% | 55.0 | ||||||
| Reductions in other countries from funds allocated to JI and CDM projects | 4.5 | ||||||
| Deficit incl. JI and CDM | 7.8/12.85 |
1 Base year for CO2, methane, and nitrous oxide is 1990. In accordance with the Kyoto Protocol, 1995 is chosen as the base year for industrial gases.
2 “2010” stands for mean emissions in 2008-2012.
3 “2015” stands for mean emissions in 2013-2017
4 Here net emission of CO2 inventoried under the Kyoto Protocol, because removal of CO2 in new forests planted since 1990 is included cf. Protocol article 3.3.
5 The deficit has been calculated both on the basis of the assumption of taking imports of electricity in 1990 into account, cf. the political statement of the Council and the Commission and on the basis of Denmark's legal commitment under the EU Burden Sharing Agreement.
3.2.2 Carbon dioxide, CO2
Table 3.3 shows the expected development in CO2 emissions. The largest source of CO2 emissions in Denmark is the burning of fossil fuels, including for the production of electricity, heating and transport.
Since 1990, the transport sector has shown the greatest increase in CO2 emissions, and this increase is expected to continue throughout the projection period. CO2 emissions from the transport sector were 10,441 Gg of CO2 in 1990 and had risen to 12,785 Gg of CO2 in 2003, whereas the projection for 2008.2012 is 13,890 Gg of CO2 annually. Emissions from energy production, including conversion and distribution have varied in 1990-2003 due to great variations in exports/imports of electricity. Emissions from the production of energy were 26,173 Gg of CO2 in 1990 and 31,402 Gg of CO2 in 2003, whereas the projection for 2008-2012 is 29,021 Gg of CO2 annually, of which 4,400 Gg of CO2 are due to electricity exports.
Total CO2 emissions, excluding land-use changes and forestry (LUCF19) were 52,887 Gg of CO2 in 1990 and 59,329 Gg of CO2 in 2003, whereas the projection for 2008-2012 is 59,233 Gg of CO2 annually.
3.2.3 Methane, CH4
Most of the methane emissions come from the digestive tracts of domestic animals. The projections are shown in Table 3.4. The reduction in emissions from agriculture from 1990 to 2001 and the continued reductions in the projection period are primarily due to reductions in cattle stocks. The next largest source of methane is landfills, from which emissions were also reduced from 1990 to 2001. Methane emissions from the energy sector have, however, increased considerably during the same period, due to an increase in the use of gas-driven motors. This has altogether led to an increase in total methane emissions from 5,684 Gg of CO2 equivalents in 1990 to 5,873 Gg of CO2 equivalents in 2003, whereas the projection for 2008-2012 is lower, i.e. 5,573 Gg of CO2 equivalents annually.
3.2.4 Nitrous oxide, N2O
Agriculture constitutes the most important source of nitrous oxide emissions, since soil bacteria can create this gas on the basis of fertilizer and manure spread on fields. The projections are shown in Table 3.5. The decrease in total emissions from 10,713 Gg of CO2 equivalents in 1990 to 8,060 Gg of CO2 equivalents in 2003 is primarily due to a combination of the Action Plan for the Aquatic Environment I and II and the Action Plan for Sustainable Agriculture. The projection for 2008-12 is 6,942 Gg of CO2 equivalents annually. This substantial reduction is not least due to the fact that Denmark ceased to produce nitrous acid in 2004, as shown under industrial processes in Table 3.5. Contributions from the transport and energy sectors are expected to increase, whereas contributions from agriculture are expected to be somewhat less than in 2001.
TABLE 3.3 PROJECTIONS OF DENMARK’S CO2 EMISSIONS IN 2004 – 2030 AND EMISSIONS OBSERVED IN 1990, 1995, 2000, AND 2003.
Source: 1990-2003: The National Inventory Report (NIR), NERI, April 2005.
2004-2030: Projections of greenhouse gas emissions, Memorandum to the Danish EPA, NERI, May 2005
TABLE 3.4 PROJECTIONS OF DENMARK’S METHANE EMISSIONS IN 2004 – 2030 AND EMISSIONS OBSERVED IN 1990, 1995, 2000, AND 2003.
Source: 1990-2003: The National Inventory Report (NIR), NERI), April 2005.
2004-2030: Projection of greenhouse gas emissions, Memorandum to the Danish EPA, NERI, May 2005
TABLE 3.5 PROJECTIONS OF DENMARK’S NITROUS OXIDE EMISSIONS IN 2004–30 AND EMISSIONS OBSERVED IN 1990, 1995, 2000, AND 2003.
Source: 1990-2003: The National Inventory Report (NIR), NERI, April 2005.
2004-2030: Projection of greenhouse gas emissions, Memorandum to the Danish EPA, NERI, May 2005.
TABLE 3.6 PROJECTIONS OF DENMARK’S INDUSTRIAL GAS EMISSIONS IN 2004 – 30 AND EMISSIONS OBSERVED IN 1995, 2000, AND 2003.
Source: 1990-2003: The National Inventory Report (NIR), the National Environmental Research Institute (NERI), April 2005.
2004-2030: Projections of greenhouse gas emissions, Memorandum to the Danish Environmental Protection Agency (EPA), NERI, May 2005.
TABLE 3.7 PROJECTIONS OF DENMARK’S TOTAL GREENHOUSE GAS EMISSIONS AND REMOVALS IN 2004–2030 AND EMISSIONS OBSERVED IN 1990, 1995, 2000, AND 2003.
Source: 1990-2003: National Inventory Report (NIR), NERI, April 2005.
2004-2030: Projection of greenhouse gas emissions, Memorandum to the Danish EPA, NERI, May 2005.
3.2.5 Industrial gases, HFCs, PFCs, and SF6
In accordance with provisions of the Kyoto Protocol, Denmark chose 1995 as its base year for emissions of the industrial gases HFCs, PFCs, and SF6. Total emissions of these gases corresponded to 326 Gg of CO2 equivalents in 1995 and annual emissions have more than doubled since the year 2000. The rate of increase has decreased since 2003, when emissions corresponded to 746 Gg of CO2 equivalents.
The decrease in the rate of increase is primarily due to taxes and regulations introduced concerning the use of new installations/products. For the period 2008-12 total emissions of industrial gases corresponding to 768 Gg of CO2 equivalents annually are projected, after which a major reduction in emissions of HFCs, the major contributors, is expected and will result in a considerable reduction in emissions of industrial gases following the first period of commitment.
3.2.6 Denmark's total greenhouse gas emissions and removals
Table 3.7 shows the base year and projections of Denmark's total greenhouse gas emissions and removals.
3.3 THE PROJECTION WITHOUT MEASURES
According to the guidelines for national communications, projections without expected effects of measures implemented after a certain point in time may also be reported in national communications.
The Effort Analysis from 2005 includes such a projection of Denmark's greenhouse gas emissions in 2008-2012 excluding measures which were implemented from 1990 to 2001, cf. section 4.1.
3.4 PROJECTED TRENDS IN GREENHOUSE GAS EMISSIONS AND REMOVALS IN A SCENARIO INCLUDING ADDITIONAL MEASURES
The Government's Climate Strategy from 2003 contains a number of expected effects of supplemental policies and measures that are planned but still not implemented.
The Strategy does not, however, present a projection with additional measures included in a traditional manner.
With the allowance regulation, it is left to the individual businesses to decide whether market conditions make the buying of extra allowances or the implementation of emission-reducing measures – e.g. saving energy - most favourable.
With the entering into force of the Kyoto Protocol, demands have shifted from traditional projections of greenhouse gas emissions to more appropriate target-fulfilment projections, which is expressed by e.g. the inclusion of expected effects of funds already allocated to JI and CDM projects as in Table 3.2.
If additional, specific cost-effective measures that should be included in future planning of reduction efforts are found in connection with the Policies and measures Project (section 2.2.4.2), then up-dated projections can be made where expected effects of these additional measures are included.
Version 1.0 December 2005, © Danish Environmental Protection Agency