Denmark's Climate Policy Objectives and Achievements
Annex Selected indicators
1. GREENHOUSE GAS INVENTORIES AND PROJECTIONS
FIGURE 5.1 DENMARK'S EXPECTED NET GREENHOUSE GAS EMISSIONS UNDER THE KYOTO PROTOCOL FOR 2004-2030 IN THE NEW BASELINE PROJECTION, WHICH IS A PROJECTION “WITH MEASURES”, I.E. A PROJECTION THAT ONLY INCLUDES EXPECTED EFFECTS OF EXISTING AND ADOPTED MEASURES. BOTH ACCUMULATED AND NON-ACCUMULATED TRENDS ARE SHOWN.
Source: 1990-2003: The National Inventory Report (NIR), the National Environmental Research Institute (NERI), April 2005. 2004-2030: Projection of greenhouse gas emissions, Memorandum to the Danish EPA, NERI, May 2005.
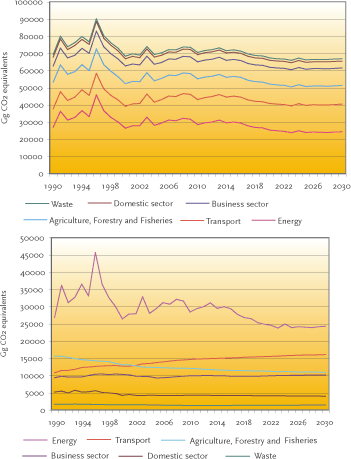
This Figure shows the actual trends 1990-2003 and projected trends 2004-2030 in Denmark's total greenhouse gas emissions by economic sector both accumulated (to the left) and non-accumulated (to the right). Projected trends are from Denmark's latest baseline projection (the so- called “with measures” projection) from May 2005. Further information on the projections and policies and measures in the economic sectors is available in text of this report and in Denmark's Fourth National Communication.
2. GROSS DOMESTIC PRODUCT (GDP), CO2 EMISSIONS AND ENERGY CONSUMPTION FIGURE 1.1 TREND IN FINAL ENERGY CONSUMPTION, GDP AND ENERGY INTENSITY
FIGURE 1.1 TREND IN FINAL ENERGY CONSUMPTION, GDP AND ENERGY INTENSITY
Source: Danish Energy Authority
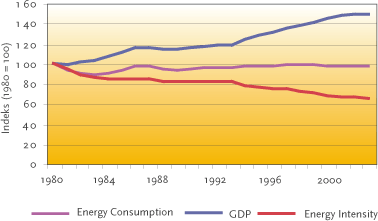
This Figure shows GDP developments, corrected CO2 emissions and gross energy consumption from 1975 to 2003.
Corrected means that variations due to climate and net exports of electricity are compensated for. Denmark's corrected gross energy consumption and CO2 emissions in 2003 were almost the same as in 2002. Since 1990, GDP has increased 30%, whereas the corrected energy consumption has only increased app. 1%. During the same period, corrected CO2 emissions decreased app. 15%, due, in particular, to increased use of renewable energy and use of natural gas at the power plants. Natural gas produces less CO2 per unit of energy than, e.g. oil and coal.
3. EMISSIONS OF GREENHOUSE GASES AND CO2 PER CAPITA
Source: National Environmental Research Institute and Statistics Denmark
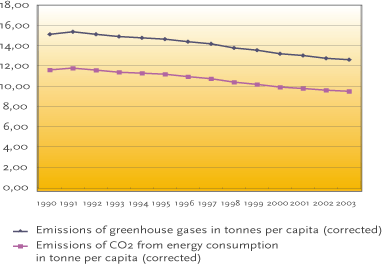
This Figure shows Denmark's corrected total greenhouse gas emissions and CO2 emissions per capita from the base year under Kyoto Protocol to 2003. Corrected means that variations due to climate and net exports of electricity are compensated for in order to better reflect Denmark's efforts and progress with national measures aiming at reducing emissions from energy consumption by the Danish population. Denmark's corrected total greenhouse gas emissions and CO2 emissions per capita both decreased about 17% in the period.
4. RENEWABLE ENERGY
Source: Danish Energy Authority
4A. PRODUCTION OF RENEWABLE ENERGY ETC. – SHARE OF GROSS ENERGY CONSUMPTION
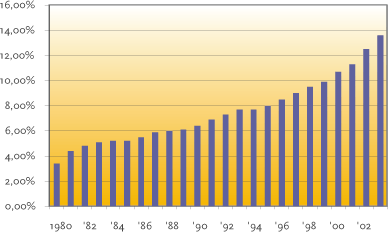
Renewable energy etc. includes solar energy, wind energy, hydropower, geothermal energy, biomass, biodiesel, biogas, wastes and heat pumps. Year by year, renewable energy etc. is accounting for a greater share of total energy con-1995, the proportion has increased on sumption. In 2003, the production of average by between half and one perrenewable energy etc. covered 13.6 per centage point annually. The increased cent of the climate-adjusted gross energy use of renewable energy etc. makes consumption as opposed to 6.4 per cent a significant contribution to reducing in 1990 and 3.4 per cent in 1980. Since Danish CO2 emissions.
4B. RENEWABLE ENERGY ETC. BY ENERGY PRODUCT
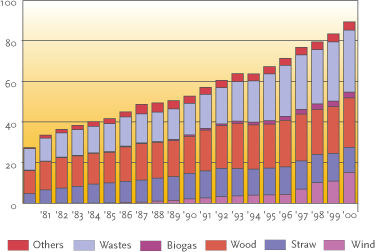
Production of renewable energy etc. increased in 2003 to 112.3 PJ, which is 10.4 PJ or almost 10 per cent more than the previous year. Production of biomass energy (wood and straw) increased by 3.6 PJ to 46.3 PJ and thus was the largest contributor to the increase. Wind energy increased by 2.5 PJ to 20.0 PJ, while energy from wastes increased in 2003 by 1.3 PJ to 36.2 PJ. Biomass represented 41 per cent of the renewable energy etc. produced in 2003. Wastes and wind power accounted for 32 per cent and 18 per cent respectively. Consumption of renewable energy, etc. is greater than production. In 2003, 6.4 PJ wood pellets and wood chips were imported, while 1.7 PJ biodiesel was exported.
4C. USES OF RENEWABLE ENERGY ETC. IN 2003
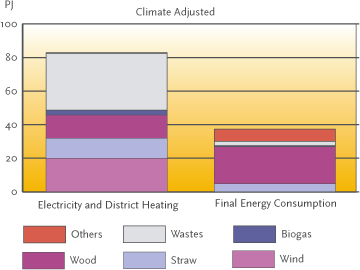
Total consumption of renewable energy, etc. in 2003 (production plus net imports) was 117.0 PJ, of which 82.9 PJ was used in the production of electricity and district heating. Wastes energy was clearly dominant followed by biomass and wind power. The development of offshore wind parks means wind power is expected to play a more prominent role in the years to come. 34.1 PJ renewable energy etc. was included in the final energy consumption, i.e. in processing and heating in the agriculture and industry sector and the trade and service sector, as well as heating in households. In final energy consumption, biomass, particularly wood, is most prominent. Additionally, a small amount of biogas was used by the energy sector.
4D. WIND POWER CAPACITY AND PERCENTAGE SHARE OF ELECTRICITY SUPPLY
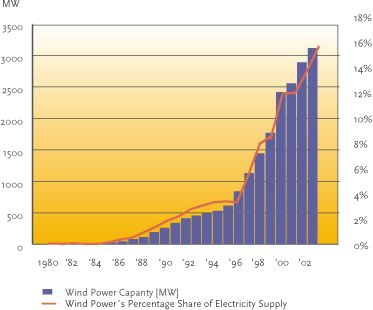
Wind power constitutes an ever larger proportion of the Danish electricity supply. 15.8 per cent of electricity was supplied by wind power in 2003, as opposed to 13.8 per cent in the previous year. The increases in wind power capacity and production do not always correspond exactly, as annual wind power production is highly dependent on wind conditions, which can be quite variable in Denmark. 2001 was a relatively poor wind year, while 2002 and 2003 were close to a normal wind year. Wind power capacity in 2003 was 3115 MW, which is 7.9 per cent more than the year before.
5. GROSS ENERGY CONSUMPTION AND ENERGY INTENSITY
Source: Danish Energy Authority
5A. GROSS ENERGY CONSUMPTION –OBSERVED AND ADJUSTED
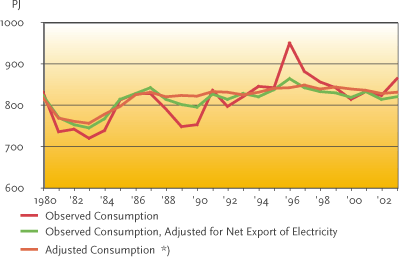
Observed energy consumption shows the registered amount of energy consumed in a calendar year. Gross energy consumption is derived by adjusting observed energy consumption by the fuel consumed to produce electricity for foreign trade. Additionally, the adjusted gross energy consumption is adjusted for climate variations with respect to a normal weather year. The purpose of this consumption figure is to provide a clearer picture of trends in domestic energy consumption. Adjusted gross energy consumption in 2003 was 829 PJ as opposed to 827 PJ in 2002 and 820 PJ in 1990. Observed energy consumption in 2003 was 863 PJ, which is 5.0 per cent higher than for 2002. It is 14.7 per cent higher than in 1990, which should be regarded in the context of considerable net imports of electricity in 1990 as opposed to even larger net exports in 2003.
5B. ENERGY INTENSITY IN PRIVATE COMMERCE AND SERVICE AND PUBLIC SECTOR
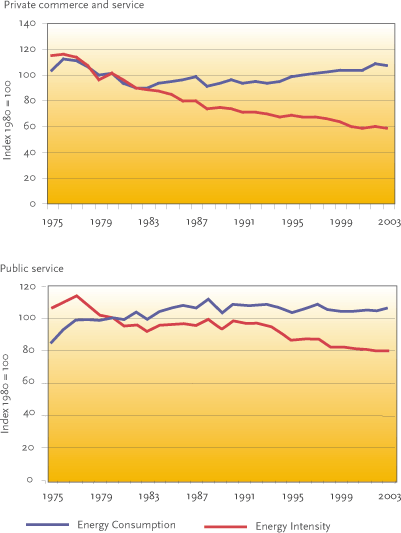
As can be seen from this Figure, over the past 15 years there has been a steady increase in energy consumption by the private commerce and services sector. Primarily electricity consumption has been rising. The growth in energy consumption by the service sector is due to high growth in this sector and reflects a development where services are becoming increasingly important in the economy. As the Figure shows, there has been a constant drop in intensity of on average 2.3% per year from 1975-2003. Since 1990 the drop has been on average 1.6% per year.
Energy consumption in public services (the public sector), as shown in the Figure, has been roughly constant over the last 15-20 years, and since the early 1990s there has been a considerable fall in energy intensity.
6. CO2 FROM ENERGY CONSUMPTION
Source: Danish Energy Authority
6A. CO2 EMISSIONS,OBSERVED AND ADJUSTED
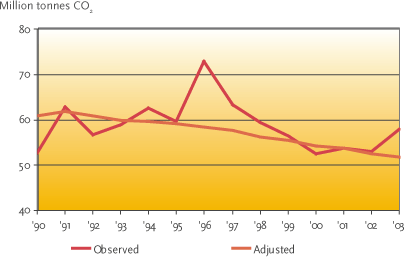
The Danish Energy Authority calculates both observed CO2 emissions and adjusted CO2 emissions, taking into consideration annual temperature variations and foreign trade in electricity. The aim of the adjusted statement is to obtain a better picture of the underlying trends in the development. In 2003, observed CO2 emissions went up by 9.3 per cent in relation to 2002. Compared with 1990, observed CO2 emissions were 9.9 per cent higher. This trend should be seen in the context of a significant increase in net electricity exports from 2002 to 2003. Moreover, the weather was colder in 2003 than in 2002. In 1990, Denmark had large net imports of electricity. In 2003, the adjusted CO2 emissions were 1.2 per cent lower than the year before. Compared with 1990, there has been a fall of 14.9 per cent.
6B. CO2 EMISSIONS BY FUELS
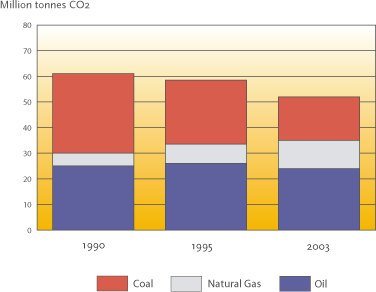
Since 1990, there has been a marked shift in the breakdown of energy consumption by fuel. Consumption of natural gas and renewable energy etc. has increased at the expense of coal consumption. The change in fuel types has led to a decline in CO2 emissions despite an increase in gross energy consumption of 1.0 per cent since 1990, as coal burning generates greater CO2 emissions than the burning of natural gas.
6C. CO2 EMISSIONS PER FUEL UNIT AND PER KWHOF ELECTRICITY
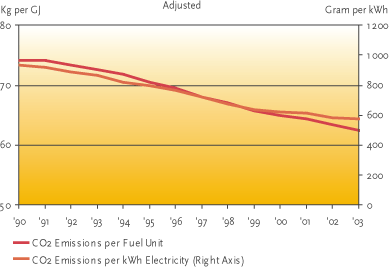
Gross energy consumption has been more or less constant over the last 10 years; however, the fuels used have changed considerably. The shift from coal to natural gas and renewable energy etc. has meant that, year by year, less CO2 is linked to each unit of fuel consumed. Thus, in 2003 each GJ of adjusted gross energy consumption was linked to 62.5 kg CO2, against 74.2 kg in 1990. In 2003, fuel consumption in electricity generation adjusted for electricity exports and climate variations resulted in emissions of 572 g CO2 per kWh electricity. In 1990, 937 g CO2 were emitted per kWh electricity.
6D. CO2 EMISSIONS BY SECTOR
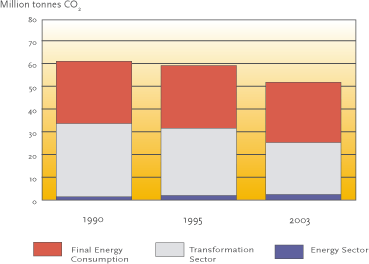
The energy system is divided into three sectors: energy sector (extraction and refining), transformation sector (production of electricity, district heating and town gas) and final consumption (transport and consumption in households and agriculture and industry, excluding energy and transformation sectors). Most of the CO2 reduction since 1990 has been in the transformation sector, when net exports of electricity are disregarded. CO2 emissions in the transformation sector were at 22.8 million tonnes in 2003 compared to 32.2 million tonnes in 1990, corresponding to a decrease of 29.1 per cent. Today, the largest contribution to Danish CO2 emissions comes from final consumption. In 2003, CO2 emissions were at 26.6 million tonnes, as opposed to 27.4 million tonnes in 1990. This corresponds to a reduction of 2.7 per cent.
6E. CO2 EMISSIONS IN FINAL ENERGY CONSUMPTION INCL. ENERGY SECTOR
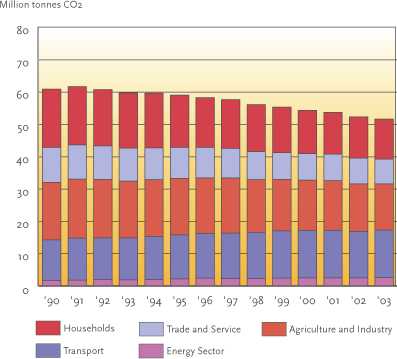
A distribution of CO2 emissions caused by electricity generation and production of district heating and town gas amongst end consumers illustrates how total emissions of CO2 can be attributed to the energy sector, transport, agriculture and industry and households. In 2003, the agriculture and industry sector and transport were responsible for the largest shares of total CO2 emissions, with 28.5 per cent and 27.8 per cent respectively. Households and the trade and service sector accounted for 24.0 per cent and 15.0 per cent respectively, while the energy sector accounted for 5.0 per cent of CO2 emissions. In relation to 1990, CO2 emissions from transport increased by 16.9 per cent. However, for agriculture and industry and households there have been significant decreases. In the agriculture and industry sector and the trade and service sector, CO2 emissions fell by 19.7 per cent and 28.2 per cent respectively, while for households the fall was 31.3 per cent.
Version 1.0 December 2005, © Danish Environmental Protection Agency