EDIPTEX - Environmental assessment of textiles
Annex 1: A T-shirt of 100 % cotton
The T-shirt - summary and conclusions
In this section, the sub-conclusions from the individual scenarios will be summarised in an assessment of producers' and consumers' choices and their consequences.
The main scenario shows that the most significant contributions to the environmental impact potentials related to chemicals originate from cotton cultivation. Resource consumption and the contributions to the environmental impact potentials related to energy, as well as waste categories mainly originate from generation of electricity for the large consumption of electrical energy in the use phase.
At an overall level, the scenarios indicate that the consumer holds the best possibilities for influencing the product's overall environmental profile. This is due to the dominant use phase. The individual consumer's consumption patterns and environmental awareness are therefore crucial, i.e. awareness of ecolabelling of products in combination with good habits like:
- minimal use of washing powder
- no use of fabric softeners
- no tumbler drying
- no ironing
- disposal to incineration plant.
The producer is primarily able to affect the T-shirt's environmental profile through choice of materials. This is clear in the scenarios where organic cotton has been used. By living up to European and Scandinavian ecolabelling criteria and obtaining labelling approval, the producer can signal to the conscious consumer that the product in question has been produced in an environmentally sound manner. Moreover, there are a number of production-related improvements that only the producer can influence. This could be choices related to:
- organic materials
- choice of softening process
- no treatment to improve colour fastness
- non-toxic reactive dyes.
Introduction
Lifecycle assessment is a method for identification and evaluation of environmental impact potentials of a product or a service from cradle to grave. This method enables the user to make an environmental assessment and focus on the most important environmental impacts.
Lifecycle assessment is an iterative process. The first definition of purpose and delimitations often need to be revised during work with lifecycle assessment. The amount of data available sets limits, and consequently the limits of the system are changed.
The method used in this case for assessment of products is "Environmental Design of Industrial Products" (EDIP) and the associated database and PC tool.
In the EDIPTEX project, sector-specific data have been prepared for the textiles sector in connection with the existing EDIP database. The reports contain environmental assessments for the following textile products:
- T-shirt
- Jogging suit
- Work jacket
- Floor covering
- Tablecloth
- Blouse.
These environmental assessments are intended to illustrate the scope for application of the EDIPTEX database by using the PC modelling tool and, at a more general level, application of the EDIP method.
Method
The six case stories vary a lot in scope. They can be divided into two main groups - with variations within these two main groups. The two main groups are:
- Group I: The T-shirt, the jogging suit and the work jacket.
- Group II: The floor covering, the tablecloth and the blouse.
The division into groups I and II relates to the scope of the collection of data as well as the quality of data.
For group I, it was possible to collect (and process) data for all significant processes. The data are of such quality that these three products have been selected to illustrate how far it is possible to take lifecycle assessment for textiles and to illustrate all relevant aspects of the EDIP method.
Each of the three group I cases contains:
- Definition of functional unit and reference product
- Modelling of main scenario
- Preparation of producer and consumer references
- Simulation of environmental impacts caused by choices made by producer and consumer respectively.
Work with these cases has been divided into phases as illustrated in figure 1.1.
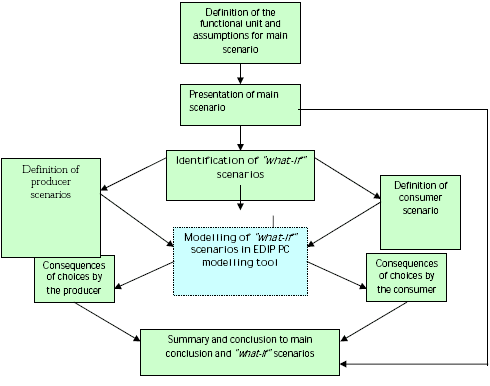
Figure 1.1 EDIPTEX case group I flow diagram
For group II, it was not possible to complete all sub-processes. Although only 1-2 sub-processes for each product have considerable lack of data, these processes are deemed potentially significant for the overall lifecycle assessment. The group II case stories are therefore of an entirely different character than those of group I. The group II cases illustrate that it is possible to tell an interesting and exciting "environment story" based on lifecycle assessment (and EDIP) even though it has not been possible to analyse all aspects of lifecycle assessment data. This situation will arise very often in lifecycle assessment work. However, there is a significant difference in this EDIPTEX connection; it is possible to draw on results from the three lifecycle assessments from case group I (and this has been done), which improves the quality of the case stories.
Comments to the method
Product references
The "what-if" simulations were carried out to elucidate the consequences of possible changes in the product's lifecycle. A special product reference has been defined for the producer scenarios in some of the case stories. The producer only has limited influence on the use phase. In order to take this into account, a product reference has been prepared for the producer scenarios where only a limited part of the impacts from the use phase has been included in relation to the product reference from the main scenario. This was done in order to give producers a clearer picture of the influence of the production phase on the product's environmental profile in the "what-if" producer scenarios.
Data
With regard to data, it should be noted that the validity of the data in the database varies, depending on the processes considered. A global process like cultivation and harvest of cotton is subject to considerable uncertainty. This is because cotton is produced in countries with very different levels of development. For example, production varies a lot between South America and the US because of large differences in the use of pesticides, crop yields, etc.
This difference has not been taken directly into account in the EDIPTEX database, but a representative level for the data has been defined. Therefore, the data are very general and not necessarily representative for all lifecycle assessments. Other processes are more exact, such as extraction of crude oil for nylon. This process is well documented, both as regards industrial accidents and as regards resource consumption.
Production data primarily come from Danish enterprises. The number of enterprises involved represents limitations in this connection. For example, only one reactive dye and one acid dye have been studied thoroughly. These two substances represent the entire group of dyes, despite the major differences that may occur.
A large proportion of the environmental impacts come from the consumption of electrical energy. The data used in the database originate from the EDIP database, and the reference year is 1990. It is important to note that this lifecycle assessment was carried out using the 1990 data in all processes that consume electrical energy.
The T-shirt
Product description: The T-shirt is made of pure cotton. The assessment does not include multicoloured patterns or prints on the product. Data for a black reactive dye are used, and this is assessed to be a worst–case assumption.
Functional unit
The performance assessed can be described as a "functional unit", comprising a qualitative and a quantitative description, including the product's lifetime. The qualitative description is to define the quality level for the performance, so that products can be compared at a somewhat uniform quality level. The quantitative description is to determine the size and duration of the performance.
In this project, the functional unit is defined as:
"50 days' use of T-shirt over the course of one year"
Assumptions in connection with the lifecycle assessment:
The calculations are carried out for "1 T-shirt", this needs to be converted in relation to lifetime, and the calculations need to be converted to "per year".
It is assumed that the T-shirt can be washed 50 times before it is discarded.
It is assumed that the consumer wears the T-shirt 50 days per year.
It is assumed that the T-shirt is used 1 day and is then washed.
Estimated lifetime
If the T-shirt is washed after each use, 50 days' use of the T-shirt means that 1 T-shirt is completely used up in one year - or more likely - that a person has 5 T-shirts that together last 5 years.
Considerations in relation to the use phase
It is assumed that 50 days correspond to the number of days a consumer wears a T-shirt over the course of 1 year. Some consumers have an entirely different consumption of T-shirts. Some people wear a T-shirt every day (often men), while other people do not own a single T-shirt (e.g. women in the age of 60-80).
Reference product and main scenario
The reference product is a product that meets the criteria of one functional unit. Here, we have chosen a T-shirt in coloured cotton. The following assumptions apply to the assessment and are thus included in the modelling of the main scenario.
- 100 per cent cotton.
- Dye: reactive dye.
- Washing 60°C.
- Tumbler drying.
- Ironing not necessary, but it is assumed that many people do it.
- Lifetime: 50 washes.
- Weight: Three different qualities of T-shirt have been weighed: 178 g ("thin" quality), 223 g and 292 g (heavy quality). For this environmental assessment, the assumption is that the T-shirt weighs 250 g.
A more detailed description of the processes, calculations of volumes, waste, etc. can be found in the section "Background data".
Product system
In the following, all phases of the T-shirt's lifecycle will be described from extraction of raw materials through production to the making-up of the finished T-shirt.
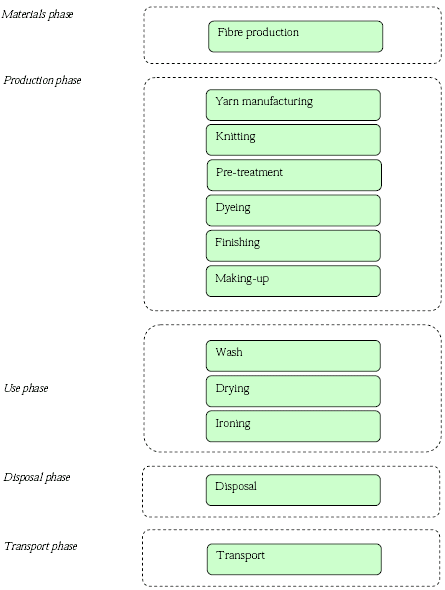
Figure 1.2 Lifecycle, flow and phases
Manufacture of raw materials
The T-shirt consists solely of cotton. Cotton is cultivated in many countries under different geographical and climatic conditions. Cultivation often entails a large consumption of artificial fertilizer, large water consumption and a large consumption of pesticides against insect attacks, diseases, worms and weeds. The extent of this depends largely on local conditions. The consumption of pesticides entails an important environmental problem for both human health and nature.
Irrigation and use of artificial fertilizer impact groundwater and surface water resources quantitatively as well as qualitatively. Before picking, it is common to use defoliating agents so that picking can be done mechanically.
Organic cotton
It is normally not permitted to use pesticides and artificial fertilizer in cultivation of organic cotton. Thus, it is only permitted to use a very limited selection of plant protection agents, and only when there is an acute danger for the crop. Organic production of cotton constitutes less than 1 per cent of total cotton production, but organic production is increasing and is expected to increase further due to increased demand.
Production of the T-shirt
Production is divided into several processes: yarn manufacturing, knitting, pre-treatment, dyeing, finishing and making-up.
Yarn manufacturing
From when the cotton is harvested to the manufacture of the yarn can begin, the fibres need to be separated from the remaining plant material. One of the largest environmental risks in this process is inhalation of cotton dust. In just a few years, staff can develop the disease Byssinosis (commonly called "Brown Lung") which may be fatal. It is important that machines be closed in so that dust development is minimal.
Knitting
Dust development during knitting - both in general and for cotton - is minimal compared to yarn manufacturing. However, mineral knitting oils are often used in connection with knitting, and they are persistent substances. The oils are washed out in subsequent processes where the cotton yarns or the cotton products go through several treatments with water and chemicals, and the oils finally end up in the wastewater from the wet processor/dyer.
Pre-treatment
Raw cotton contains some cotton wax that needs to be removed before it is possible to dye the cotton. This is done in a scouring process at high pH and high temperatures. Remains of pesticides from cotton cultivation, mainly defoliation agents used in connection with the harvest, are washed out in this process and end up in the wastewater.
If the end product is to have a light colour, the cotton is bleached. If the pre-treater/dyer uses chlorine compounds, AOX compounds (adsorbable organic halogens) will be formed and subsequently discharged, and these are harmful to the environment. It is possible to bleach using hydrogen peroxide that does not cause discharges of AOX.
Washing and bleaching with hydrogen peroxide, which is normal in Denmark, has been used as the basis for the environmental assessment of the T-shirt. Moreover, the environmental assessment includes limited discharges of pesticides (0.005 g defoliation agent per kg cotton).
Dyeing
Dyes for dyeing textiles are chemically often based on azo groups and may contain heavy metals. Some dyes containing azo groups may release carcinogenic substances of the type arylamines. However, the textile sector and producers of dyes have been aware of the arylamine issue for many years. The major dye producers and modern European dye houses have thus fully phased out these dyes, but they may still be found in goods imported to Europe. The number of dyes containing heavy metals is being reduced year by year, but dye houses that choose not to use dyes containing heavy metals still have to accept they cannot dye in some specific nuances.
A dye from the group of reactive dyes without heavy metals and without arylamine problems has been selected for this environmental assessment.
Finishing
For a cotton T-shirt, finishing will normally consist of the application of a sewing improvement agent (softening) for the subsequent making-up stage. However, many cotton textiles are given specific functional properties in finishing by means of chemicals. For example, some of the well-known properties are non-iron and fire retardant. Auxiliary chemicals in these productions often have many extremely undesirable environmental properties, both for the environment and for occupational health and safety.
For the environmental assessment of the T-shirt, a non-problematic softener has been selected.
Making-up
In the actual making-up process, there may be great differences in the environmental impacts for the different textile products. This is because the waste from the cutting-to-size process for the final product varies from 6-25 per cent. However, this waste is not necessarily the same as resources lost, because some of the waste products are reused - but often for products of a lower quality. The waste may also be sent to waste incineration with energy recovery, and in reality, the energy content is recovered as electricity for production and should thus be set off against energy consumption by the production equipment. For a T-shirt, "waste" is minimal in making-up - approx. 6 per cent.
Distribution
The T-shirt is packed in polyester bags and then on a wood pallet. Finally, it is distributed to retail suppliers throughout Denmark.
Use phase
The consumption of washing agents and fabric softeners and the consequential discharge of detergents and nutrient salts lead to possible local and regional impacts in the aquatic environment.
Transport
The mode of transport when the T-shirt is transported from the shop to the buyer's home is also important in connection with the overall environmental profile of the product. Options like driving a car, using public transport or a bike make a significant difference in this part of the product's lifecycle.
The disposal phase
Textiles may not be landfilled. On final disposal, they must be incinerated so that the energy content is recovered and replaces non-renewable energy sources like oil and natural gas. In some situations, the used T-shirt will be reused in a third-world country. In such situations, it is not possible to recover energy by incineration in Denmark.
Main scenario - results
The results of the main scenario are presented according to processes. The negative contributions that occur in some processes are due to estimated reuse potentials, resource consumption and contribution to environmental impact potentials. In the processes in question, the contributions can be allocated to other products and thus appear as negative contributions in the T-shirt's environmental profile.
The values in the five figures are not immediately comparable, as the unit is not the same for the five categories. The consumption of primary energy is calculated in mega-joules (MJ), while the resource consumption is shown in the unit "person-reserves". Person-reserves take into account the supply horizon of the individual resources, calculated on the basis of the reserves available in the world in 1990. It should be noted that the data used here are more than ten years old, and therefore, new knowledge about the world's resources may have become available. The environmental impact potentials are presented as "milli-person equivalents" and are directly comparable. Milli-person equivalents are calculated as the direct impact for the year 2000. The weighting factors are based on global (w) or Danish (DK) discharges in the year 2000.
Consumption of primary energy
Figure 1.3 shows that the processes in the use phase represent the majority of the consumption of primary energy. The consumption of primary energy reflects the processes that require a lot of electrical energy or heating air or water. Fibre production consumes a lot of energy due to driving vehicles in the fields and production of artificial fertilizer and pesticides. The production of cotton fibres and the processing into yarns represent the largest contributions during production of the T-shirt. In the use phase, the electricity consumption for washing and, in particular, tumbler drying cause the impacts. When the T-shirt is incinerated in an incineration plant, some energy is recovered and this is credited in the energy accounts.
Resource consumption
The T-shirt consumes a relatively large amount of fossil fuels because of the energy-intensive processes in its lifecycle - see figure 1.4. Because of the large electricity consumption, the resource consumption is high in the use phase. Fossil fuels for generation of electricity and heating are the primary cause of this. In the processes that use Danish electricity, as in the use phase, consumption of coal is highest. In the disposal phase, some resources are credited because energy is recovered that would otherwise have come from burning fossil fuels.
Environmental impact potentials
Figures 1.5 and 1.7 show that the contributions to the toxicological environmental impact potentials are dominant. Particularly ecotoxicity and persistence toxicity are very high, primarily because of the pesticides that are spread on the cotton fields during the cultivation process. The data used to determine the pesticide volumes per hectare are based on a worst-case assumption. For further information, please see annex 8: Memo on data for cotton cultivation and harvest. Therefore, the focus in this phase is to reduce pesticide consumption during cultivation of cotton.
In the production phase, the environmental profile indicates that primarily the finishing process contributes on a large scale. The reason for this is the softening process after dyeing. This process is the focal point of the production phase.
In the use phase, primarily washing agents result in potential persistent toxicity. It has been assumed that no users add fabric softener when washing, and therefore the figures probably do not tally with the actual conditions in private Danish households.
The contributions to the waste categories mainly originate from electricity generation.
Results from modelling and calculation of the main scenario
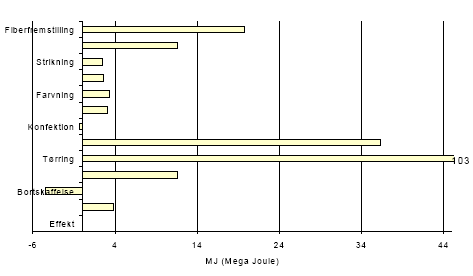
Figure 1.3 Consumption of primary energy per functional unit – for translation of Danish terms see glossary in annex 11
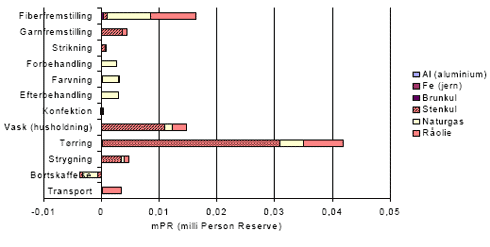
Figure 1.4 Resource consumption per functional unit – for translation of Danish terms see glossary in annex 11
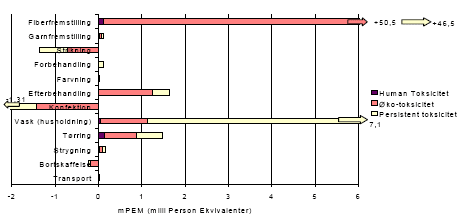
Figure 1.5 Toxicological environmental impact potentials per functional unit – for translation of Danish terms see glossary in annex 11
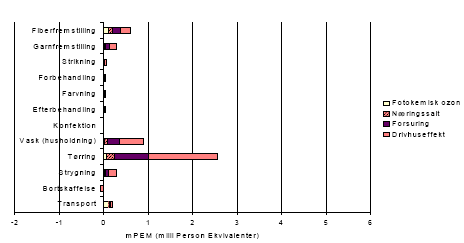
Figure 1.6 Environmental impacts related to energy per functional unit – for translation of Danish terms see glossary in annex 11
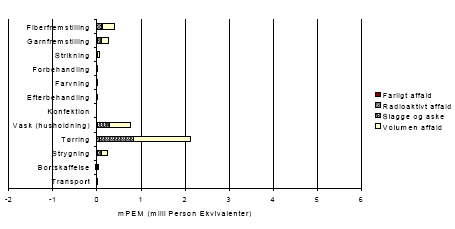
Figure 1.7 Environmental impacts, waste per functional unit – for translation of Danish terms see glossary in annex 11
Source identification
It is often necessary to study the large information volumes included in the results of a lifecycle assessment in order to achieve the best possible benefit of the assessment. A process is composed of a number of factors that all contribute to the impact categories. By carrying out source identification, the reasons for the individual contributions can be found.
This knowledge makes the assessment more useful for the producer, as the producer can change factors with undesired environmental impacts already in the development phase.
Below is an overview of the most significant contributions to the categories:
- Primary energy
- Resource consumption
- Toxicological environmental impacts
- Environmental impacts related to energy
- Waste.
Primary energy
The breakdown of consumption of primary energy over the processes during the lifecycle of the T-shirt is shown in figure 1.3.
The calculation of the consumption of primary energy does not include prints or multicoloured patterns on the T-shirt.
Table 1.1 Source identification of the most energy-intensive processes in the T-shirt's lifecycle
| Consumption of primary energy/MJ | |
| Materials phase | 10 % of total primary energy consumption |
| Fibre production | Approx. 70 % of this phase's contribution originates from transport of the fibres, while production of N artificial fertilizer and pesticides comprises 13 % of this phase's energy consumption. |
| Production phase | 12 % of total primary energy consumption |
| Yarn manufacturing | Approx. 55 % of the production phase's consumption of primary energy originates from electricity consumption during yarn manufacturing. |
| Knitting | The consumption in this process originates from the consumption of Danish electricity corresponding to 10 % of this phase's total consumption. |
| Pre-treatment | The consumption of primary energy in this process originates primarily from burning natural gas, approx. 12 %. |
| Dyeing | The consumption of primary energy in this process originates primarily from burning natural gas, approx. 12 %. |
| Finishing | The consumption of primary energy in this process originates primarily from burning natural gas, approx. 12 %. |
| Making-up | Credit of energy from reuse of cut-off textiles, approx. 1 %. |
| Use phase | 78 % of total primary energy consumption |
| Washing (households) | 24 % of this phase's consumption originates from electricity consumption for heating water in the washing machine. |
| Tumbler drying | 68 % of this phase's consumption is due to consumption of Danish electricity for tumbler dryers. |
| Ironing | 8 % of this phase's consumption originates from the consumption of Danish electricity. |
| Disposal phase | -2 % of total primary energy consumption |
| Incineration | Credit of the energy recovered by incineration of the T-shirt. |
| Transport phase | 2 % of total primary energy consumption |
| Transport | Consumption of fossil fuels for petrol and diesel for various vehicles. |
Description of the most significant observations
The primary contribution originates from transport of cotton fibres. This contribution represents 70 per cent of the total consumption of primary energy in fibre production. 13 per cent originates from production of artificial fertilizer and pesticides.
Spreading fertilizer and pesticides is not included in the model for the T-shirt.
Electricity consumption for drying the T-shirt in a tumbler dryer represents the largest contribution in the entire lifecycle and is thus an important focal point. The consumption of primary energy for the washing machine also represents an important part of total consumption.
Resource consumption
The distribution of resource consumption in the processes in the T-shirt's lifecycle is shown in figure 1.4.
Table 1.2 Source identification of the most resource-intensive processes in the lifecycle of the T-shirt
| Crude oil | Natural gas | Hard coal | |
| Materials phase | 36% of total consumption | 38% of total consumption | 1% of total consumption |
| Fibre production | Primarily from production of artificial fertilizer and pesticides, and transport of fibres | Primarily from production of artificial fertilizer and pesticides, and transport of fibres | Primarily from production of artificial fertilizer and pesticides |
| Production phase | 6% of total consumption | 43% of total consumption | 9% of total consumption |
| Yarn manufacturing | 56 %, primarily for electricity generation for spinning the yarn | 1 %, primarily for electricity generation for spinning the yarn | 80 % of this phase's total coal consumption due to electricity consumption |
| Knitting | 6 %, primarily due to electricity consumption | No importance | 16 % of this phase's total coal consumption due to electricity consumption |
| Pre-treatment | 8 %, primarily due to electricity consumption | 30%, primarily due to electricity consumption | 1 % of this phase's total coal consumption due to electricity consumption |
| Dyeing | 14 %, primarily for heating water | 33%, primarily for heating water | 4 % of this phase's total coal consumption due to electricity consumption |
| Finishing | 9 %, primarily from electrical energy used for drying | 34%, primarily from electrical energy used for drying | 1 % of this phase's total coal consumption due to electricity consumption |
| Making-up | 7 % of this phase's total crude oil consumption due to reuse of textile in another product | 2 % of this phase's total natural gas consumption due to reuse of textile in another product | -2 % of this phase's total coal consumption due to reuse of textile in another product |
| Use phase | 46% of total consumption | 32% of total consumption | 91% of total consumption |
| Washing (households) | 24 % of this phase's contribution, primarily from consumption of Danish electricity | 24 % of this phase's contribution, primarily from consumption of Danish electricity | 24 % of this phase's contribution, primarily from consumption of Danish electricity |
| Drying | 68 % of this phase's contribution, primarily from electricity consumption from tumbler drying | 68 % of this phase's contribution, primarily from electricity consumption from tumbler drying | 68 % of this phase's contribution, primarily from electricity consumption from tumbler drying |
| Ironing | 8 %, primarily from consumption of Danish electricity | 8 %, primarily from consumption of Danish electricity | 8 %, primarily from consumption of Danish electricity |
| Disposal phase | -2 % of total crude oil consumption can be credited | -14 % of total natural gas consumption can be credited | -1 % of total coal consumption can be credited |
| Incineration | Incineration of the T-shirt recovers energy in the form of heat, and this replaces burning natural gas | Incineration of the T-shirt recovers energy in the form of heat, and this replaces burning natural gas | Incineration of the T-shirt recovers energy in the form of heat |
| Transport phase | 15% of total consumption | 1% of total consumption | No importance |
| Transport | Consumption of petrol and diesel | Consumption of petrol and diesel |
The consumption of Fe, Al and lignite is very limited. This resource consumption has not been included here.
The consumption of crude oil and natural gas is most important. Hard coal is burned in the generation of Danish electricity.
Description of the most significant observations
In the fibre production process, primarily the production of pesticides and artificial fertilizer are energy-intensive, and thus represents most of the consumption of crude oil and natural gas. The assumption here is that European electricity is used, and therefore there is no large consumption of coal.
Energy-intensive processes like heating water for dyeing and air for drying represent the main part of resource consumption in this phase. The dyeing and finishing processes are equally as energy-intensive. For finishing, this is primarily due to the drying process.
The use phase is the most resource-intensive phase in the T-shirt's lifecycle. Electricity consumption represents most of the resource consumption. Washing in a washing machine in a normal household requires energy for heating the washing water. Tumbler drying requires a lot of energy. Danish electricity is primarily based on burning coal, while space and water heating are often based on burning natural gas and oil.
Energy is generated when the T-shirt is incinerated, and this replaces fossil fuels. However, resources for the operation of the plant are consumed at the same time.
The main contributions in this phase are small. They originate from consumption of crude oil for production of diesel and petrol. In this case, we have assumed that the T-shirt is transported to the private household by car, but that other goods are bought at the same time.
Toxicological environmental impacts
Toxicological environmental impacts, analysed by the T-shirt's lifecycle phases are shown in figure 1.5.
Table 1.3 Source identification for individual toxicity categories
| Human toxicity | Ecotoxicity | Persistent toxicity | |
| Materials phase | Approx. 30 % of the total impact potential originates from this phase | 98 % of the total impact potential originates from this phase | Approx. 90 % of the total impact potential originates from this phase |
| Fiber production | Primarily from pesticides, emissions into the air. | Approx. 90 % of this phase's contribution originates from pesticides in cotton cultivation | Approx. 90 % of this phase's contribution originates from pesticides in cotton cultivation |
| Production phase | 5 % of the total impact potential can be attributed to this phase | In total, a negative contribution due to reuse potential for knitting and making-up | In total, a negative contribution due to reuse potential for knitting and making-up |
| Yarn manufacturing | Approx. 75 % of this phase's contribution is due to electricity consumption when spinning the yarn | Approx. 4 % of this phase's positive contribution is due to electricity consumption | Approx. 10 % of this phase's positive contribution to the impact potential is due to electricity consumption when spinning the yarn |
| Knitting | Credit of impact potential due to reuse options in this process | Credit of impact potential due to reuse options in this process | Credit of impact potential due to reuse options in this process |
| Pre-treatment | Approx. 5 % of this phase's positive contribution is due to electricity consumption | No significant contribution | 20 % of this phase's positive contribution originates from the washing agent used before the yarn is dyed |
| Dyeing | Approx. 8 % of this phase's positive contribution is due to electricity consumption | Dyeing represents 1 % of this phase's total positive contribution originating from the use of reactive dyes. | 2 % of this phase's positive contribution to the toxicity potential is due to the use of reactive dyes and electricity |
| Finishing | Approx. 5 % of this phase's positive contribution is due to electricity consumption | This process contributes with the largest ecotoxicity potential. 95 % of this phase's positive contribution is due to the softening process. | Approx. 65 % of this phase's positive contribution to the toxicity potential is due to the use of fabric softener. |
| Making-up | Credit of impact potential due to recycling options in this process | Credit of impact potentials due to recycling options in this process | Credit of impact potentials due to recycling options in this process |
| Use phase | Approx. 60 % of total contribution | Approx. 4 % of total contribution | Approx. 15 % of total contribution |
| Washing | Approx. 25 % of this phase's impact potential originates from the washing agent | Approx. 55 % of this phase's impact potential originates from the washing agent | 92 % of this phase's impact potential originates from the washing agent |
| Tumbler drying | Approx. 68 % of this phase's contribution is due to consumption of Danish electricity | Approx. 40 % of this phase's impact potential is due to electricity consumption for tumbler drying | Approx. 7 % of this phase's contribution is due to electricity consumption for tumbler drying |
| Ironing | Approx. 7 % of this phase's contribution is due to electricity consumption for ironing | Approx. 5 % of this phase's contribution is due to electricity consumption for ironing | Approx. 1 % of this phase's contribution is due to electricity consumption for ironing |
| Disposal phase | Negative contribution due to recovery of energy | Negative contribution due to recovery of energy | Negative contribution due to recovery of energy |
| Incineration | |||
| Transport phase | 4 % of total impact potential | No significant contribution | No significant contribution |
| Transport | From burning fossil fuels |
Description of the most significant observations
In the production phase, knitting and making-up are assumed to contribute with a reuse potential that can be credited to fibre production. This means that the production phase has a net negative contribution to ecotoxicity and persistent toxicity impact potentials. In the table, the positive contribution from the production phase has only been calculated and used as a total value. The contribution from the actual phase is calculated on the basis of the total potential, i.e. including the negative contribution.
The most significant factors in this calculation are the ecotoxicity and the persistent toxicity from cotton cultivation. The high impact potentials are due to the use of pesticides: herbicides, insecticides, fungicides, growth regulators and defoliation agents.
Detergents in washing agents result in contributions primarily to human toxicity and persistent toxicity. Moreover, there is a small contribution to ecotoxicity (primarily from alcohol ethoxylate). However, it is important to mention that the contributions from this phase are small compared to the contributions from fibre production.
Electricity generation also contributes to the toxicity categories. Mining operations release some undesired substances to the environment, such as strontium. The same applies for the drying process.
Environmental impacts related to energy
The potential environmental impacts related to energy from the T-shirt's lifecycle phases are distributed as shown in figure 1.6.
Table 1.4 Source identification for environmental impact potentials related to energy
| Greenhouse effect | Acidification | Nutrient loading | Photochemical ozone formation | ||
| Materials phase | 8 % of total contribution | 14 % of total contribution | 20 % of total contribution | 32 % of total consumption | |
| Fiber production | Originating primarily from burning fossil fuels and energy for production of N artificial fertilizer | Originating primarily from burning fossil fuels and energy for production of N artificial fertilizer | Originating from burning fossil fuels and energy for production of N artificial fertilizer | Originating from burning fossil fuels | |
| Production phase | 10 % of total contribution | 8 % of total contribution | 8 % of total contribution | 7 % of total contribution | |
| Yarn manufacturing | 60 % of this phase's contribution originates from electricity consumption in this process | 78 % of this phase's contribution originates from electricity consumption in this process | 71 % of this phase's contribution originates from …. | The main part, approx. 36 %, of this phase's contribution originates from unburnt fuels in connection with transport | |
| Knitting | 12 % of this phase's contribution is due to electricity consumption | 14 % of this phase's contribution is due to electricity consumption | 11 % of this phase's contribution is due to electricity consumption | Not significant | |
| Pre-treatment | 8 % of this phase's contribution is due to electricity consumption | 3 % of this phase's contribution is due to electricity consumption | 7 % of this phase's contribution is due to electricity consumption | 16 % of this phase's contribution is due to unburnt fuel in connection with transport | |
| Dyeing | 11 % of this phase's contribution is due to electricity consumption | 6 % of this phase's contribution is due to electricity consumption | 10 % of this phase's contribution is due to electricity consumption | 20 % of this phase's contribution is due to unburnt fuel in connection with transport | |
| Finishing | 9 % of this phase's contribution is due to electricity consumption | 4 % of this phase's contribution is due to electricity consumption | 8 % of this phase's contribution is due to electricity consumption | 18 % of this phase's contribution is due to unburnt fuel in connection with transport | |
| Making-up | Credit of minimal contribution due to assessed reuse potential | -4 % credit of contribution due to assessed reuse potential | -6 % credit of contribution due to assessed reuse potential | 10 % due to incomplete burning fossil fuels | |
| Use phase | 82 % of total contribution | 78 % of total contribution | 68 % of total contribution | 26 % of total contribution | |
| Washing (households) | 24 % of this phase's impact contribution originates from electricity consumption for heating water in the washing machine | 24 %, see greenhouse effect for explanation | 24 %, see greenhouse effect for explanation | 24 %, see greenhouse effect for explanation | |
| Tumbler drying | 68 % of this phase's impact potential is due to consumption of electricity for tumbler dryers | 68 % of this phase's impact potential is due to consumption of electricity for tumbler dryers | 68 % of this phase's impact potential is due to consumption of electricity for tumbler dryers | 68 % due to incomplete burning in connection with transport | |
| Ironing | 8 % of this phase's impact potential is due to the consumption of electricity for irons | 8 % of this phase's impact potential is due to the consumption of electricity for irons | 8 % of this phase's impact potential is due to the consumption of electricity for irons | 8 % due to incomplete burning in connection with electricity generation | |
| Disposal phase | Credit of impact potentials due to exploitation of energy from incineration, approx. -2 % of total | Credit of impact potentials due to exploitation of energy from incineration, approx. -1 % of total | Credit of impact potentials due to exploitation of energy from incineration, approx. -1 % of total | Approx. 1 % of this phase's total contribution originates from incineration of the T-shirt | |
| Incineration | |||||
| Transport phase | 2 % of total contribution | 2 % of total contribution | 4 % of total contribution | 34 % of total contribution | |
| Transport | Transport with diesel and petrol driven vehicles | Burning fossil fuels | Burning fossil fuels | Burning fossil fuels | |
Description of the most significant observations
Incomplete burning contributes to photochemical ozone formation, while burning fossil fuels generally contributes to all categories.
Burning fossil fuels for transport of the cotton fibres and electricity consumption in production of artificial fertilizer and pesticides are the main causes of the environmental impact contributions from this phase.
In this phase, electricity consumption again represents the main part of the impact potentials. Especially the yarn manufacturing process is energy-intensive.
The phase when the T-shirt is consumed is the absolute main contributor to the environmental impact potentials related to energy. This is caused by electricity for tumbler dryers, irons and heating water for washing machines. Energy consumption from production of washing agents has not been included. If this had been included, the contribution from this phase would have been even larger. This result indicates that the consumer has considerable influence on the T-shirt's overall environmental profile.
Waste
The waste category is most important in fibre production, yarn manufacturing and in the use phase processes, see figure 1.7. "Waste for landfilling" is actually a non-terminated interchange - it has not yet been possible to calculate these emissions satisfactorily, as the degree and effect of emissions from landfill are not sufficiently known for a model to be set up.
Table 1.5. Identification of the processes with the largest contributions to the four waste categories
| Bulky waste | Slag and ash | Radioactive waste | |
| Materials phase | 11% of total | 2% of total | 54% of total |
| Fiber production | Small contributions from many processes | Small contributions from many sub-processes | From European electricity generation |
| Production phase | 8% of total | 10% of total | 3% of total |
| Yarn manufacturing | 82 % of this phase's contribution originates from this process. Primarily from electricity generation | 80 % of this phase's contribution originates from this process. Primarily from incineration of waste cotton | 93 % of the positive contribution to this phase's radioactive waste due to imports of Swedish electricity generated at nuclear power stations |
| Knitting | 16 % of this phase's contribution originates from this process, primarily from electricity generation | 15 % of this phase's contribution originates from this process, primarily from incineration of waste cotton | Negative contribution to this phase's total volume of radioactive waste due to reuse and credit of European electricity from fibre production |
| Pre-treatment | 1 % of this phase's contribution originates from this process, primarily from electricity generation | 1 % of this phase's contribution originates from this process, primarily from electricity generation | 2 % of the positive contribution to this phase's radioactive waste due to imports of Swedish electricity generated at nuclear power stations |
| Dyeing | 5 % of this phase's contribution originates from this process, primarily from electricity generation | 3 % of this phase's contribution originates from this process, primarily from electricity generation | 3 % of the positive contribution to this phase's radioactive waste due to imports of Swedish electricity generated at nuclear power stations |
| Finishing | 1 % of this phase's contribution originates from this process, primarily from electricity generation | 2 % of this phase's contribution originates from this process, primarily from electricity generation | 2 % of the positive contribution to this phase's radioactive waste due to imports of Swedish electricity generated at nuclear power stations |
| Making-up | -5 % of this phase's contribution, credited due to reuse potential | -1 % of this phase's contribution, credited due to reuse potential | Negative contribution to this phase's total volume of radioactive waste due to reuse and credit of European electricity from fibre production |
| Use phase | 82 % of total, primarily from electricity generation. | 86 % of total, primarily from electricity generation. | 40 % of total, primarily from electricity generation. |
| Washing (households) | 24 % of this phase's contribution | 24% of this phase's contribution | 24% of this phase's contribution |
| Tumbler drying | 68% of this phase's contribution | 68% of this phase's contribution | 68% of this phase's contribution |
| Ironing | 8% of this phase's contribution | 8% of this phase's contribution | 8% of this phase's contribution |
| Disposal phase | -2% of total | 2% of total | 2% of total |
| Incineration | Credit of waste volume | Waste from the incineration plant | Waste from the incineration plant |
| Transport phase | No significant contribution | No significant contribution | No significant contribution |
| Transport |
Description of the most significant observations
The contributions to these impact categories are limited seen over the entire lifecycle of the T-shirt. The category "hazardous waste" is not commented on in the source identification, as the contributions were deemed so small that they do not influence the environmental profile of the T-shirt.
There is no primary source for the contributions in fibre production, except radioactive waste from the use of European electricity, where some electricity is generated at nuclear power stations.
This phase is the most significant in the waste statement. The large consumption of electricity for washing and drying results in higher contributions for the "bulky waste" and "slag and ash" categories. The radioactive contribution from use of Danish electricity is due to trading with Sweden, from/to which Denmark imports and exports electricity. Sweden generates some electricity at nuclear power stations.
When the T-shirt is incinerated, some bulky waste is converted to slag and ash. This is the reason for the negative contribution to this category.
What-if simulations
The environmental profile for a given product - in this case a T-shirt - can be affected by the choices made by the producer and by the consumer. In order to elucidate the consequences of possible changes in the product's lifecycle, a number of scenarios have been prepared that focus on the producer and consumer respectively.
By changing one or more of the reference conditions, it is possible to form a picture of the scope of the consequences based on the choices made by the producer and the consumer. Subsequently, the influence of the two groups on the final results can be assessed.
In the following, the scenarios will be assessed in relation to the producer reference and the consumer reference. The latter is identical to that in the main scenario.
Consequences of choices by the producer
The producer influences all processes from extraction of raw materials until the finished product leaves the distribution phase. To some extent, the producer can affect the processes in the use phase. However, it is not possible for the producer to affect all consumers of the product equally. In order to take this into account, a product reference has been prepared for the producer scenarios where only a limited part of the impacts from the use phase has been included.
For example, washing after use as defined in the functional unit, no use of fabric softener when washing in private households, and tumbler drying after every second wash. It is assumed that the T-shirt is drip-dried the remaining times.
The producer reference has been prepared in order to give producers a clearer picture of the influence of the production phase on the product's overall environmental profile in relation to an average use phase.
In connection with the use of a T-shirt, the following averages are assumed:
Washing after every time the T-shirt has been used for 1 day, as described in the functional unit, no use of fabric softener when washing in private households. The T-shirt is tumbler dried 50 per cent of washes. The remaining times it is assumed that the T-shirt is drip-dried on a clothesline. It is assumed that the T-shirt is ironed 10 per cent of the times it is washed.
Figure 1.8 The main scenario compared with the producer reference – for translation of Danish terms see glossary in annex 11
Figure 1.8 shows that the producer reference scenario has a 30 per cent lower consumption of primary energy per functional unit than the main scenario. This is due to lower consumption of electrical energy in the use phase. For the same reason, the environmental impacts related to energy are reduced by 10-30 per cent.
The resource consumption is 20-30 per cent lower in the producer reference due to the reduced impacts in the use phase. The environmental impacts related to chemicals are only reduced by just less than 1 per cent, which is because the most significant contributions to these impact categories originate from the cotton fibre production which is equal in the two scenarios.
In the following, the results of the scenarios are presented as summarised contributions over the entire lifecycle and compared with the producer reference scenario.
Scenarios – Producer
Choice of raw materials
Scenario 1: Choice of raw materials - organic cotton
Scenario 2: Choice of raw materials - halved cotton waste
Production phase
Scenario 3: Choice of chemicals - choice of reactive dyes
Scenario 4: Choice of chemicals - choice of fabric softener - 100% of fabric softener washed out in the use phase
Scenario 5: Choice of chemicals - use of fastness improver
The use phase
Scenario 6: Use phase - extended textile lifetime
Scenario 7: Use phase - colour staining
Influence of the consumer
Scenario 8: Influence of the consumer - no tumbler drying
Scenario 9: Influence of the consumer - non-iron T-shirt
Scenario 1: Choice of raw materials - organic cotton
The toxicological environmental impacts are the environmental impact potentials with the highest weight in the life of the T-shirt. This has been ascertained as primarily due to use of pesticides during cultivation of the cotton.
In order to assess the significance of the chemicals used in conventional cotton cultivation, the material is changed to organic cotton. Here the use of pesticides and artificial fertilizer disappears. A further benefit is that the transport required to spread these substances on the field also disappears. However, it should be added that organic farming does utilise mechanical weed control and requires transport to spread organic manure. Transport is not, however, included in either the main or the producer reference scenarios. Less transport reduces consumption of fossil fuels and is therefore also part of the energy-related environmental impacts. The element of pesticides washed out during bleaching in pre-treatment of organic production also disappears.
For conventional cotton cultivation about 18 g pesticides are used per kg cotton. The main scenario applies an estimated average from cotton cultivation in the US and South America. The impacts of pesticides on the environment have been assessed and the factors have been included in the database. Pesticide residues can cause toxic impacts in humans during further processing of the cotton fibres. These residues are assumed to be washed out of the cotton during wet treatment.
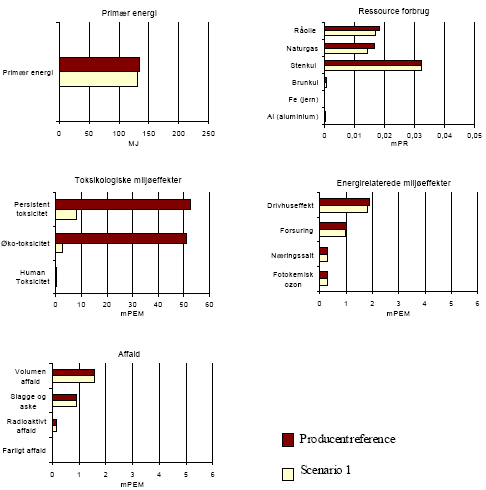
Figure 1.9 Result of scenario 1 - significant impact on chemical-related environmental impacts – for translation of Danish terms see glossary in annex 11
Consumption of primary energy does not change significantly, only by about 4 per cent over the total life of the T-shirt. This is because most of the energy consumption arises from processes in the production and use phases and these do not change in this scenario.
As shown in figure 1.9, the toxicological environmental impacts are reduced considerably using organically cultivated cotton. Persistent toxicity is reduced by 85 per cent, while ecotoxicity is reduced by 95 per cent compared with the reference scenario.
The energy-related environmental impacts, the greenhouse effect, nutrient loading, and photochemical ozone formation are reduced by 5-10 per cent. The reason is that there is no longer a contribution to these potentials from production of artificial fertilizer and pesticides. The same applies for the waste categories.
Conclusion to scenario 1 - organic cotton is recommended
It can be concluded that the producer has great possibilities to influence the overall environmental profile of the textile, especially the toxicological impact potentials. Use of organic cotton rather than conventionally cultivated cotton to the greatest possible extent can clearly be recommended. It should also be considered that many of the agents used during cultivation of cotton are harmful to human health. Incorrect or careless use could mean that suppliers expose themselves and their employees to health hazards. Pesticide residues washed out in several pre-treatment processes are yet another reason to avoid conventionally cultivated cotton.
Scenario 2: Choice of raw materials - halved cotton waste
Yarn production from cotton creates a lot of waste.
During manufacture of carded cotton there is about 15 per cent waste.
For combed cotton there is about 30 per cent waste (15 per cent from combing alone).
During manufacture of combed cotton, it is possible to use the fibre waste for lower quality yarn. In the producer reference it is assumed that the fibre waste is not recirculated, i.e. 30 per cent waste. Not much information is available to estimate the proportion of recyclable waste, but the potential does exist.
In this scenario waste is estimated as reduced to 15 per cent. The T-shirt is assumed to weigh the same as in the reference scenario.
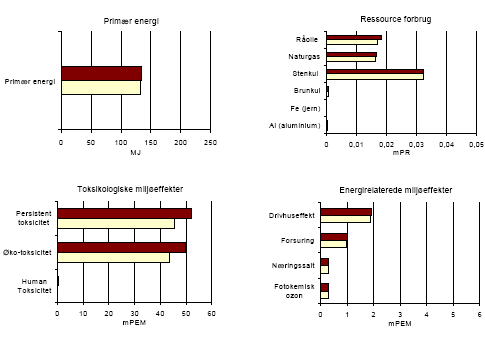
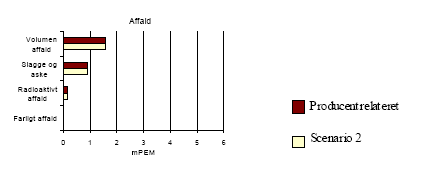
Figure 1.10 Result of scenario 2 - halved waste – for translation of Danish terms see glossary in annex 11
The reduction is because smaller quantities of cotton fibre are produced for manufacture of a single T-shirt. Because of the lower level of waste, less cotton is incinerated at incineration plants and therefore less energy is recovered in the yarn-manufacturing phase. The result of reduced waste is a reduction in total consumption of primary energy of 2 per cent compared with the producer reference. There is a corresponding reduction in consumption of crude oil (7 per cent) and natural gas (5 per cent), as well as in greenhouse gases (2 per cent).
The waste categories show a limited reduction in the volume of bulky waste and slag and ash of between 1 and 3 per cent. This reduction is also due to less consumption of fossil fuels. The change in the scenario does not affect the use of electricity in the production and use phases, which are the primary sources of the types of impact mentioned.
The toxicological environmental impact potentials in manufacture of fibres are reduced by 15 per cent because of the smaller quantity of cotton cultivated per T-shirt.
Conclusion to scenario 2 - reducing waste can be recommended
It can be concluded that the reduction in the toxicological environmental impact potentials is an important reason to focus on less waste in the production processes.
Of course this is not unambiguous, but depends partly on the state of the regional and local environment at the production location, availability of treatment plant and its effectiveness for primary pesticide residues. Minimising waste in all processes, not only waste of primary materials but also of auxiliary chemicals, energy etc. can often improve the environmental profile of the product and establish a basis for a more profitable production.
Scenario 3: Choice of raw materials - choice of reactive dyes
Dyes in the dyeing process add to the toxicological environmental impact potentials, although to a considerably smaller extent than pesticides and artificial fertilizer from cultivating conventional cotton. The database only includes equivalency factors for a single reactive dye "Reactive black 5", and the producer reference uses the dyes "Reactive dye 2 and 3", all allocated the same equivalency factors. Note that the limited knowledge on large parts of the dye range means that this assumption should not be regarded as representative for the whole group of dyes.
It is assumed that 85 per cent of the dye dose adsorbs to the textile, the rest is discharged with wastewater to a treatment plant. Of the amount of reactive dye discharged to the treatment plant, 90 per cent is discharged to the water and 10 per cent to soil, as the reactive dye adsorbs poorly in the sludge. The dyes primarily add to chronic ecotoxicity which affects the column for persistent toxicity. The producer reference is based on these assumptions.
The toxicological equivalency factors for the dyes are set as zero in this scenario to enable an assessment of the effect of the dyes on the total profile.
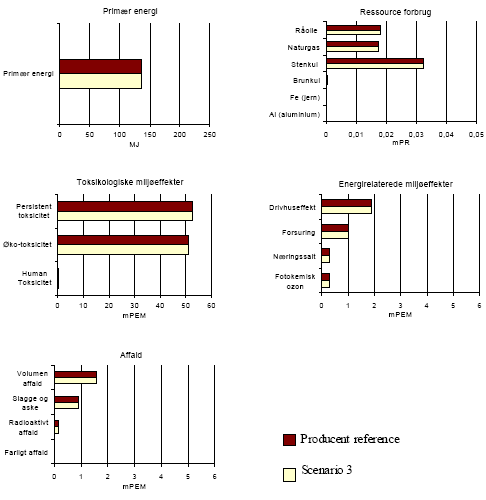
Figure 1.11 Result of scenario 3 - no significant consequences – for translation of Danish terms see glossary in annex 11
Figure 1.11 shows that there are no appreciable changes between the producer reference and scenario 3. The result shows that the dyes only have a minimal impact on the toxicity potentials compared with pesticides and artificial fertilizer.
Overall the toxicity potentials are reduced by less than 0.1 per cent. Note that only one reactive dye forms the basis for the contribution in the producer reference. In the dyeing process alone persistent toxicity is reduced by 60 per cent by removing the equivalency factors, while the ecotoxicity potential is slightly increased. The remaining contribution in the dyeing process comes primarily from consumption of electricity to heat the water.
Conclusion to scenario 3 - choice of reactive dyes, gather more knowledge
Therefore, it can be concluded that production should focus on acquiring knowledge on the dyes used and their impact and degradability in the environment. The factors in this tool can be used as standards of reference and can thereby form the basis for choosing more environmentally friendly reactive dyes. The consequences of the choice are limited, however, compared with the contributions to the toxicological environmental impact potentials from conventional cultivation of cotton. The producer should focus environmental efforts on reducing energy consumption, reducing consumption of pesticides during cultivation of cotton, minimising waste etc., rather that looking for new reactive dyes.
Scenario 4: Choice of raw materials - choice of fabric softener
This scenario illustrates the effect of choice of fabric softener as well as the significance of any washing out of the fabric softener in the use phase. The producer reference includes the most commonly used fabric softener in the model for the lifecycle of the T-shirt. This chemical is the most toxic of the two fabric softeners in the EDIP-TEX database. It is assumed that 85 per cent of the added amounts adsorbs to the textile and is not washed out in the use phase.
Attempts have been made to clarify the effects of washing out fabric softener in the use phase on the overall environmental profile.
- Therefore it is assumed that 100 per cent of the fabric softener is washed out in the use phase. This is illustrated in the figure below.
The producer is able to use fabric softeners of any toxicity.
- Therefore it is assumed that a less toxic chemical is used. Just as in the producer reference, it is assumed that 85 per cent of the substance added remains on the textile, and that none of the substance is washed out during the use phase.
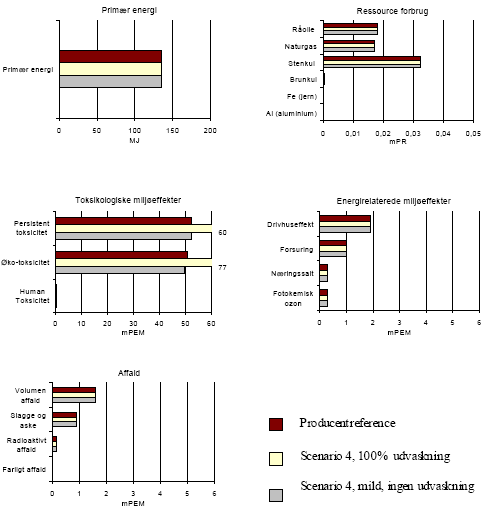
Figure 1.12 Result of scenario 4 – for translation of Danish terms see glossary in annex 11
The producer has several possibilities to change the softening process, which can be carried out using different techniques.
- Addition of fabric softener in a wet treatment process.
- Fabric softener can be sprayed on the woven or knitted textile through nozzles.
- Lengths of textile can be led through a bath containing fabric softener where the softener is exhausted or absorbed by the material.
- Mechanical softening of the textile lengths where the fibres are softened through repeated mechanical treatment.
Data for the manufacture of fabric softeners is not included, and therefore only the toxicological environmental impact potentials are changed as a result of the assumptions of this scenario.
Figure 1.12 shows that the greatest influence comes from the assumption of washing out in the use phase. Here, the contribution increases by 15 per cent for persistent toxicity and 50 per cent for ecotoxicity in the toxicological environmental impact potentials. The choice of a less toxic fabric softener has no great immediate impact because of the higher contribution to these categories from cotton cultivation.
Conclusion to scenario 4 - washing out in the use phase is very significant
It can be concluded that washing out during the use phase is most important for the overall result. This is particularly due to the assumption that 100 per cent of the amount of fabric softener added is discharged via the treatment plant to water and soil throughout the lifecycle of the T-shirt.
Choosing a less toxic fabric softener reduces the total contribution to the toxicological environmental impacts by about 2 per cent. The reduction may seem insignificant, but it has a great influence on the environmental profile of the product in the production phase. Legislation on ecolabelling indicates the substances that should be phased out, and those which should be avoided completely from an environmental perspective. This could be a guide for environmental work at the individual enterprise.
Scenario 5: Choice of raw materials - use of fastness improver
In order to achieve a better quality cotton T-shirt, the textile can be treated with fastness improvers in the same bath as the fabric softener. The fastness improver means that the coloured textile has a better wash fastness, i.e. the risk of staining other textiles is reduced and the product can resist more washes without changing its colour.
This scenario assumes that fastness improvers are used and 85 per cent adsorbs to the textile.
In order to illustrate the significance of this process, scenario 5 includes the rough assumption to allocate the fastness improver the same toxicity factors as the fabric softener in the producer reference, as no equivalency factors have been prepared specifically for fastness improver. It has not been possible to identify the chemical structure of the fastness improver, other than, like the fabric softener mentioned above, it may be a cation-active substance. It is assumed that 85 per cent of the amounts added adsorbs to the textile, while the rest is led through a treatment plant and discharged into the environment.
Figure 1.13 Result of scenario 5 - small changes in toxicological environmental impacts – for translation of Danish terms see glossary in annex 11
The results figure shows that there are only minimal changes over the whole lifecycle. Compared with the producer reference, the contribution to ecotoxicity increases by almost 2 per cent, while the contribution to persistent toxicity increases by almost 1 per cent. As in scenario 4, the contributions are overshadowed by the large environmental impact potentials from fibre manufacture. If the T-shirt were manufactured from organic cotton, the contribution from the fastness improver would seem more significant.
Conclusion to scenario 5 - less impact, no real picture
The conclusion to scenario 5 is that use of fastness improvers does not change the environmental profile of the T-shirt significantly. However, it should be noted that energy consumption in manufacture of the chemical has not been included in the calculations and therefore use of fastness improvers in industry will influence resource consumption and energy-related environmental impact potentials which are not illustrated here. For the production phase alone, the contribution from finishing to the toxicological environmental impact potentials is considerable, and therefore there should be focus on minimal use of these auxiliary chemicals.
Scenario 6: Influence of product quality - reduced lifetime
Product quality influences the lifetime of the product. Colour fastness, durability of the fibre and stitching are examples of areas on which the durability and quality of the product can be judged. In relation to lifecycle assessments, the quality of the product will be important for the manufacture and disposal phases, as these are extended/reduced in order to meet the functional unit.
Scenario 6 is based on halving the lifetime of the T-shirt compared with the producer reference. The assumption results in doubling fibre manufacture, production, disposal and transport as two T-shirts are now required to meet the functional unit.
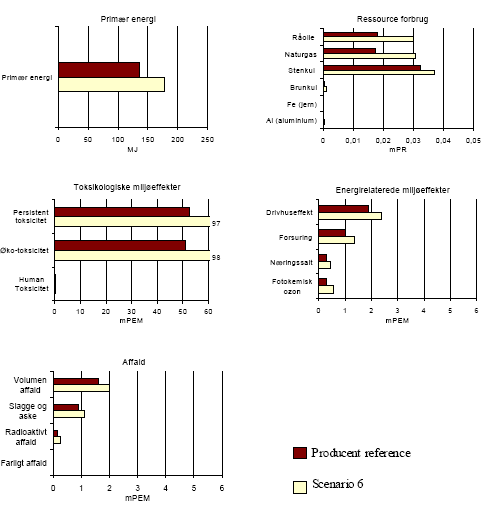
Figure 1.14 Result of scenario 6 - increase in all categories – for translation of Danish terms see glossary in annex 11
Results figure 1.14 shows that, over the whole lifecycle, lifetime is important. The consumption of primary energy increases by approx. 30 %. Resource consumption is increased correspondingly, crude oil by 66 per cent, natural gas by 76 per cent, and coal by 11 per cent. This is due to increased consumption of electricity for production of the extra T-shirt. The contribution to the energy-related environmental impacts as a consequence of this increases by about 26 - 86 per cent.
The waste categories increase by about 30 per cent for the same reasons.
Similarly, the toxicological environmental impact potentials are increased by 40 per cent, and again the determining factor in this context is the increased production of cotton.
Conclusion to scenario 6 - the lifetime of the T-shirt is significant for the overall environmental profile
The conclusion to this scenario is that the quality of the T-shirt is an important focus point for the producer, as it is decisive for the overall environmental profile, in particular with regard to consumption of primary energy and thus fossil fuels and the energy-related environmental impacts.
The toxicological environmental impacts also increase considerably with double the consumption of cotton per functional unit. One possibility to improve the environmental profile, despite reduced lifetime is organised reuse of the material.
The lifetime of the textile is not only determined by the producer, the consumer also has a great influence on this parameter. Consequences related to the consumer patterns are described in scenarios 10 - 18.
Scenario 7: Influence of product quality - colour staining
The quality of the dyeing, colour fastness, is important for the quality consumers perceive in the product.
This scenario illustrates the impacts on the overall environmental profile of the T-shirt if an entire machine wash becomes unusable because the colour comes out of the T-shirt once in its lifetime. It is assumed that the wash weighs 5 kg, the material is cotton, and that all the clothes become unusable because of staining.
18 cotton T-shirts are ruined because of discolouring. The simulation is carried out by assuming that the wash is composed of 20 cotton T-shirts, each weighing 250 g.
Therefore 20 T-shirts corresponding to the reference must be produced, transported and disposed of. The use phase of the spoiled textiles is not included in the calculations.
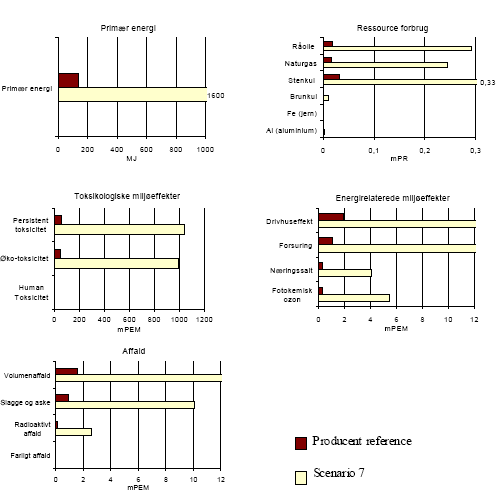
Figure 1.15 Result of scenario 7 - significant changes – for translation of Danish terms see glossary in annex 11
The graphs show that production of the 18 T-shirts causes an increase in consumption of primary energy of 1200 per cent. The same trend is apparent for the remaining environmental impact categories.
Conclusion to scenario 7 - the significance of the use phase is reduced by discolouration
The scenario indicates that the use phase of the individual T-shirts, otherwise dominant for the majority of the impact categories, is now overshadowed by production of the textile (T-shirts), corresponding to 4.5 kg in total. Therefore it is important for the producer to manufacture textile clothing with high colour fastness or at least inform customers of the risk of colour staining during washing, so that the consumer can take precautions and wash the textile separately at first.
Scenario 8: Influence of the use phase - no tumbler drying
Reduction of the dominance of the use phase - quick-drying textiles. The use phase has a great influence on the overall environmental profile of the T-shirt. Therefore, it is desirable that the producer improve the properties of the product to reduce the environmental impacts in this phase. As can be seen in the producer reference, electricity consumption has most significance, more specifically in the drying process. The producer reference assumes that the T-shirt is dried in a tumbler dryer for half of the washes.
This scenario assumes that the T-shirt is always hung up to dry on a clothesline and drip-dried. Emissions into the air from this process have not been included. The model simulates the change by setting the drying process at zero.
The possibilities for the producer to influence the drying method chosen by the consumer could include processing, weaving, or knitting the textile so that the textile retains less water after centrifuging in the washing machine. This will reduce the need for drying and more consumers will probably drip-dry the product.

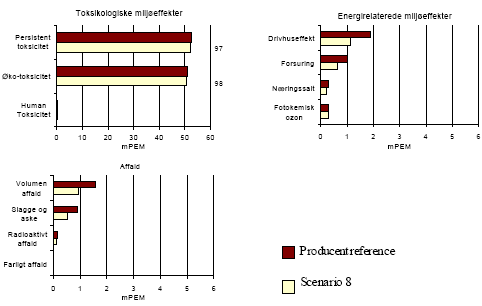
Figure 1.16 Result of scenario 8 - large changes – for translation of Danish terms see glossary in annex 11
Figure 1.16 shows that drying in a tumbler dryer has a great influence on the overall consumption of primary energy, and this is reduced by almost 40 per cent. Consumption of resources is also reduced, consumption of crude oil by approx. 20 per cent, natural gas by approx. 15 per cent, and coal by about 50 per cent.
Eliminating drying in a tumbler dryer results in significantly less consumption of Danish electricity. Danish electricity is primarily produced at coal-fired power plants, and therefore consumption of coal is reduced more than crude oil and natural gas. The energy-related environmental impacts are correspondingly reduced.
The toxicological environmental impact potentials are reduced by just less than 1 per cent, which indicates that electricity consumption does not contribute significantly to this impact category.
Conclusion to scenario 8 - reducing drying needs has a positive impact on the environmental profile
It can be concluded that drying in a tumbler dryer during the use phase has a great influence on the overall environmental profile. It would therefore be an advantage if the producer processed the textile so that water is easier to centrifuge out of the T-shirt. It is necessary to consider the impact of any extra pre-treatment process in relation to savings in the use phase. Another knitting method or surface treatment will require energy, consumption of resources and add to the environmental impacts.
Scenario 9: Influence of the use phase - non-iron T-shirt
This scenario illustrates the significance of ironing in the use phase. The producer reference assumes that the T-shirt is ironed after every 10 washes, i.e. 5 times per lifetime. Assuming that the T-shirt is never ironed illustrates the impact of this process on the overall statement for the product. The model sets the "ironing" process in the use phase at zero.
The producer can influence the need to iron the T-shirt by pre-treating the textile so that it does not require ironing after washing. Here, it is important to study the process chosen for smoothing the fibre and compare it with the impact of ironing on the environment. This will avoid substituting the ironing process with something more harmful to the environment than electricity consumption during ironing. This is auxiliary chemicals, electricity consumption to operate the process or similar. Another consideration is that, even though the producer treats the textile so that it no longer creases, there will still be users of the T-shirt who iron it.
Therefore the scenario is not considered as an indication of the significance of ironing as a process.
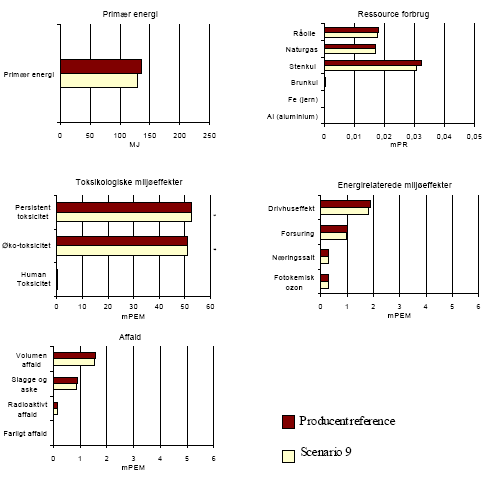
Figure 1.17 Result of scenario 9 – for translation of Danish terms see glossary in annex 11
Figure 1.17 shows that eliminating ironing results in less electricity consumption. The environmental impacts affected by this are consumption of primary energy and thus fossil fuels, contributions to environmental impacts related to energy and waste categories. The total consumption of primary energy is reduced by 5 per cent. The contributions to the environmental impacts related to energy are also reduced by about 5 per cent.
The toxicological environmental impacts are reduced by less than 0.1 per cent and therefore assumed as unchanged.
Conclusion to scenario 9 - ironing has an impact on the overall environmental profile
It can be concluded that all processes consuming electricity, which can be minimised or replaced, have a positive influence on the environmental profile of the product. The producer reference assumes that the T-shirt is ironed after 10 per cent of washes. This is realistic for a normal T-shirt, but for other types of cotton clothing, where the ironing requirement is 100 per cent, minimised need for ironing will have a greater impact. Again, any new process will have to be assessed for environmental impacts in order to determine its contribution to the environmental impact potentials. The producer has an indirect possibility to make the consumption pattern more environmentally friendly by removing general annoyance factors such as creased textiles.
Consequences of choices by the consumer
The consumer reference is based on the main scenario for the lifecycle of 1 T-shirt. The assumptions for the model are described in the Background Data section at the end of this annex.
The consumer is primarily able to influence the use phase and parts of the transport phase. The other phases can primarily be influenced by the producer. Secondly, the consumer is able to choose producer selectively through, e.g. ecolabel schemes, which can ensure an environmentally correct choice.
The use phase includes washes with prewash and at 60°C, 100 per cent drying, and 100 per cent ironing. Transport home by car from the shop is included, and the impact is spread over 6 kg goods per T-shirt.
Scenarios - consumer
Scenario 10: Choice of wash - halving wash frequency
Scenario 11: Choice of wash - reduced washing temperature from 60 °C to 40 °C and no prewash
Scenario 12: Choice of wash - use of fabric softener
Ironing and drying
Scenario 13: No use of tumbler dryer
Scenario 14: No ironing
Transport home
Scenario 15: Transport home - car with shopping
Optimised use phase
Scenario 16: Half the number of washes, no drying in tumbler dryer and 10 per cent ironing
- incl. lifetime
Scenario 17: Half the number of washes, no drying in tumbler dryer and 10 per cent ironing and twice as long lifetime
- the green consumer's T-shirt
Scenario 18: Half the number of washes, no drying in tumbler dryer and 10 per cent ironing, produced in organic cotton.
Scenario 10: Choice of wash - halving wash frequency
In the functional unit the T-shirt is deemed to be washed after use for 1 day with a lifetime corresponding to 50 washes. The consumer can influence this parameter. This involves consumer habits and consumption patterns. This scenario is to show how much consumer habits influence the overall environmental profile. The following assumes that the T-shirt is washed after being used twice, i.e. half as many washes in private households, resulting in half as many dryings in a tumbler dryer and ironing compared to the consumer-reference scenario. The changes are expected to influence environmental impacts related to energy, resource consumption, as well as toxicological impact types, where use of washing agent has an impact.
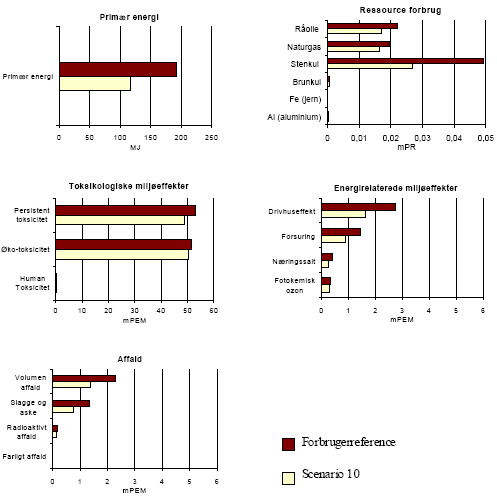
Figure 1.18 Result of scenario 10 - great consumer influence – for translation of Danish terms see glossary in annex 11
Consumption of primary energy is reduced by 40 per cent as a result of lower electricity consumption, primarily for drying. With regard to resources, consumption of fossil fuels is also reduced. The largest reduction is consumption of coal (about 50 per cent), as shown in figure 1.18. Furthermore the environmental impacts related to energy are reduced by 30 - 40 per cent because of the 50 per cent reduction in use of electricity. As a result of the lower number of washes and consequent lower use of washing agent, there is a slight reduction in the toxicological environmental impacts.
Conclusion to scenario 10
The conclusion to this scenario is that the consumer has a large influence on the overall environmental profile of the T-shirt. A lower number of washes saves the environment from a number of impacts and also increases the lifetime of the T-shirt, provided the assumption that the number of washes wears out the T-shirt is correct. The increased lifetime is not taken into account. This would mean a reduction in the environmental impacts in the manufacturing and production phase.
Scenario 11: Choice of wash - lower wash temperature and no prewash
An important parameter in the use phase is the temperature of the water in the washing process and the choice of programme with or without prewash. The effectiveness of modern washing machines can mean that temperature and prewash do not affect the quality of the wash.
In this scenario the household wash in the use phase is done at 40 °C and without a prewash. It is assumed that the wash programme does not affect the quality of the wash, i.e. the wash process is identical for the two wash programmes being compared.
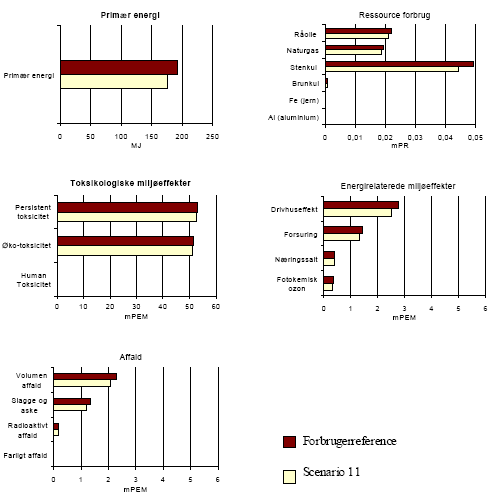
Figure 1.19 Result of scenario 11 – for translation of Danish terms see glossary in annex 11
Figure 1.19 shows a moderate influence on the overall environmental profile compared with the reference scenario. The lower consumption of primary energy is due to lower energy consumption to heat water and for the extra prewash. The same applies for resource consumption, waste and environmental impacts related to energy. The profile is unchanged for chemical-related environmental impacts.
Conclusion to scenario 11
There is no great reduction in the overall environmental profile from reducing wash temperature and skipping the prewash. However, it can be concluded that the consumer can influence the environmental profile through choice of wash procedure. And from a larger perspective the consumer can save the environment from considerable impacts by thinking about how washing is done.
Scenario 12: Choice of wash - use of fabric softener
Fabric softener is primarily used in the production phase, which uses large amounts after dyeing to achieve the quality required for further processing. Moreover, fabric softener is used in many homes as part of an ordinary machine wash.
Consumer surveys show that 60 per cent of the Danish population use fabric softener (Madsen, 1995). Fabric softeners in households are not the same as those used by industry, so it is not possible to compare the two processes directly. This scenario has been prepared in order to demonstrate the use of fabric softeners in the home.
It is assumed that 3 g of active substance are used per wash. This dosage is different from product to product, but is based on an average. Therefore it is also assumed that the consumer uses the recommended dose. The database does not include production of the fabric softener, packaging or transport home. Therefore the only difference is that the toxicological environmental impacts are increased.
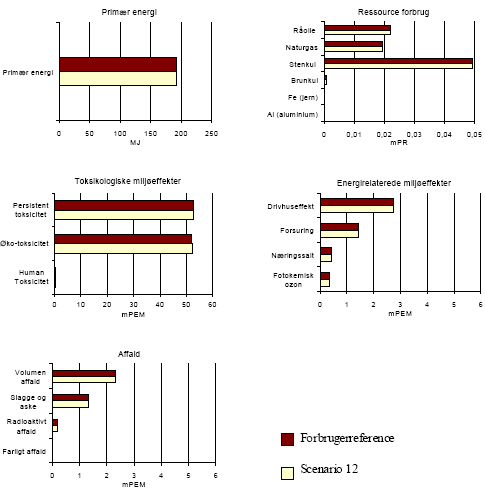
Figure 1.20 Result of scenario 12 – for translation of Danish terms see glossary in annex 11
The largest increase is for ecotoxicity, which is increased by about 0.4 per cent. There is almost no change in persistent toxicity at only 0.1 per cent. Human toxicity is unchanged compared with the consumer reference scenario.
Conclusion to scenario 12
The conclusion to this scenario is that fabric softeners used in household washes affect the overall environmental profile of a T-shirt when toxicological environmental impacts are looked at in isolation. The impact is greatest if the material is organic. Furthermore, if overdoses are applied there will be greater consequences for the environmental profile and thus even greater toxicological environmental impacts. This scenario can also give a signal to the producer to improve the product so that it is not necessary to use softener.
Scenario 13: No tumbler drying
Drying in the home can primarily use two methods. Drip drying on a clothesline or use of tumbler dryer. Often simple factors such a space, time, and economics determine the method used. The clothesline requires more space and can be time demanding in some seasons (if clothes dry outdoors), but it is more or less cost free. Tumbler drying does not require much space and has a constant and short drying time, but it requires electricity consumption.
This scenario ignores any wear on the T-shirt from using a tumbler dryer. The reference scenario is based on the T-shirt being tumbler dried after washing. In this scenario drying in a tumbler dryer is excluded. The scenario is to show the consequences of choosing to tumbler dry on the overall environmental profile.
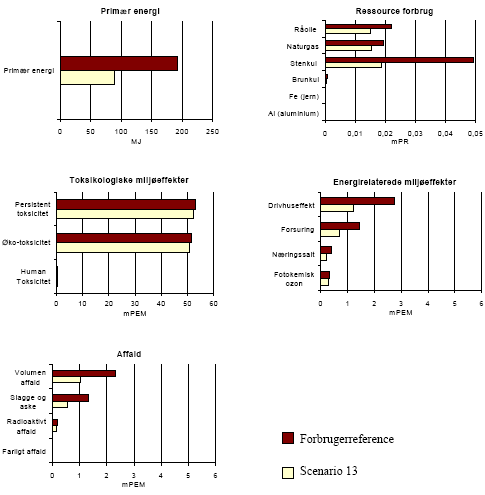
Figure 1.21 Result of scenario 13 – for translation of Danish terms see glossary in annex 11
Consumption if primary energy is reduced by 50 per cent as a result of lower electricity consumption. With regard to resources, consumption of fossil fuels is also reduced. The greatest reduction, as shown in figure 1.21, is consumption of coal, by approx. 60 per cent. Furthermore most of the impact potentials in the environmental impacts related to energy are reduced by 40-50 per cent because of lower consumption of electricity. There are only slight changes in the toxicological environmental impacts.
Conclusion to scenario 13
The conclusion to this scenario is that, just as in scenario 10, the consumer's consumption patterns have a great influence on the overall environmental profile of the T-shirt. Drying in a tumbler dryer is very detrimental to the environmental profile, reductions of up to 40-60 per cent can be achieved in a number of impacts by not drying in a tumbler dryer.
Large electricity consumption results in high consumption of resources and gives many environmental impacts related to energy. By not tumbler drying it is also possible that the lifetime of the product will increase as tumbler drying wears the product. No account is taken of extended lifetime in this case. Extended lifetime will mean a reduction in the environmental impacts in the manufacturing and production phases.
Scenario 14: No ironing
Ironing is the final step in the use phase before use. It is hard to say exactly how often a T-shirt is ironed as this depends on the individual consumption pattern. In order to get an impression of the significance of the process for the overall profile, this scenario assumes that the product is not ironed after washing and drying. This is a considerable reduction compared with the reference scenario, which assumes ironing after each wash and drying.
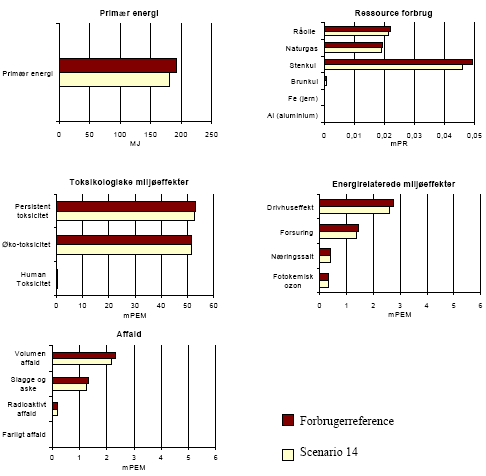
Figure 1.22 Result of scenario 14 - minimal consequences – for translation of Danish terms see glossary in annex 11
Figure 1.22 shows that ironing only has a slight impact on the environmental profile. There is a slight reduction of 2-6 per cent in primary energy, resources, and in almost all impact categories corresponding to the energy consumption in ironing. Only the toxicological environmental impacts are unchanged compared with the reference scenario.
Conclusion to scenario 14
Whether or not the T-shirt is ironed has no great impact on the overall environmental profile. There are other, more important processes in the use phase with greater influence, as shown in some of the other scenarios.
The reduction achieved by reducing ironing frequency could be seen in another light, if at first the contributions to the overall profile from the other processes are reduced. Then the impacts of leaving out the ironing process will comprise a greater proportion.
Scenario 15: Transport home - car with shopping
Transport in the use phase can vary from a trip on a bike, to public transport to transport in a private motorised vehicle. Moreover, transport from the shop to the home can be with or without other shopping. It is assumed that transport is in a petrol-powered car. If transport is with other products, the trip must be divided between these. The reference scenario assumes total shopping of 6 kg, of which the T-shirt comprises 250 g. The distance driven is estimated at 10 km with petrol consumption of 12 km per litre. In order to simplify the influence of transport to the home on the environmental profile, this scenario does not allocate the impacts to other products in transport home. I.e. the entire petrol consumption for transport home from the shop is allocated to the T-shirt.
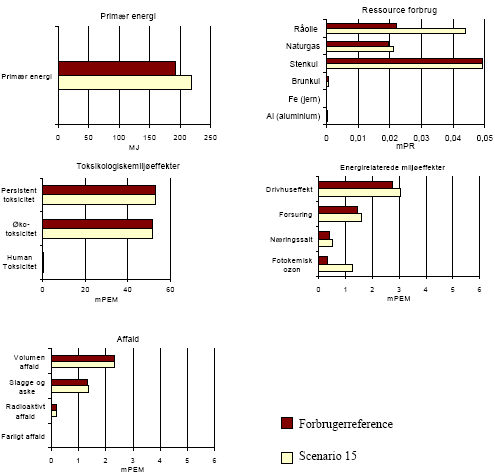
Figure 1.23 Result of scenario 15 – for translation of Danish terms see glossary in annex 11
The change in mode of transport home, as shown in figure 1.23, means an increase in consumption of primary energy corresponding to approx. 12 per cent. This is due to extra consumption of crude oil of about 50 per cent to produce the petrol (see the figure). Combustion of petrol by the engine means that there is a slight increase in the environmental impacts related to energy. The largest increase is photochemical ozone, which increases by 65 per cent.
Conclusion to scenario 15
This scenario shows that the consumer can influence consumption of crude oil and the resulting impact potential considerably in the choice of transport means and planning shopping. Shopping for one item alone is very detrimental to the overall environmental profile. By coordinating shopping, the consumer can reduce total transport use.
Optimised use phase scenarios
The three following scenarios attempt to illustrate the various optimised use phases. Scenarios 16-18 are set up at three levels of optimisation. Scenario 16 contains optimised washing processes, scenario 17 involves lifetime, and finally scenario 18 shows the consequence of including organic cotton.
Scenario 16: Optimised use phase - half the number of washes, no tumbler drying, 10 per cent ironing
By combining the previous scenarios, a consumption pattern is modelled including a T-shirt which is washed 25 times, dried without using a tumbler dryer and ironed 10 per cent of the time.
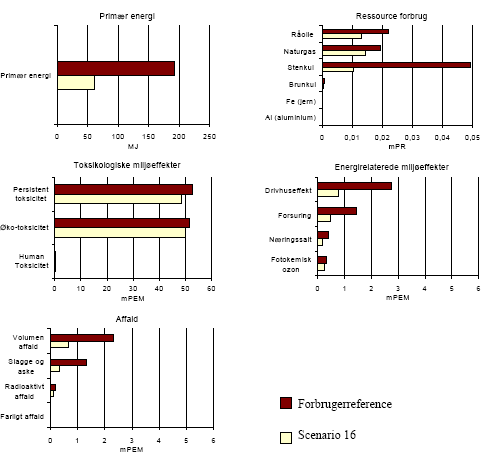
Figure 1.24 Result of scenario 16 – for translation of Danish terms see glossary in annex 11
As for scenarios 10 and 13, the large reduction in consumption of primary energy is because the tumbler dryer is not used in the use phase. Compared with the reference scenario the reduction in primary energy is 70 per cent. This large energy reduction leads to a corresponding drop in resource consumption, primarily comprising coal to generate Danish electricity. The environmental impacts related to energy and the waste categories are therefore also reduced because of lower energy consumption. There is no significant reduction in toxicological impacts.
Conclusion to scenario 16
The first optimised use phase scenario shows that the consumer can relatively easily influence the lifecycle profile of a T-shirt by washing less frequently and not using a tumbler dryer. Scenario 14 showed that ironing had more or less no influence on the environmental profile, but by combining less ironing with less use of the tumbler dryer and less washes, an overall larger environmental benefit can be achieved.
Scenario 17: Optimised use phase - half the number of washes, no drying in a tumbler dryer, 10 per cent ironing and double lifetime
This scenario is a further development of scenario 16.
It is assumed that halving the number of washes and better product quality gives a longer product life of 2 years. In relation to the functional unit and the reference scenario, this means that in 1 year, half a T-shirt is worn out. This means that for each year only half the amount of material is required and only half a T-shirt needs to be produced, transported and disposed of. On the assumption of extended lifetime, the result is as in figure 1.25.
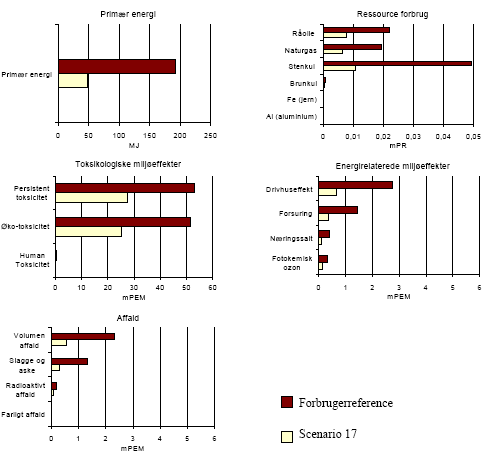
Figure 1.25 Result of scenario 17 – for translation of Danish terms see glossary in annex 11
There is a considerable reduction in consumption of primary energy of about 75 per cent, and similar reductions in consumption of resources and environmental impacts related to energy. The reduction is primarily because a tumbler dryer is not used and there are fewer washes in the use phase. Because materials, production, transport and disposal of a T-shirt are spread over 2 years, the phases' contributions are reduced by 50 per cent. This halving also means a 50 per cent reduction in the toxicological environmental impacts. This is primarily because the toxicological environmental impacts come from the material phase, where many pesticides are used in cotton cultivation.
Conclusion to scenario 17
This scenario shows that by combining product improvements and consumption patterns, significant environmental benefits can be achieved. In this scenario all impacts and parameters are reduced by at least 50 per cent compared with the reference scenario.
Scenario 18: Optimised use phase - half the number of washes, no drying in a tumbler dryer, 10 per cent ironing, double lifetime and produced in organic cotton
This scenario is identical to the previous scenario 17, with the addition that material made of organic cotton is used.
An environmentally correct consumption pattern, combined with use of organic materials in the materials phase. The green T-shirt.
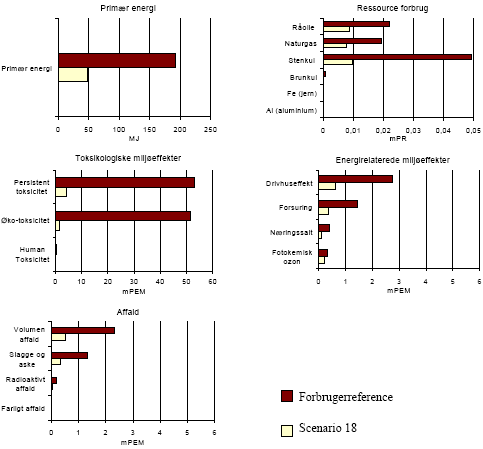
Figure 1.26 Result of scenario 18 – for translation of Danish terms see glossary in annex 11
Figure 1.26 shows the environmental profile for the green T-shirt. The picture is more or less the same as in scenario 17 for primary energy, resources and the environmental impacts related to energy. For toxicological environmental impacts, a total reduction of 93-97 per cent is achieved. This is primarily due to use of organic cotton and extended lifetime. Today, large amounts of pesticides are used in conventional cotton production in order to ensure large yields. Scenario 1 shows the consequences of using organic cotton in isolation.
Conclusion to scenario 18
Scenario 18 shows the result of taking the right environmental decisions throughout the whole lifecycle. There is at least a 70 per cent reduction is all categories compared with the reference scenario. The conclusion is that the consumer has the greatest influence on the environmental profile of a T-shirt – first by choosing an organic product and then considering the environment in the use phase by washing as little as possible, drip drying and not ironing. The producer can help here by manufacturing non-iron textiles with lower drying requirements (scenario 8) and mechanical softening after dyeing.
Considerations regarding disposal
There is no scenario dealing with the disposal process because the T-shirt is expected to be disposed of with household refuse in Denmark. It is assumed that old T-shirts are relatively rarely sent to recycling stations or the Third World, as old cotton T-shirts are often used as dusters or similar before being thrown away. If the T-shirt is sent to the Third World, it will probably be very worn before being disposed of at a landfill or burnt. Both processes recover no energy and the total contribution to the lifecycle of the T-shirt therefore changes. Only the consumer can influence this choice and thus influence the total consumption of primary energy.
Background data
System structure in the EDIPTEX database for the T-shirt
| Ref. no.: EDIPTEX database | |
| 1 T-shirt (cotton) 1 materials phase: 0.4 kg cotton fibre (incl. cultivation and harvest) 1 production phase: 0.2727 kg bleach H2O2 (knitted cotton) 0.28 kg yarn manufacture (cotton yarn) 0.275 kg T-shirt knitting 0.2727 reactive dyeing (3%) of cotton goods 0.27 kg drying final fixing + set of m² weight 0.27 kg softening cotton textile 1.773 m² fabric inspection + rolling onto cardboard roll 1 cutting and stitching 1 packing 1 use phase: 12.5 kg household wash, 60 °C, with prewash 12.5 kg tumbler drying cotton (vented), cupboard dry 150 min. Ironing cotton or other cellulose 1 disposal phase: 0.25 kg waste incineration of cotton 1 transport phase: 0.07 kg petrol combusted in petrol engine 800 kg km container ship 2-t. 28000DWT, terminated 66.8 kg km lorry > 16 t diesel out-of-town, terminated 66.8 kg km lorry > 16 t diesel urban traffic, terminated 66.8 kg km lorry > 16 t diesel motorway, terminated |
(TX0-02) (TX6-1-04) (TX1-01-1) (TX6-2-11) (TX24-1-03) (TX21-1) (TX22-1-02) (TX25-01-01) (TX27-3-06) (TX6-2-16) (TX27-3-08-06) (TX28-1-02) (TX28-2-03-02) (TX33-1-202) (TX33-3-01) (TX33-3-01) (TX6-4-02) (TX41-1-01) (TX6-5-02) (E32751) (O3715T98) (O32694T98) (O32695T98) (O32693T98) |
Details of the T-shirt model in the EDIPTEX database
Assumptions:
- 100 per cent cotton
- Dye: reactive dye
- Washing 40°C, possibly 60°C
- Tumbler drying
- Ironing not necessary (but done by many)
- Lifetime: 50 washes.
- Weight: Three different qualities of T-shirt have been weighed: 178 g ("thin" quality), 223 g and 292 g (heavy quality). For this environmental assessment, the assumption is that the T-shirt weighs 250 g.
Functional unit
The calculations are for "1 T-shirt".
This needs to be converted in relation to lifetime, and the calculations need to be converted to "per year".
It is assumed that the T-shirt can be washed 50 times before it is discarded.
It is assumed that the consumer wears the T-shirt 50 days per year.
It is assumed that the T-shirt is used for 1 day and is then washed.
Any need for a sweatshirt over the T-shirt to keep warm on some days has not been included.
If the T-shirt is washed after each use, 50 days' use of the T-shirt means that 1 T-shirt is completely used up in one year - or more likely - that a person has 5 T-shirts that together last 5 years.
The functional unit for a T-shirt is therefore:
"50 days' use of T-shirts washed each time after use".
It is assumed that 50 days correspond to the number of days a consumer wears a T-shirt over the course of 1 year. Some consumers have an entirely different consumption of T-shirts. Some people wear a T-shirt every day (often men), while other people do not own a single T-shirt (e.g. women in the age of 60-80).
For the reference scenario this corresponds to 1 T-shirt being completely worn out (in that it is assumed that the T-shirt is washed after use for 1 day).
Note: There are also calculations of the significance of the consumer using the T-shirt twice before each wash, even though this means that the consumer must compromise quality requirements for cleanliness. This calculation has another functional unit than the above and therefore there are reservations regarding comparisons.
Disposal:
It is assumed that the T-shirt is sold in Denmark and disposed of through waste incineration. 0.25 kg cotton.
Household wash:
It is assumed that the T-shirt can be washed 50 times in its lifetime. This means that 0.25 kg *50 = 12.5 kg cotton must be washed in the lifetime of the T-shirt.
Drying:
It is assumed that the T-shirt is dried in a tumbler dryer. 12.5 kg cotton.
Ironing:
It is not necessary to iron a T-shirt. Many do so anyway. Ironing is therefore included as a "case". The calculations assume it takes 3 minutes to iron a T-shirt (1 minute each side and 1 minute to heat up the iron). If the T-shirt is ironed after each wash, this is 3 minutes * 50 = 150 minutes.
Packing the T-shirt:
It is assumed that the T-shirt is packed in a thin plastic bag. It is assumed the bag weighs 10g.
Laying out, cutting and sewing the T-shirt:
There is no company data for a T-shirt. A new process has been set up: Laying out, cutting and sewing the T-shirt. TX28-1-02. The process is calculated "per T-shirt". It is assumed that energy consumption is the same as for a tablecloth (for which there is company data).
According to Laursen et al. 1997, waste is 6-25 per cent. For a T-shirt it is assumed that waste is 6 per cent as a T-shirt is one of the simplest garments for cutting and sewing. This means 0.25 kg / (1-0.06) = 0.266 kg textile must be used. It is assumed that the waste is discarded (incinerated at a waste incineration plant).
Fabric - inspection and rolling onto a cardboard roll
There is no company data for knitted fabric for a T-shirt. It is assumed that data is the same as for woven fabric for a tablecloth. Therefore process no. TX27-3-08-06 is used. Amount: see previous process: 0.266 kg approved textile after the fabric inspection.
Fabric inspection uses 1.015 kg textile per kg approved textile after the fabric inspection. Therefore 0.270 kg textile must be produced (dried and fixed).
Drying, final fixing and setting square-metre weight:
As mentioned above, 0.270 kg textile must be used per T-shirt. This corresponds to 1.8 m² textile (dried and fixed) per T-shirt weighing 150 g per m².
As there is waste in drying and final fixing, 1010 g dyed fabric per kg dried fabric are used. This means 1.01 * 0.270 kg = 0.2727 kg reactive-dyed textile must be used.
Reactive dyeing (3%) cotton goods:
0.2727 kg is used by this process per T-shirt. There is no waste of textile in this process.
Bleaching with H2O2 (knitted cotton):
0.2727 kg is used by this process per T-shirt.
There is waste in the process, and therefore 1010 g knitted textile must be used per kg bleached textile. Therefore 0.275 kg knitted textile must be used per T-shirt.
Knitting:
0.275 kg textile must be knitted per T-shirt.
1.015 kg yarn is used per kg circular-knitted textile. Therefore 0.280 kg yarn is used per T-shirt.
Yarn manufacturing:
0.280 kg yarn must be used per T-shirt. 1.43 kg cotton fibre is used per kg cotton yarn. Therefore 0.40 kg cotton yarn is used for one T-shirt.
Cotton fibre:
0.40 kg cotton fibre is used for one T-shirt.
Transport:
All transport distances are estimated. See table below.
| Transport | Quantity for one T-shirt | Kg km |
| Transport of cotton | 0.40 kg transported 2000 km by ship | 800 kg km by ship |
| Transport af yarn | 0.28 kg transported 200 km by lorry | 56 kg km by lorry |
| Transport of knitted fabric | 0.275 kg transported 200 km by lorry | 55 kg km by lorry |
| Transport of dyed fabric | 0.27 kg transported 100 km by lorry | 27 kg km by lorry |
| Transport from factory to shop, lorry | 0.25 kg transported 200 km by lorry | 50 kg by lorry |
| Transport of discarded T-shirt (with household refuse) | 0.25 kg transported 50 km by lorry | 12,5 kg by lorry |
Lorry, total: 200 kg km (assumed 33 per cent urban, 33 per cent out-of-town, 33 per cent motorway).
Consumer transport: It is assumed that the consumer drives in town by car to buy 1 T-shirt and 2 kg other goods. It is assumed the consumer drives 10 km and the car goes 12 km per litre. This means 0.83 l petrol is used (= 0.61 kg petrol, as petrol weighs 0.73 kg per litre). Of this, 0.61 * 0.25/2.25 is allocated to the T-shirt, i.e. 0.07 kg petrol.
I.e. total transport:
| Process no. in EDIPTEX database | Name of process | Transport need |
| O32715T98 | Container ship, 2-t, 28000 DWT, TERMINATED | 800 kg km by ship |
| O32695T98 | Lastbil >16t, diesel urban traffic TERMINATED | 66,8 kg km by lorry |
| O32694T98 | Lastbil >16t diesel out of town landev.TERMINATED | 66,8 kg km by lorry |
| O32693T98 | Lastbil, >16t diesel motorway.TERMINATED | 66,8 kg km by lorry |
| E32751 | Petrol consumed in petrol engine | 0,07 kg petrol |
Version 1.0 July 2007, © Danish Environmental Protection Agency