Evaluation of Pesticide Scenarios for the Registration Procedure
3. Scenario Comparison with Respect to Pesticide Leaching
- 3.1. Conditions for Scenarios
- 3.2. Comparison of Organic, Clay, and Silt Content in the Scenarios
- 3.3. Modelling Results
- 3.4. Summary and concluding remarks
In this chapter the eight model scenarios (Karup, Langvad, Hamburg, Tylstrup, Jyndevad, Silstrup, Estrup and Faardrup) are compared with respect to water and pesticide balance for the hole soil profile as well as pesticide leaching 1 and 3 m b.g.s..
3.1. Conditions for Scenarios
To enable comparison among the different model scenarios, crop parameters, dose, application time of pesticides, and parameters on model solutes are kept the same in all scenarios. Furthermore, it is assured that pesticide leaching of the PLAP scenarios is estimated in the same manner as in the not official EU-FOCUS-scenarios Langvad and Karup.
3.1.1. Crops
Crops comprised spring cereals and winter cereals. These crops are chosen to achieve compatibility of and consistency in the crop data for the scenarios, and to make the scenarios as representative as possible for any future use in the approval procedure of pesticides. The scenarios are set up having either spring cereals or winter cereals every year. Important dates for the crops are shown in Table 3.
Table 3. Important dates for crops used in the evaluation of scenarios.
| Crop | Emergence | Harvest |
| Spring cereals | April 1 | August 20 |
| Winter cereals | November 5 | August 10 |
The chosen crop-data for the spring and winter cereals of all the scenarios correspond with those used in the FOCUS-Hamburg-scenario (PELMO 3.3.2.), Figure 5. The crop-data used for the Langvad and Karup scenario (MACRO 4.4.2.), which are setup up in connection with the FOCUS-scenarios, is not available. Thus, it is assumed that similar crop-data for the spring and winter cereals is used in the Langvad and Karup scenario. For the PLAP-scenarios, the used crop-parameters are presented in Table 4. The cropping dates given in this table by Julian Day Number (JDN) represent the cropping dates presented in Figure 5, and the crop-properties resemble the spring barley and winter wheat used in a PLAP-calibration.
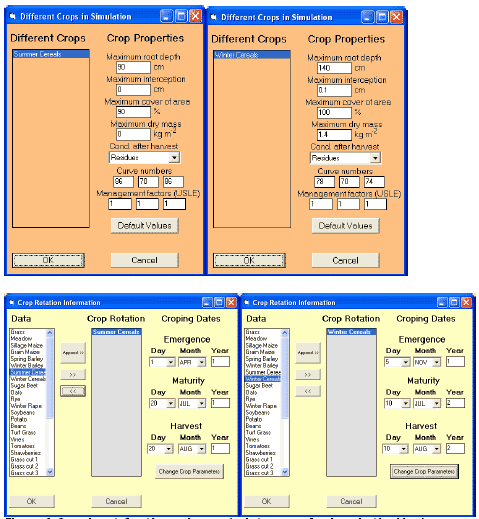
Figure 5. Crop-input for the spring and winter cereals given in the Hamburg-scenario´s PELMO 3.3.2.-setting.
Table 4. MACRO crop input parameters for the PLAP-scenarios. JDN: Julian Day Number where the days are counted starting from January 1 (i.e. January 1 equals JDN= 1 and January 2 equals JDN= 2).
| Crop properties | Spring cereals | Winter cereals |
| Day of crop emergence (IDSTART) | JDN = 90 (April 1) | JDN = 300 (November 5) |
| Day of Intermediate crop development stage (ZDATEMIN) | JDN = 91 | JDN = 66 |
| Day of maximum leaf area/root depth (IDMAX) | JDN = 201 | JDN = 191 |
| Day of harvest (IHARV) | JDN = 232 | JDN = 222 |
| Form factor controlling the rate of increase of leaf area between emergence and maximum leaf area (CFORM) | 2 | 2 |
| Form factor controlling the rate of decrease of leaf area between the date of maximum leaf area and harvest (DFORM) | 0.3 | 0.2 |
| Root distribution (RPIN) | 60% | 60% |
| Fraction pf the available water exhausted before reduction in transpiration occurs (FAWC) | 0.35 | 0.2 |
| Critical soil air content for root water uptake (CRITAIR) | 5% | 5% |
| Root adaptability factor | 0.2 | 0.1 |
| Canopy interception capacity (CANCAP) | 2mm | 3mm |
| Correction factor for wet canopy evaporation (ZALP) | 1 | 1 |
| Root depth at ZDATEMIN | 0.01m | 0.2m |
| Maximum root depth | 0.7m for clayey sites 0.6 m for sandy sites |
0.9m for clayey sites 0.6m for sandy sites |
| Leaf Area Index at ZDA TEMIN | 0.01 | 1 |
| Maximum Leaf Area Index | 4 | 6 |
| Leaf Area at harvest | 2 | 2 |
3.1.2. Dose and Application Dates
Pesticide is always applied in a dose of 1 kg/ha (100 mg/m²) every year over a period of 20 years + 6 years “warm-up” for the scenarios. This is incorporated for both the spring and fall application in all the scenarios. The dates of pesticides application for all the scenarios are assessed from crop specific emergence dates given in PELMO 3.3.2. together with management information from the PLAP-program providing information on the typical time period between emergence and application (Table 5).
Table 4. Crops, dose, emergence and application dates. The resembling Julian Day Number of the latter is given in brackets. JDN: seeTbale 4
| Crop | Dose | Emergence dates | Application date |
| Spring cereals | 1 kg/ha | April 1 | April 23 (113) |
| Winter cereals | 1 kg/ha | November 5 | November 20 (315) |
The application date is not adjusted to occurrence of precipitation, since daily precipitation data for the Hamburg, Langvad, and Karup scenarios are not available. MACRO in connection with the PLAP-scenarios can not directly simulate soil incorporation of plant protection products, why a minimal amount of irrigating water is required during application. As suggested in FOCUS (2000) 0.1 mm irrigation is applied. This application is chosen to have duration of 20 min based on experience from PLAP applications. The pesticide concentration in the irrigation water was 1·106 mg/m3 equalizing an application rate 100 mg/m². The fraction of irrigation intercepted by crop canopy is set to zero.
3.1.3. Model Solutes
The selection of model solutes A, B, and C has aimed at representing the range of the pesticide parameters characterising commonly used pesticides in European agriculture and at the same time representing pesticides, which are forbidden, percolation is registered, and the properties (DT50 and Koc) are well documented. The final choice of pesticides for representing the model solute is based on the pesticides ability to percolate through the upper meter in all the scenarios. The model solutes and their properties are presented in
Table 5.
For the PLAP-scenarios, the DT50 values in
Table 5 are representing the degradation in liquid and solid phase respectively in the macro- and micro-pore-regime in the upper approximately 30 cm b.g.s.. Below this depth, a depth factor on degradation is included. The DT50-values are divided by: 0.5 at app. 30-60 cm b.g.s. and 0.3 at app. 60-100 cm b.g.s. Below 1 meter it is assumed that no degradation takes place. This depth-related DT50-distribution is consistent with the DT50-distribution used within FOCUS, which include the Hamburg, Langvad and Karup scenarios.
Table 5. Properties for the model solutes: Pesticide A, B and C. Values were obtained from Linders et al., 1994; Roberts, 1998; Tomlin, 1997; Working documents from the European Commission.
| Pesticide | DT50 [days] |
Koc [ml/g] |
n | Vp [Pa] |
M [g/mol] |
S [mg/l] |
| A | 49 | 99.5 | 1.0 | 3.85E-5 | 216 | 33 |
| B | 6.1 | 30 | 0.99 | 2.3E-4 | 214.65 | 250 |
| C | 80 | 400 | 0.90 | 5.6E-5 | 342.2 | 100 |
3.1.4. Calculation of Leaching Output
Comparison between scenarios is based upon the yearly average pesticide concentration in leachate at 1 m b.g.s., which is not to exceed the maximum allowed concentration of 0.1 μg/l.. 1 m b.g.s. is the reference for decisions on pesticide approval when applying mathematical models and the background for this reference is explained in Appendix E.
For the scenarios setup in MACRO (Karup, Langvad, Tylstrup, Jyndevad, Silstrup, Estrup, and Faardrup), the value is calculated as the total annual leaching loss divided by the total annual flow. For the PLAP scenarios also the yearly average pesticide concentration in leachate at 3 m b.g.s. is calculated in this way.
For the Hamburg scenario setup in PELMO, it is not stated how the yearly average pesticide concentration in leachate at 1 m b.g.s. is calculated.
For the drained clay scenarios (Langvad, Silstrup, Estrup, and Faardrup), the yearly average pesticide concentration in leachate at 1 m b.g.s. may differ from the yearly average pesticide concentration in the drains, which are situated just below 1 metres depth. In MACRO, flux rates from macropore-saturated layers above the drainage depth contribute directly to drain flow based on the assumption that the drains are overlain by fully penetrating seepage surfaces (i.e. ditches or drains with highly permeable backfill). Unlike the leachate concentration, the yearly average pesticide concentration in the drains thus could include by-pass pesticide-flux from layers above the drain.
3.2. Comparison of Organic, Clay, and Silt Content in the Scenarios
Organic matter together with clay and silt content in the soil profile has been proven to have a large influence on pesticide leaching (GEUS, 2004). Therefore, these contents are summarized for the A, B, and C horizons for the sand and clay scenarios in Figure 2.
The content of organic matter, clay, and silt at Karup is within the range of content measured at the other sand sites though the organic matter in the A horizon is a little less than for the others. This is not the case for the Hamburg scenario, which is different from the Danish scenarios by not containing organic matter in the C horizon, containing much more silt in the A horizon and not containing clay or silt below the B horizon.
The Langvad scenario is characterized by having less organic matter in the A horizon and more organic matter in the B horizon than the other clay scenarios. All other contents of organic matter, clay, and silt are within the range of content measured at the other clay locations.
It is to be noted that the organic content in the B horizon generally is larger for the sand than the clay scenarios. The amount of organic matter found in the A horizon at Estrup should also be noticed.
3.3. Modelling Results
The results derived from 48 simulations representing the eight scenarios, two crops, and three pesticides (A, B, and C) will be presented in the following subparagraphs: Water balance, Mass balance, and Pesticide leaching. Results on an annual basis are to be found in Appendix D:
- For the Langvad and Karup scenario, yearly average flux concentrations in leachate at 1 metres depth, and mass balance diagrams including yearly dissipated, crop uptake, lost in runoff, and leached are presented.
- For Hamburg, yearly average flux concentrations in leachate at 1 metres depth and bottom of soil column, and mass balances including volatilisation, plant uptake, degradation, runoff, and percolate are presented.
- For the PLAP-scenarios, yearly average flux concentrations in leachate at 1 and 3 metres depth, and yearly water and mass balances including respectively: a) Precipitation+Irrigation, Actual Evaporation, Runoff, Percolate, and Drainage, and b) Leaching, Runoff, Degradation, Plant uptake, Storage+solute infiltration, and Drainage, are presented.
3.3.1. Water Balance
Obviously the driving variable precipitation has a great effect on pesticide leaching. Together with the calculated values for actual evapotranspiration, runoff, and drainage it gives the amount of percolation, which is decisive for leaching.
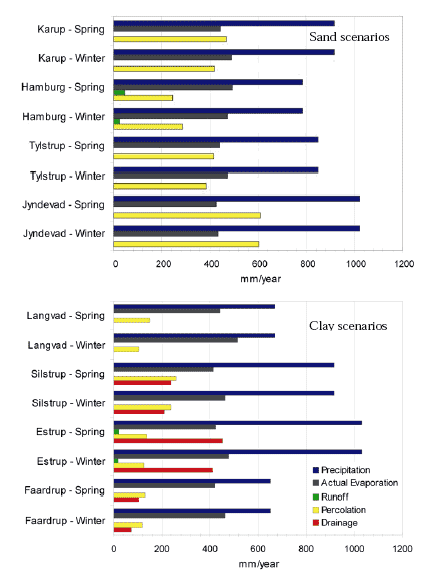
Figure 6. Water balance of 20 years simulation for all sand (upper) and clay (lower) scenarios including both spring and winter cereals. Information on an annual basis can be found in Appendix D. OBS: it was not possible to obtain drainage values for Langvad.
The water balances of the sand scenarios show that the balance values for Karup are in between the values for Tylstrup and Jyndevad, Figure 6. Hamburg differs from all others by having the least precipitation and percolation, and at the same time surface runoff. For Hamburg percolation is only about a third of the precipitation whereas for the other scenarios it is about half of the precipitation. This lower percolation at Hamburg could be a result of the water contribution to surface runoff, which is not present at the other sand scenarios. Surface runoff on sandy soils are seldom seen and can not be verified by the information found related to the Hamburg scenario. The presence of surface runoff at Hamburg could also be caused by the fact that Hamburg is set up in PELMO including a simple hydraulic description, whereas Karup, Tylstrup, and Jyndevad are set up in MACRO including a more theoretical correct advanced hydraulic description.
The water balances of the clay scenarios show that the values of the Langvad scenario resemble those of the Faardrup scenario, though keeping in mind drainage values are not available for Langvad, Figure 6. Due to the influence of especially the drainage system there is no clear correlation between total amount of precipitation and total amount of percolation. It is noticeable that Silstrup has almost twice as much percolation than the other clay scenarios, and Estrup has the largest amount of drainage and includes a minimal amount of surface runoff.
Looking at the water balance for all scenarios not surprisingly percolation is largest for the sand scenarios. The results also show that except for the Hamburg scenario, a winter crop results in a larger actual evapotranspiration. The actual evapotranspiration only varies between 400 and 550 mm/year for all scenarios while precipitation varies between 650 and 1050 mm/year (ref. chapter 2.1).
3.3.2. Mass Balance
In the understanding of leaching of a pesticide, it is crucial to follow the fate of the pesticide in the soil. In this study, it has been possible to distinguish between amount of pesticide transported to the drains, stored or infiltrated in the soil, removed by plant uptake, degraded, transported through runoff, or leached. This pesticide balance of the 20-years period for the whole profile is summarized for sand scenarios in Figure 7, while information on an annual basis can be found in Appendix D.
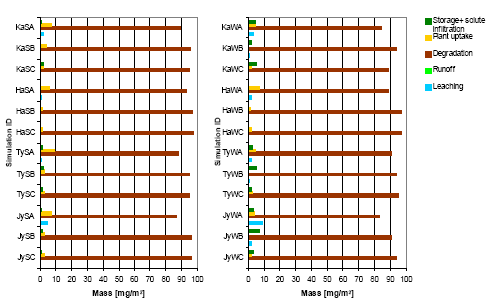
Figure 7. Mass balance of the 20-years period for the whole profile of the sand scenarios with spring (left) and winter (right) cereals. Example of simulation ID “KaSC”: Ka represents Karup, S represents spring application, and C represents pesticide C.
Before studying the balances in more detail, it is important to draw attention to the fact that the parameter controlling plant uptake in MACRO is a calibration parameter. For the PLAP scenarios the parameter, FSTAR, is 0.4 for Silstrup, 0.5 for Tylstrup, Jyndevad, and Faardrup, and 0.6 for Estrup. The parameter value for Karup, Langvad, and Hamburg is unknown or not included in the model setup.
Not surprisingly, the pesticide balance Figure 7-8 shows that between 64 and 97 percent of the applied pesticide in the scenarios are being degraded (64 to 97 mg/m²). Additionally, the plant uptake values are within 0.24-9 percent of the applied pesticide and are generally larger for the spring application than the fall application. It is noted that leaching and drainage are larger for fall applications than for spring applications, which is consistent with the larger amount of precipitation during fall and winter. Leaching is largest for pesticide A, which is moderately mobile and having a moderate half-life compared to Pesticide B and C. Pesticide B is most mobile but has the shortest half-life. Pesticide C is least mobile but has the largest half-life. Most leaching is simulated for Silstrup and second most for Jyndevad. Hardly any leaching is obtained for Faardrup.
The results for sand scenarios Figure 7 show that the estimated balance values for Karup for both spring and fall applications are in between the ones for Tylstrup and Jyndevad with Jyndevad leaching the most and Tylstrup the least. Hamburg resembles Tylstrup but does not have a PELMO-output resembling ‘storage + solute infiltration’, and does not result in leaching of Pesticide B for the fall application.
The results for clay scenarios Figure 8 show that Langvad has the largest plant uptake. Only for Estrup and Silstrup, the pesticides are transported to the drains but as stated previously, this information is not available for Langvad. At Langvad, leaching only occurs for fall application of Pesticide A and B and in very small concentrations. Thus with respect to leaching, Langvad resembles Estrup with Silstrup having much more leaching and Faardrup having hardly any leaching.
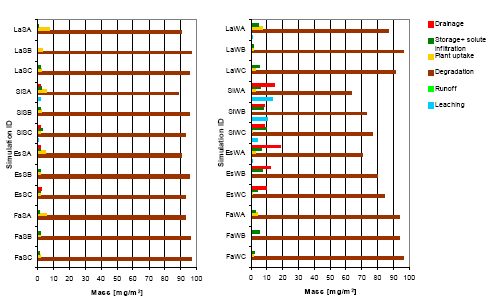
Figure 8. Mass balance of the 20-years period for the whole profile of clay scenarios with spring (left) and winter (right) cereals. The balance includes drainage, storage + solute infiltration, plant uptake, degradation, runoff, and leaching. Example of simulation ID “LaSC”: La represents Langvad, S represents spring application, and C represents pesticide C. OBS: it was not possible to obtain drainage values for Langvad.
3.3.3. Pesticide Leaching
Simulated average annual pesticide leaching at 1 m b.g.s. for sand and clay scenarios for the 20-years period is summarized in Figure 9–10. Additional information on an annual basis can be found in Appendix D. Note that the drain depth for the clay scenarios is below 1 m b.g.s.
Because MACRO is a 1-dimensional model, calculated concentrations below the groundwater table are questionable given the exclusion of the horizontal flow and transport component. In the vadose zone of the soil profile, the vertical flow and transport component will be dominating, thus the estimation of concentration with a 1-dimensional model would be acceptable. Nevertheless, the Danish EPA has a strong wish to see calculated concentrations at 3 m b.g.s., which often is below the groundwater table in the scenarios. Therefore, pesticide leaching at 3 m b.g.s. is provided for the PLAP scenarios in Figure 9-10. It was not possible to obtain this information for the other scenarios.
Results for all scenarios show that pesticide A is leaching in highest concentrations in both 1 and 3 m b.g.s. (only PLAP scenarios) for both spring and fall applications. Thus, all scenarios seem most vulnerable to the pesticide being moderately mobile and having a moderate half-life compared to the other chosen pesticides (Pesticide B is most mobile but has the shortest half-life. Pesticide C is least mobile but has the largest half-life). For spring application at Jyndevad, Langvad, Silstrup, and Estrup, pesticide C is leaching more than pesticide B. For all other spring applications it is the opposite. For fall applications, pesticide B is always leaching more than pesticide C.
As compared to spring application the fall application is resulting in a larger pesticide concentration in both 1 m and 3 m b.g.s. (only PLAP scenarios) for all three pesticides and eight scenarios. This is not surprising considering the larger precipitation during fall and winter. Moreover, residence time of the pesticides is generally shorter during fall due to larger amount of percolation occurring within the first months after application (Kjær et al., 2004). 34 of the 48 combinations of scenario, application time and pesticide have a calculated pesticide leaching above the maximum allowed concentration (MAC) equal to 0.1 μg/l.
![Figure 9. Average annual pesticide leachate at 1 and 3 m b.g.s. for sand scenarios with spring (left) and fall (right) application. Example of simulation ID “KaSC”: Ka represents Karup, S represents spring application, and C represents pesticide C. MAC is the maximum allowed concentration 0.1μg/l. The red numbers in brackets e.g. [18/20] represents the number of years out of the 20-years period (black number), where an annual pesticide concentration is equal to or beyond 0.1μg/l. Note that pesticide leaching at 3 m b.g.s. is not available for Karup and Hamburg.](images/fig09.gif)
Figure 9. Average annual pesticide leachate at 1 and 3 m b.g.s. for sand scenarios with spring (left) and fall (right) application. Example of simulation ID “KaSC”: Ka represents Karup, S represents spring application, and C represents pesticide C. MAC is the maximum allowed concentration 0.1μg/l. The red numbers in brackets e.g. [18/20] represents the number of years out of the 20-years period (black number), where an annual pesticide concentration is equal to or beyond 0.1μg/l. Note that pesticide leaching at 3 m b.g.s. is not available for Karup and Hamburg.
On sandy soils, leaching concentrations 1 m b.g.s. at Karup were found to resemble most the values obtained at Tylstrup. An exception is the smaller leaching concentration at 1 m b.g.s. for Pesticide B for fall application. Hamburg differs by generally having a lower leaching concentration, while that at Jyndevad was the highest.
On clayey soils, the leaching concentrations at 1 m b.g.s. at Langvad are higher than at Faardrup but considerably lower than Silstrup and Estrup. Silstrup generally has the highest leaching concentrations. Among the clay scenarios, Silstrup is characterized by having higher clay content and the largest calculated percolation, Figure 2 and Figure 6.
![Figure 10. Average annual pesticide leachate at 1 and 3 m b.g.s. for clay scenarios with spring (left) and fall (right) application. Example of simulation ID “LaSC”: La represents Langvad, S represents spring application, and C represents pesticide C. MAC is the maximum allowed concentration 0.1μg/l. [18/20] represents the fraction of years out of the 20-years period, where an annual pesticide concentration is equal to or beyond 0.1μg/l. Note that pesticide leaching at 3 m b.g.s. is not available for Langvad.](images/fig10.gif)
Figure 10. Average annual pesticide leachate at 1 and 3 m b.g.s. for clay scenarios with spring (left) and fall (right) application. Example of simulation ID “LaSC”: La represents Langvad, S represents spring application, and C represents pesticide C. MAC is the maximum allowed concentration 0.1μg/l. [18/20] represents the fraction of years out of the 20-years period, where an annual pesticide concentration is equal to or beyond 0.1μg/l. Note that pesticide leaching at 3 m b.g.s. is not available for Langvad.
3.4. Summary and concluding remarks
For the sand scenarios, the worst case scenario in relation to pesticide leaching is the Jyndevad scenario. Both the leaching part in the mass balance (Figure 7) and the pesticide concentrations in 1 and 3 m b.g.s. (Figure 9) for this scenario represent the maximum value of the four sand scenarios. The Jyndevad scenario is characterised by having the largest average and maximum net precipitation (Figure 3), the lowest clay and silt content in the A horizon, and the highest organic matter content in the A horizon (Figure 2) of the four sand scenarios. For the sand scenarios in general, the pesticide concentration 1 m b.g.s. is reduced going from applying Pesticide A to B to C, where C has the highest Koc value of the three pesticides (Table 6). This trend is not the case for Jyndevad with spring application; here the pesticide concentration 1 m b.g.s. is reduced going from applying Pesticide A to C to B. This could emphasis, the seasonal net precipitation impact on leaching ability of different pesticides. In connection with the spring application at Jyndevad, less percolation compared to the fall application could result in a larger amount of Pesticide B to decompose before reaching 1 metres depth (DT50=6.1, Table 6), therefore the DT50-value seems to play a larger role given the choice of the Koc–value in the pesticide B leaching.
Apart from the sand scenario Jyndevad representing worst case of leaching and Hamburg representing generally the lowest leaching, the pesticide concentrations 1 m b.g.s. for Karup and Tylstrup are quite similar even though the scenarios’ net precipitation and soil texture-setup vary, Figure 2-3.
For the clay scenarios, the worst case scenario in relation to pesticide leaching is the Silstrup scenario. Both the leaching and drainage part of the mass balance (Figure 8) and the pesticide concentration 1 and 3 m b.g.s. (Figure 9) for this scenario represent approximately, the maximum value of the four clay scenarios. The Silstrup scenario is characterised by having the second largest average and maximum net precipitation (Figure 3), the highest clay and silt content in the A horizon, and the second highest organic matter content in the A horizon (Figure 2) of the four clay scenarios. For the clay scenarios with fall application (Figure 10), the pesticide concentration 1 m b.g.s. is reduced going from applying Pesticide A to B to C like the general trend in the sand scenarios. This trend is though not the case for the spring applications; here the pesticide concentration in 1 m b.g.s. is reduced going from applying Pesticide A to C to B. This again seems to emphasis, the seasonal net precipitation impact on different pesticides’ leaching ability. Decomposition of the pesticide seems to play a larger role than sorption in the spring setting compared to the fall setting of the clay scenarios.
The pesticide concentrations 1 m b.g.s. for Langvad, Estrup and Faardrup are quite different. By ranking the scenarios after the one with the highest pesticide leaching including the drainage part, Figure 8, the following picture will appear: Estrup, Langvad, and Faardrup. Even though Langvad and Faardrup have a similar average net precipitation noticeable with larger variations in Faardrup (Figure 3), Langvad has larger pesticide leaching. Looking at the physical properties of the clay profiles (Figure 2 and Table 2), Faardrup has generally higher silt content and lower saturated hydraulic conductivity than Langvad, but to explain the difference in pesticide leaching ability between the scenarios more information concerning the drainage component at Langvad is needed.
Version 1.0 August 2007, © Danish Environmental Protection Agency