Evaluation of Pesticide Scenarios for the Registration Procedure
Appendix D Modelling Results
This Appendix presents the simulated yearly results of the Karup, Langvad, Hamburg, and the five PLAP-scenarios.
1.1 Karup and Langvad Scenarios
The leaching of Pesticide A, B, and C were simulated using the not official Karup and Langvad FOCUS-scenarios, which are set up with the model MACRO 4.4.2. (http://viso.ei.jrc.it/focus/gw/). The simulated average flux concentration at 1 m b.g.s. for pesticides A, B, and C for respectively the spring and fall application are presented in Figures D1 and D2. The mass balance for Pesticides A, B, and C given respectively spring and fall application for the Karup and Langvad scenarios is shown by MACRO 4.2.2. standard output in Figure D3.
The results show that over a period of 20 years application of pesticide A, B and C in connection with growing of spring or winter cereals, the maximum allowed concentration MAC (0.1 mg/l) is exceeded except for the combination Karup, Winter, Pesticide C; Karup, Spring, Pesticide B; and Karup, Spring, Pesticide C.
In general higher leaching is observed at Langvad than Karup, which is expected to be the opposite because sand should be more permeable than clay. By comparing Table A3 with A5 (Appendix A), a lower saturated hydraulic conductivity at Karup compared to Langvad, could give an explanation.
The level of leaching when growing spring cereals instead of winter cereals is generally lower for pesticide A and C, but for pesticide B (with the smallest DT50 and Koc) the opposite is the case. The MACRO-simulation results seem to indicate that pesticides with short half life and weak sorption properties pose a higher leaching risk under spring application than fall application whereas the opposite is the case for pesticides with long half life and strong sorption properties.
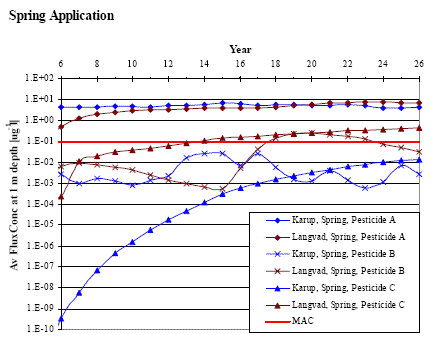
Figure D1. Average flux concentration at 1 m depth of Pesticide A, B, and C given spring application at Karup and Langvad and the maximum allowed concentration (MAC).
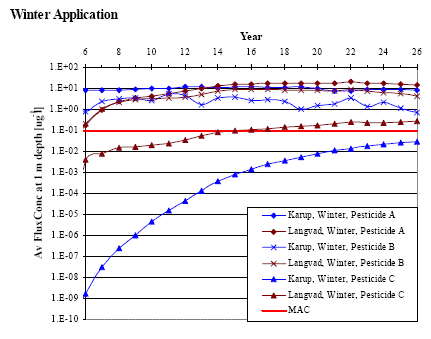
Figure D2. Average flux concentration at 1 m depth of Pesticide A, B, and C given fall application at Karup and Langvad and the maximum allowed concentration (MAC).
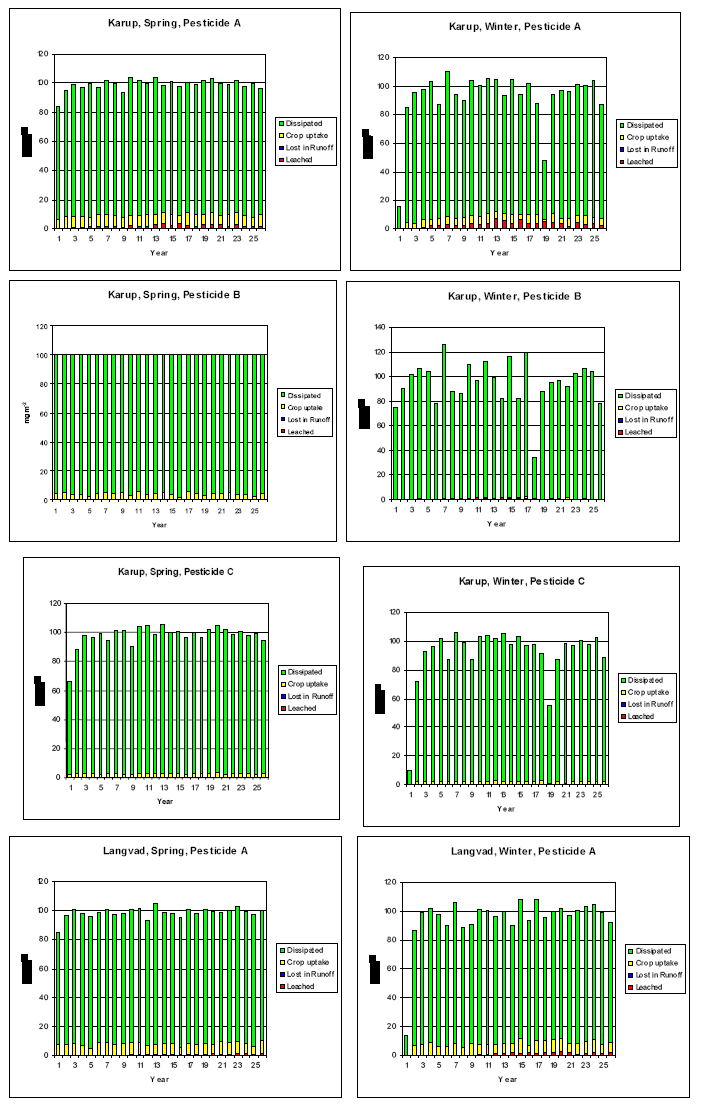
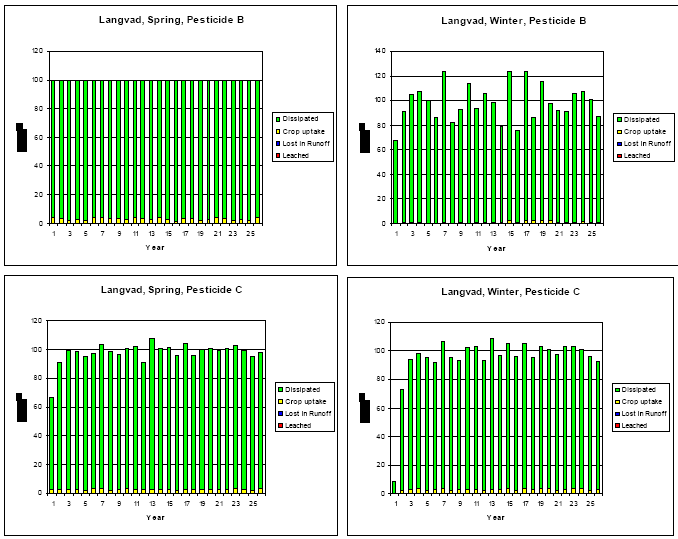
Figure D3. Mass Balance diagrams including dissipated, crop uptake, lost in runoff, and leached for Pesticide A, B, and C given respectively winter and spring application for the Karup and Langvad scenarios.
1.2 Hamburg Scenario
The leaching of Pesticides A, B, and C were simulated using FOCUS-scenario, Hamburg, which is set up with the model PELMO (http://viso.ei.jrc.it/focus/gw/). The simulated average flux concentration at 1 m b.g.s. and at the soil bottom for pesticide A for respectively the spring and fall application are presented with the output of the PELMO model in Figures D4 and D5. For Pesticides B and C they are shown in Figures D6 – D9. In Figures D4 – D9 also the annual pesticide balance for all pesticides are shown.
The results show that over a period of 20 years fall application of pesticide A, B and C causes higher leaching at both 1 m b.g.s and at the bottom of the soil than spring application. Simulated leaching is highest for Pesticide A and smallest for Pesticide C and is often exceeding the maximum allowed concentration MAC (0.1 μg/l). Plant uptake of pesticide is notably larger for Pesticide A than B and C.
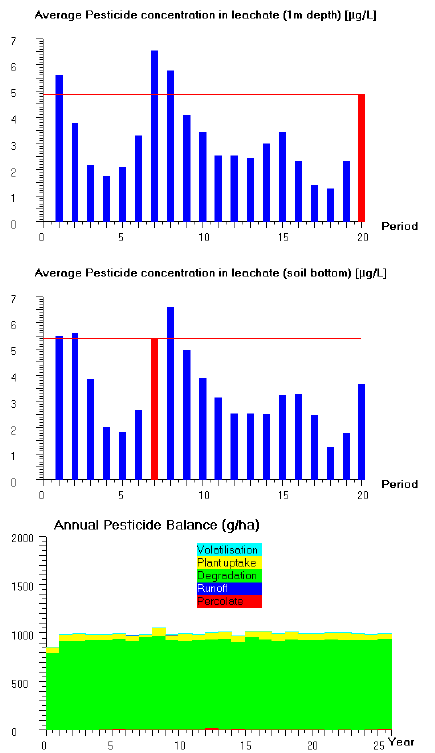
Figure D4. Simulated average flux concentration at 1 m b.g.s. and at the soil bottom for pesticide A for spring cereal with application date April 23. Also the annual pesticide balance including volatilisation, plant uptake, degradation, runofff, and percolate.
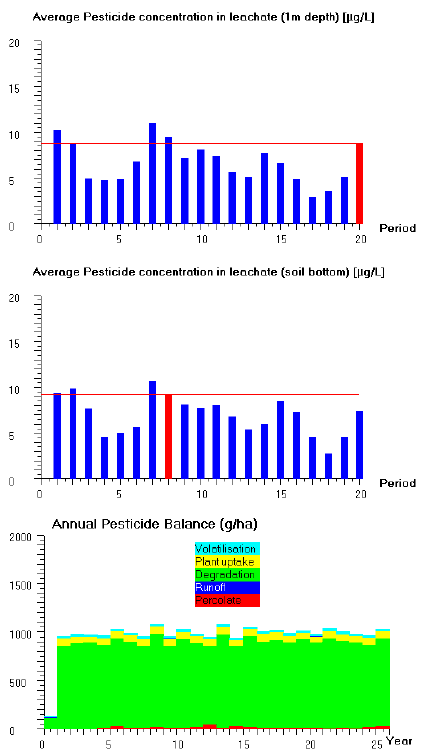
Figure D5. Simulated average flux concentration at 1 m b.g.s. and at the soil bottom for pesticide A for winter cereal with application date November 20. Also the annual pesticide balance including volatilisation, plant uptake, degradation, runofff, and percolate.
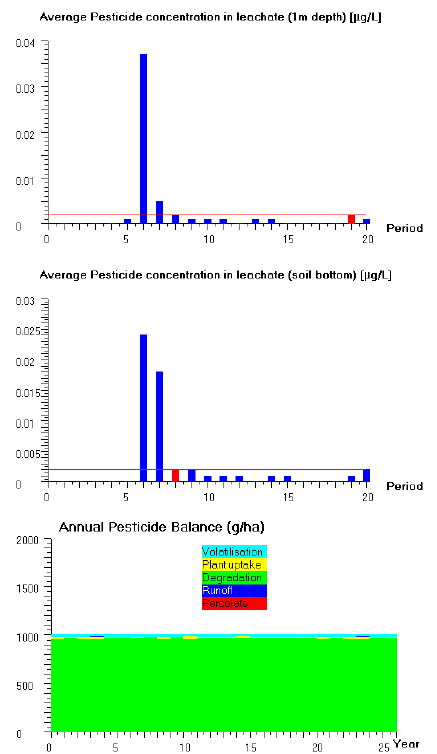
Figure D6. Simulated average flux concentration at 1 m b.g.s. and at the soil bottom for pesticide B for spring cereal with application date April 23. Also the annual pesticide balance including volatilisation, plant uptake, degradation, runofff, and percolate.
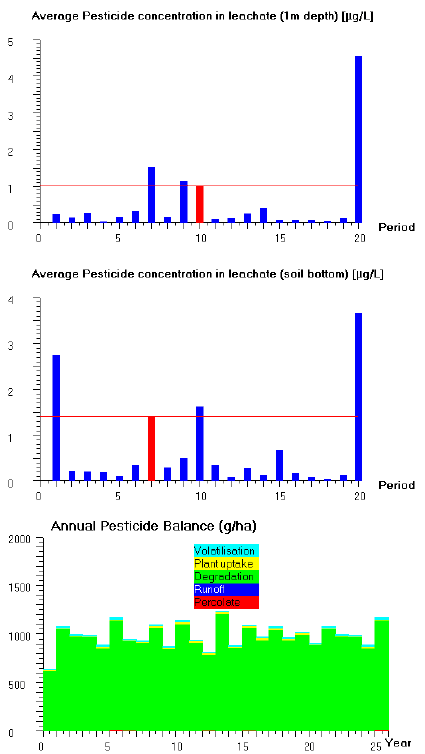
Figure D7. Simulated average flux concentration at 1 m b.g.s. and at the soil bottom for pesticide B for winter cereal with application date November 20. Also the annual pesticide balance including volatilisation, plant uptake, degradation, runofff, and percolate.
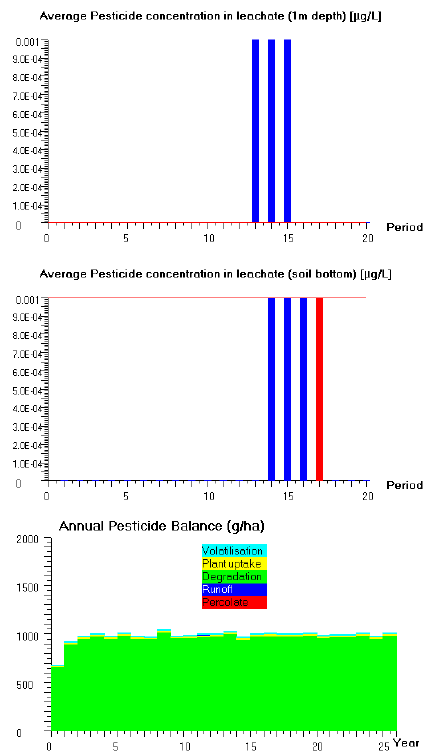
Figure D8. Simulated average flux concentration at 1 m b.g.s. and at the soil bottom for pesticide C for spring cereal with application date April 23. Also the annual pesticide balance including volatilisation, plant uptake, degradation, runofff, and percolate.
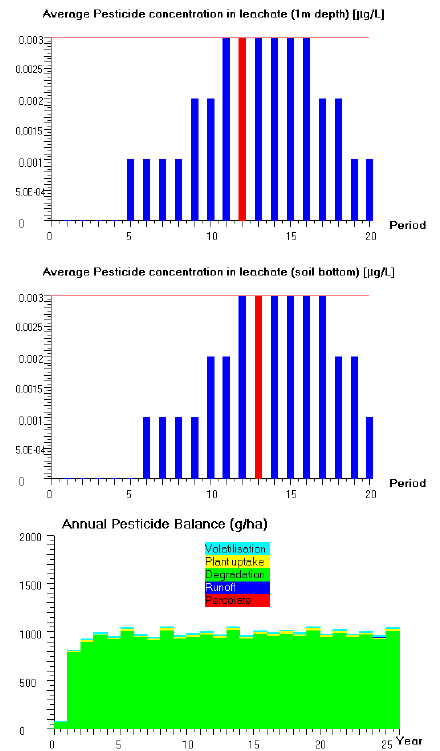
Figure D9. Simulated average flux concentration at 1 m b.g.s. and at the soil bottom for pesticide C for winter cereal with application date November 20. Also the annual pesticide balance including volatilisation, plant uptake, degradation, runofff, and percolate.
1.3 PLAP Scenarios
The leaching of Pesticide A, B, and C were simulated using the calibrated PLAP-scenarios described in Appendix C, which are set up with the model MACRO 5.1.
20 years simulation results of:
- the five PLAP-scenarios (Tylstrup, Jyndevad, Estrup, Silstrup, and Faardrup),
- implementing either the crop Spring cereal or Winter cereal,
- applying either Pesticide A, B or C,
are presented in the following thirty tables including:
- Water Balance (Precipitation+Irrigation, Actual Evaporation, Runoff and Percolate)
- Pesticide Leachate (Leachate at 1 and 3 m b.g.s.)
- Mass Balance (Leaching, Runoff, Degradation, Plant uptake, and Storage + Solute infiltration.
The results show that over a period of 20 years fall application of pesticide A, B and C causes higher leaching than spring application at both 1 m and 3 m b.g.s. Simulated leaching is highest for Pesticide A and is often exceeding the maximum allowed concentration MAC (0.1 μg/l).
Results also show that years of high or low leaching for a scenario are not the same for the three pesticides. The variation in leaching between different years for same scenario, crop and pesticide can be of orders of magnitudes.
In general the greatest leaching at both depths is observed at the clay location Silstrup. Among the two sand locations most leaching is simulated at Jyndevad.
Click here to see Tables.
Version 1.0 August 2007, © Danish Environmental Protection Agency