Survey and environmental/health assessment of fluorinated substances in impregnated consumer products and impregnating agents
8 Levels of polyfluoroalkylated substances in human tissues
The physical-chemical properties of perfluorinated chemicals cover a large spectrum. The most abundant in the environment and in Man are the ultimate degradation products of sulfonamides and telomers: Perfluoroalkyl sulfonates and perfluoroalkyl carboxylates. These chemicals have in contrary to most other persistent organic pollutants (POP) a low affinity to lipids in adipose tissues but bind to proteins in cell membranes. The accumulation in the body will therefore mainly be in protein rich parts such as blood and internal organs such as liver, kidney and spleen. A comprehensive review discussing monitoring and toxicological findings for perfluoroalkyl acids has recently been published (Lau et al. 2007).
The quantitative determination of perfluorinated chemicals in environmental and human samples is not an easy task. It includes various extraction and cleanup steps before instrumental analysis. An interlaboratory survey showed great variations in results from various sample types between laboratories (van Leeuwen et al. 2006).
8.1 Levels in human milk
Although human milk mainly concentrates lipophilic pollutants, perfluorinated chemicals have also been found in human milk, however, in much lower levels than in blood. Development of solid phase extraction methods made it recently possible to analyse these low levels in milk. In the first pilot study of two human milk samples from USA only PFPA (1.56 ng/mL) in one sample and PFHxA (0.82 ng/mL) were detected (Kuklenyik et al. 2004).
In a later study from China of 19 individual human milk samples extremely low concentrations of 6 fluorinated chemicals were found in all samples and three others in a few samples (So et al. 2006b). A summary of the data is in Table 8.1.
The relatively high concentrations of PFHxS and PFUnA are remarkable. The first should as a C6-compound not undergo bioaccumulation, and the latter may be a degradation product from 10:2 fluorotelomers. Intakes of fish were positively correlated with the levels of perfluorinated chemicals in human milk. At the greatest exposure the daily intake of PFOS+PFOA in a breastfed infant was calculated to 47 ng/kg bw and evaluated as a potential health risk to the infant.
Table 8.1: Perfluoroalkyl compounds in human milk in China (So et al. 2006b).
| No. of samples with detectable content | Average concentration (pg/mL) | Range (ng/L) | |
| PFBS | 2/19 | 2.0 | <1.0-2.5 |
| PFHxS | 19/19 | 20.5 | 4.0-100 |
| PFOS | 19/19 | 121 | 45-360 |
| PFHxA | 1/19 | 7.6 | <1.0-7.6 |
| PFHpA | 7/19 | 4.9 | 2.6-6.7 |
| PFOA | 19/19 | 106 | 47-210 |
| PFNA | 19/19 | 18.1 | 6.3-62 |
| PFDA | 19/19 | 7.2 | 3.8-15 |
| PFUnA | 19/19 | 19.0 | 7.6-56 |
The newest study is from Sweden (Kärrman et al. 2007). Only PFOS and PFHxS were present in all human milk samples. In nine composite samples (pooled milk samples from many individual mothers in various cities, mainly Uppsala) from the years 1996-2004 showed levels in the period of PFOS levels were from 0.123 to 0.258 ng/mL and levels of PFHxS were from 0.016 to 0.051 ng/mL. PFOA was not detected in these samples but PFNA was detected in three samples. The study also included a matched comparison between levels in milk and blood serum from 12 mothers. The mean levels of PFOS in serum and milk were 20.7 and 0.201 ng/mL, respectively, thus 100 times lower levels in human milk than in blood. The highest PFOS level in human milk in this study was 0.465 ng/mL; if an infant has a daily intake of 150 mL milk/kg bw that will correspond to a daily intake of 70 ng perfluorinated chemicals/kg bw – somewhat above a preliminary reference dose of 25 ng/kg bw/day.
A pilot study in Germany included 19 fresh human milk samples from Munich and 38 archived samples from Leipzig (Völkel et al. 2007). The levels for PFOS ranged between 28 and 309 pg/mL with a median of 119 pg/mL. In addition, 13 frozen milk samples from Gyor, Hungary, were analysed. The PFOS levels were higher and ranged 96-639 pg/mL with a median of 330 pg/mL. PFOA was only detected in 11 out of 70 samples in which the levels ranged 201-460 pg/mL (detection limit: 200 pg/mL).
In another small German study of 12 pooled milk samples from the Hannover area collected in 2000-2004 neither PFOS, PFOSA nor PFHxS were detected (limit 0.1-0.4 ng/mL). On the other hand, surprisingly high levels of PFHxA (range 7.5-22.7 ng/mL) and PFOA (range 4.1-12.7 ng/mL) were found (Suchenwirth et al. 2006).
Although the levels of PFCs in human milk are relatively low the exposure of these chemicals to the breast fed infant may be significant, however, the low levels in milk compared to blood make blood samples better for monitoring use.
8.2 Levels in human blood
In the blood perfluorinated chemicals are mainly bound to serum proteins, especially albumin (Jones et al. 2003b). In most studies blood serum is analysed but other studies analyse whole blood or blood plasma. When comparing such studies it is important to take into account that results will depend on what medium is analysed. In a Japanese study concentrations of PFOS were measured in whole blood and serum from the same persons. It showed that levels in serum were two to three times higher (range: 19-41 ng/mL; mean: 27 ng/mL) than in whole blood (range: 5-14 ng/mL; mean 11 ng/mL) (Taniyasu et al. 2003). Another study by Ehresman et al. (2007) showed that the plasma to serum ratios for PFHxS, PFOS and PFOA were 1:1 independent of concentration level. The serum/plasma to whole blood ratio, regardless the anticoagulant used, was approximately 2:1. The difference between plasma, serum and whole blood corresponds to volume displacement by red blood cells, which are not attracting these chemicals. Red blood cells contribute in general to 41-45% of the weight of blood.
8.2.1 Occupational exposure
Perfluorinated chemicals in human blood have for decades been detected in occupationally exposed individuals and occupational levels may be 100-1000 times higher than levels in the general population. For example in a worker handling the ammonium salt of PFOA the blood contained up to 71 µg organic fluorine/ml blood (Ubel et al. 1980). Later it was found that serum PFOS concentrations among production workers in PFOS-related processes averaged 0.5-2 ppm (mg/L) and ranged <0.1-12 ppm (Olsen et al. 2003ab).
The initial mean blood serum concentrations of PFOS, PFHxS and PFOA in a group of 24 retired fluorochemical production workers and sampled in 1998 were 799 ng/mL for PFOS, 290 ng/mL for PFHxS, and 691 ng/mL for PFOA (Olsen et al. 2007a).
8.2.2 General population exposure
There are two production methods to synthesise PFCAs. The electrochemical fluorination process result in a mixture of linear and branched isomers but the telomerisation process will only result in linear isomers. The isomer distribution of perfluorocarboxylates (PFCAs) in human blood may be used to explain the exposure source.
PFCs are attached to serum proteins, and serum has higher levels of contamination than whole blood. Therefore, it is best to monitor these chemicals using blood serum or plasma. Never the less in some studies whole blood were analysed instead of blood serum. Such results are not directly comparable, as whole blood levels will be 2-3 times lower than serum levels.
8.2.2.1 USA levels
In the first study of 65 commercial available human serum samples the average level of PFOS was 28.4 ng/mL, with a range of 6.7-81.5 ng/ml; PFOA and PFHxS were quantified in half of the samples and PFOSA only in one sample and at much lower levels (Hansen et al. 2001).
Blood serum from 31 American (age range: 5-74 years) were analysed for fluorochemicals by Olsen et al. (2003a). PFOS was determined in all but one serum sample and concentrations ranged between <6.1 to 58.3 ng/mL. The mean of the positive samples for PFOS was 18.3 ng/mL, and the mean serum to liver ratio was 1.3. In blood serum the mean levels for PFOA, FOSA and PFHxS were respectively 3.1, 4.5 and 2.4 ng/mL. Only a few samples had levels of FOSA and PFHxS above the quantification limits.
A larger study characterised PFOS and six other related fluorochemicals in serum samples taken in 2000-2001 from 645 adult American blood donors from cities in six states (Olsen et al. 2003b). The levels ranged from the lower limit of determination of 4.1 to 1,656 ng/mL (ppb) with a geometric mean of 34.9 ng/mL. The mean was a little higher among males than females but no substantial difference was observed by age. The levels of the other fluorochemicals were one magnitude lower. The means of PFOA, PFHxS, PFOSAA (N-ethyl perfluorooctane sulfonamidoacetate, oxidation product of EtFOSE) and M570 (oxidation product of perfluorooctane sulfonamidoethanol) in the six cities were 4.3-5.3, 1.8-2.2, 1.6-2.1 and 1.3-1.4 ng/mL, respectively. PFOSAA and M570 were considered markers of consumer-related exposure.
In a study of an elderly population (238 persons; ages 65-96) in Seattle, the range of PFOS in the blood was <3.4-175 ng/mL with a geometric mean of 31 ng/mL (Olsen et al. 2004). This was considered inside the normal range (30-40 ng/mL) for non-occupationally exposed individuals. The oldest individuals had slightly lower concentrations but no differences between sexes were noted. In the study levels of PFOA, PFHxS, PFOSAA and M570 ranged <1.4-16.7 ng/mL (mean: 4.2 ng/mL), <1.4-40.3 ng/mL (mean: 2.2 ng/mL), <1.6-21.1 ng/mL (mean: 1.5 ng/mL) and <1.0-6.6 ng/mL (mean: 1.2 ng/mL), respectively.
Serum samples collected in July 2003 from 20 adults from Atlanta, GA, all contained PFOS (mean: 56 ng/ml; range: 3.6-164 ng/mL), PFOA (mean: 4.9 ng/mL; range: 0.2-10.4 ng/mL), PFHxS (mean: 3.9 ng/mL; range: 0.4-11.2 ng/mL), PFNA (range: 1.3-4.4 ng/mL) and MeFOSA-AcOH (range: 0.4-5.2 ng/mL). PFOSA, PFDA, PFUnA and EtFOSA-AcOH were determined in even lower levels in most samples but not in all (Kuklenyik et al. 2004).
The levels of PFOS and PFOA in 100 serum samples from year 2000 and 40 plasma samples collected in 2005 from blood donors in Minneapolis-St. Paul were compared in a new study of Olsen et al. (2007b) in order to check, if the production stop of PFOS had any effect on blood levels. It showed that the geometric mean for PFOS of 33.1 ng/mL in 2000 decreased to 15.1 ng/mL or the half in 2005; the same did happen for PFOA with a mean of 4.5 ng/mL in 2000 and 2.2 ng/mL in 2005.
Calafat et al. (2006a) have measured 11 perfluorinated chemicals in 23 archived, pooled serum samples collected from 1990-2002 in various places in the country. The concentrations of PFOS ranged 13.8-56.5 ng/mL (median 31.1 ng/mL), of PFOA 2.8-23.7 ng/mL (median 11.6 ng/mL) and of PFHxS <0.3-3.1 ng/mL (median 2.0 ng/mL).
In another study of 54 pooled serum samples collected from 1832 participants of the 2001-2002 National Health and Nutrition Examination Survey (NHANES) mean concentrations of PFOS among non-Hispanic white male and females were 40 ng/mL and 24 ng/mL, respectively, and higher than for both non-Hispanic males (18 ng/mL) and females (18 ng/mL) or Mexican American males (14 ng/mL) and females (11 ng/mL) (Calafat et al. 2006b). A similar difference was seen for PFOA but at lower levels; among non-Hispanic white male and females 7 ng/mL and 4 ng/mL, respectively, and higher than for both non-Hispanic males (3.6 ng/mL) and females (2.85 ng/mL) or Mexican American males (3 ng/mL) and females (2 ng/mL). In a later study the same research group investigated 1562 NHANES serum samples from the earlier years 1999-2000 for other variables than sex and ethnicity as determined earlier (Calafat et al. 2007a). The conclusion was that higher education was associated with higher PFAS levels but age had no influence.
In a follow-up study 2094 serum samples from the NHANES 2003-2004 were analysed, and PFOS, PFOA, PFHxS and PFNA were detected in >98% of the samples (Calafat et al. 2007b). Geometric mean concentrations in 2003-2004 were significant lower than in 1999-2000 for PFOS (32%), PFOA (25%) and PFHxS (10%) but average level of PFNA had increased 100%.
8.2.2.2 Levels in Canada
A pilot study analysed PFOS, PFOSA and PFOA in 56 Canadian serum samples (Kubwabo et al. 2004). The total PFOS content ranged from 3.7 to 65.1 ng/mL with a mean of 28.8 ng/mL. The concentrations of PFOA (range: <1.2-7.2 ng/mL) were one order of magnitude lower than that of PFOS and only found in 29% of the samples.
A study of 16 Canadian blood serum samples showed that the linear isomers dominated with 98% thus most PFCAs must come from telomerisation (De Silva and Mabury 2006). Even numbered PFCAs had higher concentrations than odd numbered in contrary to the arctic mammals; the highest concentration of PFCAs was of PFOA (mean 4.4 ng/g).
8.2.2.3 Levels in Japan
Concentrations of PFOS in whole blood from 10 Japanese volunteers sampled in June 2002 ranged 2-14 ng/mL with a mean of about 8 ng/mL (Taniyasu et al., 2003).
More than 200 serum samples, collected in 2002-2003 from the cities of Kyoto, Yokote and Taiwa, were investigated by Harada et al. (2004). The PFOS and PFOA mean levels in serum ranged from 3.5 to 28.1 ng/mL and from 2.8-12.4 ng/mL, respectively. Highest levels of PFOS and PFOA were measured in an area with known contamination of surface water.
Harada et al. (2004, 2007) have reported the results of analysing 100 historic blood serum samples from Kyoto, Japan, from the period 1983-1999, which showed that PFOA concentrations did increase more than 4 times in that period and continued to increase, but levels of PFOS reached a plateau in late 1980s. The production of fluoropolymers in Japan increased in the same period 3.5 fold. Levels were influenced by several factors. Sex and residential area are the most influential factors, while age and smoking status are not so important. In general males had 50-100% higher concentrations than females.
Other 100 serum samples collected in 2003-2004 from 10 cities showed also large geographical differences (Harada et al. 2007). Regards PFOS the geometric mean levels in males were between 10.7 ng/mL (range: 3.7-17.6 ng/mL) in Sendai to 29.3 ng/mL (range: 22.2-37.7) in Osaka. The highest concentration was 92.2 ng/mL in a sample from Akita. Levels of PFOA were much lower with mean levels in males from 3.0 ng/mL (range: 0.4-7.8 ng/mL) in Sendai to 14.5 ng/mL (range: 10.7-19.8 ng/mL) in Osaka.
8.2.2.4 Levels in China
In China the levels differ with time and place. In one study (Yeung et al. 2006) 85 samples of whole blood collected from nine cities were analysed. The mean concentration of PFOS was greatest in samples collected from Shenyang (79.2 ng/mL) in the north and least in samples from Jintan (3.72 ng/mL) by the Yangtze River. PFHxS was the second most abundant perfluorochemical. There were large differences in the concentration profiles of the various perfluorochemicals among the nine cities. In a later study by the same research group analysed 5 blood samples from each of four cities for 10 perfluorochemicals (Yeung et al. 2007). PFOS was far the most abundant compound - around 90% of content in the three high-level cities. Jintan had again lowest levels of PFOS (mean: 5.04 ng/mL; range 1.5-12.8 ng/mL) compared with Beijing (mean: 13.8 ng/mL; range 4.04-21.2 ng/mL), Guizhou (mean: 20.7 ng/mL; range 7.78-46.2 ng/mL) and Shenyang (mean: 56.3 ng/mL; range 35.7-12.8 ng/mL).
8.2.2.5 Levels in Sweden
In a study from Sweden 66 whole blood samples collected 1997-2000 from the general population were analysed for 12 perfluorinated compounds with chain length 4 to 14 carbon atoms (Kärmann et al. 2004). PFOS, PFOA, PFOSA, PFHxS and PFNA were found in 92-100% of the samples, while traces of PFDA and PFDoA were found in 65% of the samples. Besides this, PFDS, PFHxA, PFDoA and PFTeA were detected in 3-8% of the samples. Levels of PFOS dominated with a range of 1.7-37 ng/mL and a mean of 18.2 ng/mL. The mean sum of all perfluorinated compounds was 24.6 ng/ml.
A later study included blood serum from 12 mothers collected in 2004 in Uppsala (Kärrman et al. 2007). Six out of seven perfluorinated chemicals were present in all serum samples. The compounds were PFOS (range: 8.0-48 ng/mL; mean: 20.7 ng/mL), PFHxS (range: 1.8-11.8 ng/mL; mean: 4.7 ng/mL), PFOA (range: 2.4-5.3 ng/mL; mean: 3.8 ng/mL), PFNA (range: 0.43-2.5 ng/mL; mean: 0.80 ng/mL), PFDA (range: 0.27-1.8 ng/mL; mean: 0.53 ng/mL) and PFUnA (range: 0.2-1.5 ng/mL; mean: 0.40 ng/mL). In addition, traces of PFOSA were present in 9 samples. The medians were generally a little lower than the means.
8.2.2.6 Levels in Norway
In the blood serum from 35 consumers of fish from a polluted lake in Norway the levels of 9 perfluorinated substances were measured (Thomsen et al. 2006). Males had higher levels than females. The overall results were PFOS (range: 11-62 ng/mL; mean: 30 ng/mL), PFHxS (range: 0.32-2.2 ng/mL; mean: 1.2 ng/mL), PFOA (range: 1.3-7.4 ng/mL; mean: 3.4 ng/mL), PFNA (range: 0.56-4.6 ng/mL; mean: 1.5 ng/mL), PFDA (range: 0.23-3.1 ng/mL; mean: 0.67 ng/mL) and PFUnA (range: 0.2-7.7 ng/mL; mean: 1.5 ng/mL). PFDoA, PFOSA and Me-PFOSA-AcOH were found some of the samples in levels close to the detection limit.
8.2.2.7 Levels in Denmark
A recent study by Fei et al. (2007) reports the results of PFOS and PFOA in 1399 blood plasma samples collected during March 1996 - November 2002 among a cohort of pregnant women in Denmark. The average levels of PFOS and PFOA were 35.3 ng/mL (range: 6.4-106.7 ng/mL) and 5.6 ng/mL (range: <1.0-41.5 ng/mL), respectively.
Serum concentrations of 9 perfluorinated compounds (PFOS, PFOA, PFOSA, MeFOSA-AcOH, EtFOSA-AcOH, PFHxS, PFNA, PFDA and PFDoA) have been measured in two groups of Faroe Island residents (Kato et al. 2007). The first group included 12 mothers sampled in 2000 and their 5 year old children sampled in 2005. The median concentrations were for PFOS respectively 23.7 and 16.3 ng/mL; thus the children had lower levels. Levels of the other contaminants were much lower: 2.4 and 4.5 ng/mL, respectively, for PFOA. The second group consisted of 103 children 7 years of age and samples collected in 1993-1994. The median concentration for PFOS was 29 ng/mL and for PFOA 5.5 ng/mL.
8.2.2.8 Levels in Germany
In 2005 in Germany (Bavaria) 356 samples of blood plasma from blood banks were analysed for PFOS and PFOA (Fromme et al. 2007). For males the levels of PFOS ranged from 2.1-55 ng/mL with a median of 13.7 ng/mL, and PFOA levels ranged from 0.5-19.1 ng/mL with a median of 5.7 ng/mL. For females the levels were a little lower with PFOS ranging 2.5-30.7 ng/mL with a median of 10.9 ng/mL, and PFOA ranging 1.5-16.2 ng/mL with a median of 4.8 ng/mL. For females the levels increased significantly with age.
8.2.2.9 Levels in Poland
Whole blood from a reference group of 15 donors from Gdansk in Poland in 2003 was analysed for 11 fluorinated chemicals (PFBS, PFHxS, PFOS, PFOSA, PFHxA, PFHpA, PFOA, PFNA, PFDA, PFUnA and PFDoA) (Falandysz et al. 2006). All chemicals, besides PFBS, were quantified in all samples. The concentrations of PFOS and PFOA were highest. The results are shown in Table 8.2:
Table 8.2: Levels of fluorinated chemicals in Polish blood (Falandysz et al. 2006)
| PFHxS | PFOS | PFOSA | PFHxA | PFHpA | PFOA | PFNA | PFDA | PFUnA | PFDoA | |
| Mean ng/mL | 0.51 | 16 | 0.44 | 0.03 | 0.17 | 3 | 0.61 | 0.2 | 0.11 | 0.016 |
| Range | 0.17-1.0 | 6.7-46 | 0.05-0.9 | 0.004-0.065 | 0.017-0.47 | 1.3-5.2 | 0.03-1.5 | 0.09-0.51 | 0.04-0.3 | 0.006-0.038 |
8.2.2.10 Levels in Italy
Fifty serum samples from Siena, Italy, were analysed for PFOS, PFOSA, PFHxS and PFOA (Corsolini and Kannan 2004). Most samples contained PFOS (mean: 4.3 ng/mL), a third contained PFHxS (mean 1.7 ng/mL), and 10% contained PFOSA (mean: 1.8 ng/mL). PFOA was not detected but the limit of detection was also rather high (3 ng/mL).
8.2.2.11 Levels in Sri Lanka
Rather high levels of perfluorinated chemicals were found in blood from Sri Lanka (Guruge et al. 2004). The levels in the capital Colombo were a little higher than in a rural area. Maximum serum concentrations were 18 ng PFOS/mL and 23 ng PFOA/mL.
Concentrations of 12 perfluorinated substances (PFOS, PFOSA, PFBS, PFHxS, PFOA, PFPeA, PFHxA, PFHpA, PFNA, PFDA, PFUnA and PFDoA) were analysed in 30 human sera and in seminal plasma from Sri Lanka (Guruge et al. 2005). PFBS, PFOSA and PFPeA were below the detection limits. Six of these chemicals (PFOS, PFHxS, PFOA, PFNA, PFDA and PFUnA) were found in all serum samples but only PFOS and PFHxS were present in seminal plasma. There were no differences between levels in people living in the capital Colombo (PFOS mean: 7.8 ng/mL; range: 1.5-18.2 ng/mL and PFOA mean: 9.54 ng/mL; range: 0.6-22.8 ng/mL) and in conventional tea workers from a rural area (PFOS mean: 6.3 ng/mL; range: 1.8-17.5 ng/mL and PFOA mean: 9.06 ng/mL; range: 1.9-23.5 ng/mL). However, rural organic tea workers had lower levels (PFOS mean: 0.96 ng/mL; range: 0.3-1.33 and PFOA mean: 0.53 ng/mL; range: 0.2-0.89 ng/mL). The overall mean levels were 5.0 ng/mL for PFOS, 0.57 ng/mL for PFHxS, 6.4 ng/mL for PFOA, 0.17 ng/mL for PFNA, 0.09 ng/mL for PFDA and 0.11 ng/mL for PFUnA. Thus PFOA levels in Sri Lanka are higher than that of PFOS.
8.2.2.12 Levels in Korea
In Korea 50 whole blood samples from Daegu, the fourth largest city in Korea were analysed (Yang et al. 2004; Kannan et al. 2004). The mean concentration of PFOA (88 ng/mL) was higher than that of PFOS (15 ng/mL). There were no sex or age dependencies. Curiously, PFOA was only determined in 19-25% of these samples. This may be explained by individual exposure to a local source.
8.2.2.13 Levels in Peru
Calafat et al. (2006a) measured 11 perfluorinated chemicals in serum samples collected in 2003 from 44 residents from Trujillo in Peru. Perfluorinated chemicals were only determined in less than 25% of the samples. The 95th percentile serum concentrations of PFOS was 1.0 ng/mL, of PFOA was 0.3 ng/mL and of PFHxS 0.4 ng/mL.
8.2.2.14 Levels in the arctic
In the Arctic the human blood levels are generally lower than in industrialised areas. In twelve plasma samples from women giving birth from Bodø in Norway, Naryan Mar in North Russia and Taimyr in Siberia low levels of sixteen perfluorinated compounds were determined (Odland 2006). Highest levels (median 16 ng/mL; max. 49 ng/mL) were found for PFOS in North Russia followed by Norway (median 16 ng/mL; max. 28 ng/mL); lowest levels in Siberia (median 9 ng/mL; max. 14 ng/mL). For PFOA the levels were much lower and about similar the three places (median 2 ng/mL; Max. 6 ng/mL). For PFNA the levels in North Russia (median 6 ng/mL; max. 16 ng/mL) were about five times higher than the other places. PFHxS, PFHpS, PFOSA, PFHpA, PFDA, PFUnA, PFDoA, and PFTrA had median levels of 0.1-1.5 ng/mL. The rest of the substances (PFPS, PFNS, PFDS, EtFOSA, and PFHxA) had median levels of 0.002-0.04 ng/mL. The levels of PFOS were much higher than levels of the more well-known chlorinated and brominated contaminants.
The presence of perfluorinated compounds in 23 archived pooled samples of blood plasma from females of the northern population in Canada was studied by Tittlemier et al. (2004). Average levels were 36.9 ng PFOS/mL and 2.2 ng PFOA/mL. All samples also contained PFNA (0.11-1.98 ng/mL), while 70% of the samples contained detectable levels of PFHpA and only one sample contained PFHxA. There was no difference between levels in Inuit and Caucasian people as there are for PCB and dioxin, thus the source of exposure may not be food.
8.2.2.15 International comparisons
OECD has made an overview of PFOS and PFOA levels in human blood sampled in various countries from 1998-2000. The average PFOS levels ranged 17-53 ng/mL for PFOS and 3-17 ng/mL for PFOA (OECD 2002).
PFOS and other perfluorinated chemicals were determined in blood serum from the general population of the USA, India and Italy by Kannan et al. (2003). PFOS levels (mean: 32 ng/mL) in Americans are 7-8 times higher than in Italians who again have twice the levels of Indians. In the majority of samples from the USA PFHxS, PFOA and PFOSA were also detected (means: 3.9, 5.1, and 3.4 ng/mL, respectively). On the contrary, one third of the samples from Italy and India had detectable levels of PFHxS while PFOA and PFOSA only were detectable in a few or zero samples. The concentration of PFNA and PFDA was between 0.5 and 1 ng/mL. No variation in sex or age was seen.
A later study of Kannan et al. (2004) reported concentrations of perfluorinated compounds (PFOS, PFHxS, PFOA, PFOSA) in 473 blood/serum/plasma samples from 9 countries (USA, Columbia, Brazil, Belgium, Italy, Poland, India, Malaysia and Korea). In all countries, besides Korea, PFOS was far the dominating contaminant with means values ranging from 66 ng/mL in Kentucky, USA, and to 2.3 ng/mL in India.
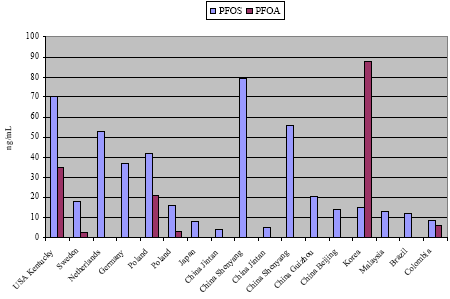
Figure 8.1 and Figure 8.2 show data from various countries of PFOS and PFOA in blood serum/plasma and whole blood, respectively. The separation is due to that whole blood levels will be 2-3 times lower than serum/plasma levels, because PFCs are attached to the serum proteins.
Figure 8.1: Average concentrations of PFOS and PFOA in human blood serum/plasma from various countries.
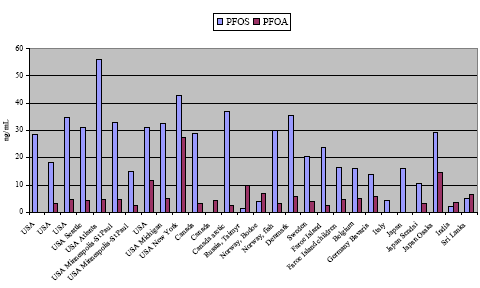
Figure 8.2: Average concentrations of PFOS and PFOA in whole human blood from various countries.
8.2.2.16 Summary and conclusion
Blood levels of perfluorinated chemicals have been monitored in many countries but most data has been published from USA. In all countries, besides Korea, PFOS has been determined in far higher concentrations than the other PFCs. Typical average serum levels of PFOS in industrialized countries are 20-30 ng/mL with maximum levels less than 100 ng/mL. Rural areas show serum levels less than 10 ng PFOS/ml The second most abundant PFC is normally PFOA with typical average serum levels of 3-5 ng/mL. Some of the highest PFOS blood levels (2-3 times the typical levels) in the general population were determined in industrial areas of USA and China. Such levels may be 10 times higher than in rural and remote areas. Preliminary data from Denmark show somewhat higher concentrations than in our neighbour countries with an average PFOS level in blood serum of 35 ng PFOS/mL and with a maximum concentration of 107 ng/mL.
8.2.3 Cord blood
Perfluorinated compounds were investigated in maternal blood and in cord blood in 15 pregnant Japanese women. PFOS concentrations in maternal samples ranged from 4.9 to 17.6 µg/L, whereas those in foetal samples ranged from 1.6 to 5.3 µg/L, or one-third of maternal levels. PFOA was only determined in 3 out of 15 maternal samples with concentrations ranging 0.5-2.3 µg/L. PFOSA was not detected in any samples (Inoue et al. 2004).
Levels of perfluorinated compounds in cord blood plasma (archive pooled samples) from females of the northern population in Canada were about the half of maternal blood or a little higher than in Japan (Tittlemier et al. 2004).
Midasch et al. (2007) determined PFOS and PFOA in maternal blood and cord blood plasma from 11 German mothers. Concentrations of PFOS in maternal blood ranged from 7.8-16.4 ng/mL with a median of 13.0 ng/mL. In cord blood the PFOS concentrations ranged 3.3-9.5 ng/mL with a median of 7.3 ng/mL; thus almost the half of maternal blood as measured in Canada. Regards PFOA the levels in cord blood were much lower and ranged from 1.5-4.0 ng/mL with a median of 2.6 ng/mL, and surprisingly the levels in cord blood were a little higher with a range of 1.5-4.6 ng/mL and a median of 3.4 ng/mL.
Apelberg et al. (2007a) analysed cord serum from 299 newborns delivered in Baltimore, USA, 2004-2005, for 10 polyfluorinated compounds. PFOS and PFOA were detected in all samples with geometric mean concentrations of 4.9 ng/mL and 1.6 ng/mL, respectively. A comparison of PFOS and PFOA in 200 maternal (second sampling) and 50 cord blood plasma samples from Denmark 1996-2002 showed that the average levels in maternal blood of PFOS (29.9 ng/mL) were 2½ times the levels in cord blood (11.0 ng/mL). The difference was much smaller for PFOA having the lower average levels of 4.5 ng/mL in maternal blood and 3.7 ng/mL in cord blood (Fei et al. 2007).
In conclusion: Levels of PFCs in cord blood are about the half of levels in maternal blood, thus some transfer to placenta occurs.
8.3 Levels in semen
Rather high levels of perfluorinated chemicals were found in blood and semen from Sri Lanka (Guruge et al. 2004). The levels in the capital Colombo were a little higher than in a rural area. Levels in semen were ten times lower than in blood serum. Maximum blood serum concentrations were 18 ng PFOS/mL and 23 ng PFOA/mL.
8.4 Levels in the liver
Livers from 31 American deceased donors were analysed for fluorochemicals by Olsen et al. (2003a). Liver PFOS concentrations ranged between <4.5 to 57 ng/mL but in about half of the liver samples levels were below the limit of quantification. The means of the positive samples were 28.0 ng/g ww for liver. The mean serum to liver ratio was 1.3. Only one liver had measurable contents of PFOA.
Version 1.0 October 2008, © Danish Environmental Protection Agency