Acceptance criteria in Denmark and the EU
1 Explanation of terms
- 1.1 Introduction
- 1.2 Hazard, consequence and risk
- 1.3 Land use planning and major hazard establishments
1.1 Introduction
Words such as ‘risk’, ‘hazard’ and ‘consequence’ are commonly used. Yet communication about risk can sometimes be difficult, as the precise definitions used by risk experts are not always understood by non-experts with their more subjective perception of these terms.
This chapter will explain these terms as they are used by experts in the field of assessing risk of industrial activities. Earlier publications exist in which these terms are defined and discussed (in Danish), including Environment Project 112 (Taylor et al., 1989), Danish Standard DS/INF 85 (Dansk Standard, 1993) and a paper by the Danish Environmental Risk Council (Christensen et al., 2002; Christensen et al., 2003). This report adheres most closely to the definitions in Danish Standard DS/INF 85. There is a glossary at the end of the report containing the most important terms.
1.2 Hazard, consequence and risk
The terms, ‘hazard’, ‘consequence’, and ‘risk’, are used in the risk analysis process.
In order to determine the risks an activity may entail, one must first identify the hazards inherent in the activity. A ‘hazard’ is defined as a situation or state that could lead to injury. It thus refers to the possibility of an accident, without considering probability or consequences.
A ‘consequence’ is the result of an undesired event (an accident), such as injury to health, life, assets, or the environment.
‘Risk’ expresses a combination of the frequency (or probability) of an undesired event, and the scope of the consequences. ‘Risk’ is used in order to be able to compare various events in terms of the highest or lowest risk. Risks must either be classified qualitatively or expressed using a quantitative value, if they are to be ranked. A common quantitative expression for risk is the consequence (expressed in a particular unit, such as number of deaths, or financial loss) multiplied by the probability. This expression of risk is also called the expected loss, but it is only one of many options for expressing risk as a combination of consequence and probability.
When we discuss risk criteria for third parties at major hazard establishments (i.e. people other than employees of the establishment), there are various relevant ways to express risk. The most common terms are individual risk and societal risk. The concept of consequence distance is useful when one is unable or unwilling to calculate risk quantitatively. It can also be used in combination with a risk matrix. These terms are explained further in the following sections.
It should be noted that terms have not yet been developed for assessing the environmental impacts of major accidents. Environmental damage is only discussed qualitatively. This will be further dealt with in section 4.3.5.
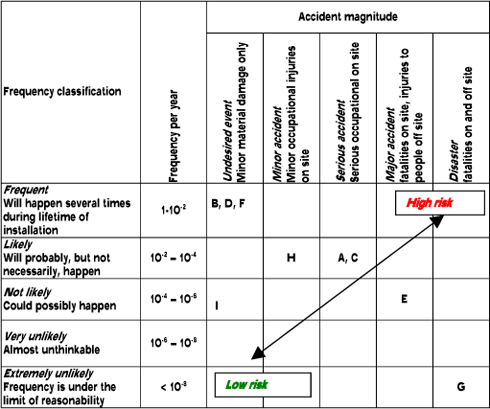
1.2.1 Risk matrices
Risk analysis produces a list of accident scenarios, i.e. various potential accidents involving fire, explosion and/or the emission of dangerous substances into the environment (air, water, or soil). For each of these scenarios, one can assess:
- The probability (expected frequency)
- The magnitude or extent of the consequences
This allows the scenarios to be entered in a table ranking probability classifications on one axis (e.g. from frequent to extremely rare) and consequence classifications on the other axis. Such a table is called a risk matrix. Each field in a risk matrix represents a particular risk, and you can identify the sections of the matrix showing major risks (high probability and major consequences) and minor risks (low probability and minor consequences), see Table 1.
Table 1. Example risk matrix.
Risk increases from low to high as you move along the diagonal from the bottom left to the upper right corner. The letters (A, B, C, etc.) illustrate how you can enter example accident scenarios in the table.
1.2.2 Consequence distance and maximum consequence distance
One can calculate the maximum distance within which fatalities or injury can occur for each potential accident. Consequence distance is generally defined as the distance within which death or serious injury is expected (most units for measuring risk and risk criteria are based on fatality alone, but this problem will be discussed later). The consequence distance is either based on the distance within which a particular mortality rate would be expected (a mortality rate of one per cent is used in many studies and methods, e.g. the distance to a concentration level of ‘LC 1%’¹), or the distance to a particular end-point value for toxicity, heat radiation, or overpressure. The spread of toxic or explosive gas clouds will depend on meteorological conditions. One can use the worst scenario (e.g. scenario ‘G’ in Table 1) and the worst case meteorological factors to determine the maximum consequence distance that applies to the establishment in question. The establishment will not represent a risk to human life outside the maximum consequence distance.
1.2.3 Location-based (individual) risk
The term, ‘individual risk’, is often used in relation to quantitative risk criteria. DS/INF 85 defines individual risk as the risk an individual is exposed to, based on their distance from the risk source. This person-linked definition is problematic in relation to land use planning for major hazard establishments, as it involves assumptions about the movements and presence of individuals, which are not significant to understanding the risk situation surrounding the establishment. In the Netherlands and Flanders the term ‘location-based risk’² has therefore been introduced. Location-based risk is calculated as the risk that a person who is continually present and unprotected at a given location will die as a result of an accident within the establishment.
Figure 1. Example ISO risk curves showing the distribution of location-based (individual) risk surrounding an enterprise.
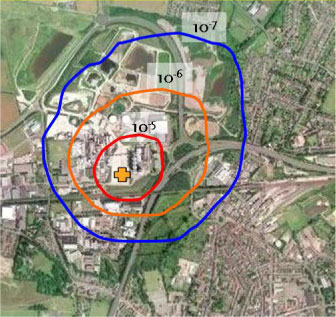
Location-based risk describes the geographic distribution of risk for the establishment in question. It is shown using ISO risk curves, and is not dependent on whether people or residences are present (see Figure 1). Location-based risk is used to assess whether individuals are exposed to more than an acceptable risk in the locations where they may spend time (e.g. where they live or work). It does not directly provide information on potential loss of life. Nor does it distinguish exposure affecting employees or the general population (By only drawing risk curves outside the company the indication is made that employees will not be considered in the assessment).
In order to maintain continuity with the commonly used term, this report will use the term ‘location-based (individual) risk’.
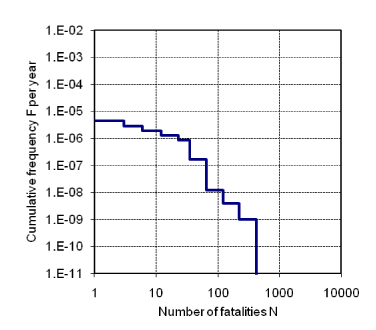
1.2.4 Societal or group risk
Societal risk expresses the risk that a group of people is simultaneously exposed to the consequences of an accident. This is expressed – using an ‘F-N curve’ – as a relationship between the expected frequency of the accident, and the number of people who will die (or be injured) as a result of the accident. ‘F’ is the (cumulative) frequency of an accident involving more than N deaths³, see Figure 2. The result expresses the total expected simultaneous loss to the community. Calculation of an F-N curve takes into account the probability of a number of accident scenarios, and an assessment of how many people might be exposed to consequences under these scenarios, based on population density, places of work, and local protection (whether they are indoors or outdoors). Practices differ regarding the inclusion of the establishments workforce as well as employees at surrounding establishments, or if only the general population is included. Figure 2 shows an example societal risk curve. Each step in the curve represents an accident scenario.
Criteria for societal risk and location-based risk are used to complement each other. Criteria for location-based risk are used to determine areas (risk zones) which may not be used for residential or similar purposes, and ensure that individual persons are not exposed to excessive risk. Criteria for societal risk are used to ensure that locations where many people may assemble are not exposed to excessive risk of a major accident, even if they lie outside the risk zones. This is explained further in section 1.3.1.
Figure 2. Example societal risk curve for an establishment.
The first ‘step’ on the right side of the curve shows the most severe accident scenario (estimated to lead to approx. 400 fatalities, with a frequency of 10-9 per year). The second step shows the contribution from the second-most severe accident (estimated to lead to approx. 200 fatalities, with a frequency of 3×10⁻⁹ per year).
1.2.5 Potential Loss of Life (PLL)
The concept of potential loss of life (PLL) is occasionally used when discussing risk acceptance for third parties. This is an easily understood term used in relation to dangerous workplaces, such as oil rigs. The potential loss of life is calculated by summing up (i.e. using mathematical integration) the location-based (individual) risks, multiplied by the population density for each location (after assessing local protection due to people being indoors or outdoors) for the entire area within the maximum consequence distance. The result is a simple figure (expressed as the number of deaths per year), expressing the total potential loss of life to the community. However, unlike societal risk, it does not take into account whether the loss results from many small accidents, or a few large ones. Potential loss of life is used indirectly in the United Kingdom when risk acceptance criteria are formulated as the maximum number of people to whom exposure to a particular location-based (individual) risk is acceptable.
1.3 Land use planning and major hazard establishments
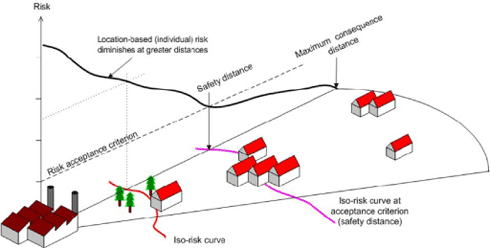
1.3.1 Safety distances
Clearly, the risk of being affected by an accident at a chemical plant or a warehouse storing dangerous substances is greatest close to the risk source. The risk of injury to neighbouring residents and/or damage to conservation-worthy natural habitats due to accidents in major hazard establishments can be effectively managed by controlling the distance between such establishments and the objects to be protected. However, risk zones surrounding major hazard establishments that cannot be used for residential or business purposes represent a cost to society. It is often very expensive to locate major hazard establishments at a distance greater than the maximum consequence distance from populated areas and other vulnerable objects. People are exposed to other involuntary[4] risks deriving from human activity (such as traffic), and it is therefore seen as acceptable to expose the population to a certain minor risk from major hazard establishments. However, it is difficult to define how small this risk ought to be, i.e. to lay down risk acceptance criteria, and to develop a method to ensure compliance with these criteria in practice. Figure 3 illustrates the difference between the maximum consequence distance and the safety distance (the distance within which limitations are placed on the movement of people, to prevent them from being exposed to excessive location-based (individual) risk in relation to the agreed risk acceptance criteria).
Societal risk depends on the population density within the maximum consequence distance. The population density within the safety distance will often be low (or effectively zero), so the societal risk is determined by the population density between the safety distance and the maximum consequence distance. An assessment of societal risk is therefore complimentary to an assessment of safety distance. Safety distances are either determined on the basis of location-based (individual) risks, or reference accident scenarios (please refer to the next section).
Figure 3. Illustration of concepts relating to land use planning for major hazard establishments and their surroundings.
The risk is zero at any distance greater than the maximum consequence distance. The safety distance indicates the point at which the risk falls below the risk acceptance criteria, i.e. at greater distances the risk to individuals is acceptable. Iso risk curves show the geographic distribution of location-based (individual) risk.
1.3.2 Risk analysis methods
In order for risk acceptance criteria to work, there must be a relationship between the criteria, and the information generated using the risk analysis methods that are to be compared with the criteria. When using quantitative risk acceptance criteria (such as a particular value for location-based (individual) risk), it is necessary to perform quantitative risk analyses that produce location-based (individual) risks under the same conditions as were used as a basis for the definition of the criteria. Various practices in some EU Member States are reviewed in chapter three. This review shows that the way risk acceptance criteria are formulated is strongly correlated with the methods used for risk analysis.s
Figure 4. Diagram of activities involved in risk analysis
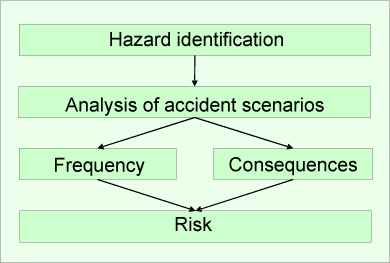
The general activities performed during risk analysis are shown in Figure 4. These activities must be performed for both qualitative and quantitative analyses (although the time required for each activity in the two types of analyses can vary greatly). Risk analysis begins with the identification of all the hazards that exist for a given major hazard establishment. A number of hazards are then analysed in detail by considering the scenario and possible types of consequences. This detailed analysis must clarify how frequent the event is, and what magnitude the consequences would have. These analyses may be qualitative or quantitative (although consequences are usually analysed using quantitative methods, such as simulation of fires, explosions and atmospheric dissemination). The results are combined into an expression of the total risk in a way that can be compared to one or more risk acceptance criteria (this comparison is often called risk assessment).
1.3.2.1 Quantitative risk analysis
The aim of quantitative risk analysis is to generate numeric values for location-based risk and societal risk that include risk contributions from all possible accidents.
There is a clear understanding of the content of a quantitative risk assessment for non-nuclear land-based major hazard establishments. The method has, for example, been explained in the Dutch ‘Purple Book’ (Committee for the Prevention of Disasters, 1999). This method analyses all accident scenarios expected to have an impact outside the establishment’s fence[5]. The frequency for all these scenarios is determined quantitatively. The consequences are calculated in detail using consequence models for dissemination, explosion, fire and/or toxic effects. This includes calculation of the probability of fatality (or injuries/damage) within the accident consequence area (e.g. the area covered by a toxic cloud). The risk distribution surrounding the establishment for a given scenario is calculated, taking into account probable wind direction and strength. The risks for all accidents are summed up, and the total represents the geographic distribution of location-based (individual) risk for the establishment. Societal risk is calculated by returning to the individual scenarios and determining the frequency for impact on a particular population area, taking into account the scenario frequency and the probability of the necessary wind direction and strength occurring.
1.3.2.2 Qualitative risk analysis
The expression, qualitative risk analysis, covers a range of different methods that do not use numeric values (i.e. precise figures) for location-based (individual) risk or societal risk. The term is therefore less well-defined than quantitative risk analysis.
Qualitative methods are in use because it is difficult to determine expected frequencies for rare accidents. There can be major differences in results from various analysis groups. A factor of 100 is not uncommon due to the use of different data sources (Lauridsen et al., 2002). Another argument for using qualitative methods is that it is impossible for people to comprehend frequencies as low as 10-6 per year.
Qualitative methods therefore focus primarily on an accident’s consequences, and the consequence models used in qualitative methods are the same as those used in quantitative methods (although often only the distance to a particular damage effect is used, whereas quantitative methods use the entire damage area).
Based on hazard identification (see Figure 4), the worst case accident can be selected. This accident is determined largely by basic physical factors at the establishment, such as the total volume of a dangerous substance (in storage tanks) or the mass flow (in pipes), and its pressure and temperature. The worst case accident might be the total collapse of a tank, or complete rupture of a pipe, in combination with aggravating conditions such as low wind speed and delayed ignition (only once the explosive gas cloud has reached maximum size). The maximum consequence distance is calculated for these scenarios. A purely qualitative method that does not assess probability only results in an expression of the maximum consequence distance (this risk analysis method is sometimes called deterministic).
This is an unsatisfactory situation (see section 1.3.1), and a less serious, but more probable scenario is often selected. This is sometimes referred to as the ‘worst credible accident’. We prefer the more neutral term, ‘reference accident scenario’. The reference accident scenario is used to determine the safety distance. The reference scenario is perceived to be the most serious of all accident scenarios with a frequency high enough to represent an unacceptable risk, while more serious scenarios (including the worst case scenario) are thought to be of such a low frequency that the risk may be discounted.
This approach can lead to the following problems:
- Criteria have not been specified for selecting the reference scenario (i.e. risk acceptance criteria for the qualitative approach).
- The worst case scenario, and hence the maximum consequence distance, is excluded from the risk analysis. The maximum consequence distance is relevant to emergency planning, and as described in section 1.3.1, the region between the safety distance and the maximum consequence distance is pivotal to the assessment of societal risk.
Some consideration of probabilities cannot be avoided, even when using a qualitative approach. Most qualitative methods therefore use frequency classifications based on qualitative verbal descriptions, like those introduced in the risk matrix (Table 1, column one). When such methods begin to incorporate probability considerations (like the effect of subsequent safety measures on accident frequencies), they are called ‘hybrid’’ methods.
The ‘safety-barrier diagram method’ used in Denmark, can also be viewed as a hybrid method. In this method, initiating events and safety barriers are allocated points, depending on the frequency of the event and the barrier failure rate (see section 2.1.2). The method focuses on assessment of initiatives to prevent accidents and reduce consequences, in contrast to the quantitative method described in the ‘Purple Book’. The latter is based on generic (i.e. non-site specific) frequencies for emissions of dangerous substances.
[1] LC x %: Lethal Concentration, the concentration at which x per cent of the exposed population will die.
[2] In Dutch: “Plaatsgebonden risiko”, translated as “locational risk” or “location-based risk” in English. The term, “locational risk”, can mean something different in other contexts.
[3] In practice, the number of deaths is used as the injury parameter, but other parameters can be used, such as the number of injured or the extent of environmental damage.
[4] An involuntary risk is defined as a risk a person is exposed to, even though they have no part in or direct advantage from the activity the risk is associated with
[5] The ‘Purple Book’ contains two specific criteria for the inclusion of a Loss Of Containment (LOC) event in the analysis: (1) the frequency must be greater than 10-8 per year, and (2) there must be a possibility of deaths (1 % probability) outside the enterprise’s boundary line
Version 1.0 Marts 2009, © Danish Environmental Protection Agency