The Advisory list for self-classification of dangerous substances
Annex 2. Analysis of positive predictions of cancer classification
LeadScope is a predictive data-mining tool for exploring and filtering data sets based on both structural features and associated data[9]. This software contains a predefined library of over 27,000 chemical functional groups (medicinal chemistry building blocks), which can be applied in the analysis of structural similarities within data sets. Structural similarities may lead to logical paths linking chemical structures with a biological endpoint.
In this example, structural similarities associated with (Q)SAR predictions used for the advisory classifications for cancer were analysed based on a large data set to try and gain further insight into the predictions.
A random set of 21,000 chemicals from the full set of around 185,000 chemicals in the DK (Q)SAR prediction database was imported into LeadScope. The size of the set, which was chosen for practical and technical reasons, is judged to be representative of the full database.The cancer predictions made in the four Multicase FDA cancer models[10] for carcinogenicity to male and female Mice and Rats, respectively, were entered as the overall call made by the so-called FDA ICSAS methodology[11]. Also entered were predictions from the Multicase Ames mutagenicity model (described in 3.2.2), and an overall prediction of in vivo genotoxicity[12] based on five Multicase models for in vivo genotoxicity endpoints (Drosophila SLRL, mutations in Mouse micronucleus, dominant lethal mutations in rodents, sister chromatid exchange in mouse bone marrow, and COMET assay in mouse).
The 21,000 chemicals were organized into groups based on structural features according to the LeadScope library of chemical functional groups. This first rough structural grouping in LeadScope is shown in figure 1. The groups are coloured based on the cancer predictions from the FDA cancer models.
Groups with over-representation of positive predictions have red bars, groups with over-representation of equivocal predictions or predictions, which are out of the applicability domain, have grey bars, and groups with over-representation of negative predictions have green bars. Interpretation of colours is indicated in the bottom right corner.
The length of the bars indicates the number of chemicals (plotted on a log scale). For each group there are a number of more narrowly defined sub-groups, named clusters, which may have different distributions of positives, negatives and “out-of-domain” chemicals.
Figure 1. First rough structural grouping in LeadScope of the 21,000 chemicals with FDA ICSAS cancer calls
Out of the 21,000 chemicals, 4,705 chemicals were assigned to the group “reactive groups” by LeadScope. This group is marked with blue in figure 1, and was selected for further analysis in this annex.
Identification of a group of genotoxic carcinogens
Within the “reactive groups” LeadScope made a number of chemical clusters. Figure 2 gives the first part of a list of these clusters, and again clusters with over-representation of positive cancer calls are shown in red. Further down the list are further out-of-domain clusters (grey) and negative clusters (green).
In the leftside of figure 2, the cluster numbered “90” is highlighted in blue. This cluster is in red colour and contains 24 chemicals.
Figure 2. Cluster 90 with positive predictions for cancer
The first 20 chemicals in cluster 90 are given in figure 3. The FDA predictions of cancer are given for each chemical in the upper left corner. FDACALL of “1.0” means positive cancer prediction.
Figure 3. Chemicals in cluster 90
From figure 4 it can be seen that all 24 chemicals in cluster 90 are predicted positive for both cancer (yellow column to the left) and for Ames mutagenicity (yellow column to the right). The chemicals in cluster 90 appear on this basis to be genotoxic carcinogens.
Figure 4. FDA cancer predictions and Ames mutagenicity predictions for chemicals in cluster 90
Identification and mechanistic profile of a group of steroidal carcinogens
If we go back to the clusters within the “reactive groups” and instead of cluster 90, choose cluster 51, we find a very different group of chemicals. In the left side of figure 2, cluster number 51 is highlighted in blue. This cluster contains 156 chemicals, with over-representation of positive cancer predictions as can be seen from the red colour of the bar.
Figure 5. Clusters within the ”Reactive groups” with cluster 51 highlighted (left)
Cluster 51 is composed of steroids that are likely to be promoters of cancer. The first of the 156 chemical structures are given in figure 6.
Figure 6. Chemicals in cluster 51; steroids which are likely to be promoters
In figure 7, the distribution of cluster 51 chemicals with positive and negative cancer predictions, Ames mutagenicity predictions and in vivo mutagenicity predictions is graphed. “0.0” are the negatives and “1.0” are the positives. Approximately half of the chemicals in cluster 51 are predicted positive for carcinogenicity as can be seen from the graph in the upper left part of figure 6. Almost all chemicals are predicted negative in the Ames model (upper right part), and all chemicals are predicted negative for in vivo genotoxicity (lower left part).
I.e. according to the model predictions from models for cancer and genotoxicity, some of the chemicals in this steroid cluster are carcinogens, but probably with a non-genotoxic mechanism. It is well-known that some steroids can cause cancer through a hormonal non-genotoxic mechanism[13].
Figure 7. Distribution of cancer predictions (FDACALL), Ames mutagenicity (AMESCALC) predictions and in vivo mutagenicity (M_1) predictions in cluster 51
The picture of a non-genotoxic mechanism is confirmed in figure 8 and 9, where the chemicals predicted to be negative (figure 8) and positive (figure 9), respectively, for Ames mutagenicity are highlighted in yellow. Both the predicted Ames positive and negative chemicals are evenly distributed between the chemicals predicted positive and negative for cancer, i.e. there’s no significant relation between Ames positive and positive cancer predictions, this confirms that the chemicals in cluster 51 are not likely to be carcinogenic by a genotoxic mechanism.
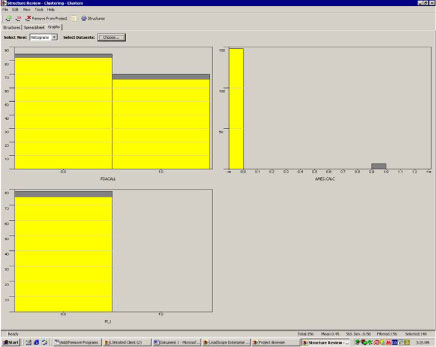
Figure 8. Distribution of Ames negatives among the carcinogenicity and in vivo mutagenicity predictions
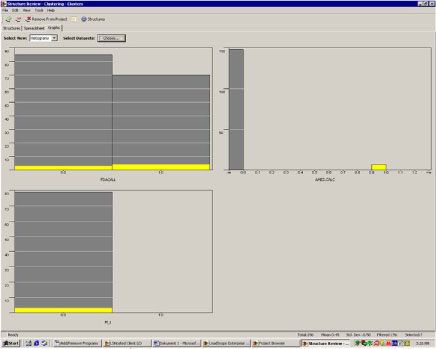
Figure 9. Distribution of Ames positives among the carcinogenicity and in vivo mutagenicity predictions
The seven chemicals predicted to be positive for Ames mutagenicity are shown in figure 10. All of them contain additional reactive fragments such as the diketone, the hydroperoxy group, and the strained 3-member ring (epoxide). By inspection the chemicals look like potential genotoxic compounds by electrophilic mechanisms, not because of the steroid part of the structures but rather because of the additional reactive fragments.
Figure 10. The seven steroid chemicals predicted positive for Ames mutagenicity
Structural identifiers for carcinogenicity of steroids
In the following, LeadScope was asked to find rules about chemical feature combinations that can be used to discriminate between positive and negative cancer predictions within the cluster of 156 steroid chemicals.
Figure 11 shows the generated fragment combination tree. The interpretation of the colours of the boxes is given in the bottom right corner; red box again means over-representation of chemicals with positive cancer predictions, green boxes means over-representation of non-cancer predictions, etc.
Figure 11. A fragment combination tree within the steroids (red means over-representation of positive cancer predictions)
In figure 12, the red box is marked and the rules leading to classification into this box appears in the bottom windows. As it appears, a positive prediction in the steroid cluster is associated with the 17-hydroxy-steroid skeleton (lower left window) and an unsaturated ketone ring (lower right window). There are 18 chemicals in the selected box.
Figure 12. A positive prediction is associated with the 17-hydroxy-steroid skeleton (left) and an unsaturated ketone ring, cyclohexenone, (right)
The 18 chemicals in the red box are given in figure 13. The highlighted part of the structure is the combination of the two structural features; the steroid fragment and the unsaturated ketone ring. The cancer predictions, FDA calls “1.0”, “0.0” or “?”, for cancer are shown in the upper left corner for each chemical. 14 of the 18 chemicals are predicted positive for cancer, 3 are predicted negative and 1 is equivocal/out-of-domain. In other words, this simple rule, i.e. a combination of a 17-hydroxy-steroid skeleton and an unsaturated ketone ring, has a discrimination of 14:3 (not including the out-of-domain prediction) for predicting whether a chemical is predicted to be carcinogenic by the Multicase FDA cancer models. In other words, based on the 17 chemicals with robust cancer predictions, this rule has a Positive Predictive Value (PPV) of 14*100%/17=82%.
Figure 13. Overlay of steroids containing the two structural combinations
Characterizing non-carcinogenic steroids
Of the remaining 138 chemicals in cluster 51, 132 were predicted negative for cancer. Some of these are shown in figure 11. This gives the rule of structure combinations of steroid skeleton plus cyclohexenone a discrimination of 132:6 for predicting whether a chemical is not predicted to be carcinogenic by the Multicase FDA cancer models. In other words, based on the 138 chemicals, this rule has a Negative Predictive Value (NPV) of 132*100%/138=97%.
Figure 14. 132 out of the 138 substances are predicted negative for cancer
LeadScope also identified another rule for discrimination between positive and negative FDA cancer predictions as shown in figure 15 (red box). This rule combines a distance between two hydrogen bond acceptors (HBA) and a cyclohexenone fragment. 6 chemicals had this structure combination, of which 4 were predicted positive for cancer according to the Multicase FDA cancer models. This gives a discrimination for positives of 4:2, or in other words, based on the 6 chemicals, this rule has a Positive Predictive Value (PPV) of 4*100%/6=67%.
Figure 15. Another feature combination (6 structures) within cluster 51
The 6 chemicals are given in figure 16, with the FDA cancer calls in the upper left corner for each chemical.
Figure 16. 4 of the 6 structures are predicted positive for cancer
[9] 1. Roberts G., Myatt G.J., Johnson W.P., Cross K.P., Blower P.E., ”LeadScope: Software for Exploring Large Sets of Screening Data”, J. Chem. Inf. Comput. Sci., 2000, 40 (6), 1302-1314.
[10] J. Matthews and J.F. Contrera. A new highly specific method for predicting the carcinogenic potential of pharmaceuticals in rodent using enhanced MCASE (Q)SAR-ES software. Reg. Toxicol. and Pharmacol. 28 (1998) pp. 242-264.
[11] Positive according to the FDA ICSAS methodology corresponds to two or more positive cancer calls, accepting only predictions for chemicals without significant deactivating fragments. See footnote 2 for reference.
[12] The criteria for the overall call for genotoxicity is the one used for advisory classifications and described in 3.1 Mutagenicity; positive experimental test result in at least one training set or positive predictions in at least two models.
[13] E.g. Lima, B.S., Van der Laan, J.W.; ”Mechanisms of Nongenotoxic Carcinogenesis and Assessment of the Human Hazard”, Reg. Tox. and Pharm. (2000) 32, 135-143.
Version 1.0 March 2010, © Danish Environmental Protection Agency