The Greenhouse gases: HFCs, PFCs and SF6
1 Summary
1.1 Danish consumption and emission of F-gases
1.1.1 Consumption
HFCs
In 2008, the total import (minus re-export) of pure HFCs and HFC blends was estimated to 399.4 tonnes. Compared to 2007, where total import was 403.2 tonnes, the import has decreased with 3.8 tonnes.
The 2008 import of HFC-134a increased slightly with 3.8 tonnes compared to 2007 with a total consumption of 164.5 tonnes. The consumption is a bit higher within production of household fridge and freezers in 2008 compared to 2007 and the consumption related to commercial refrigerants has a small reduction.
The import of HFC-404A is reduced with 15.8 tonnes compared with 2007. The total consumption is 114.1 tonnes in 2008. The reduction is coursed by reduction of consumption in commercial refrigeration system.
Import of HFC-407c increased with 26.3 tonnes to 76.8 tonnes in 2008. HFC-407c is a substitute refrigerant for HCFC-22 in refrigerators. Over the last decade there has been an overall increase in import of HFC-407c but the development in consumption has not been stabile and some of the increase can be caused by a number of older refrigeration systems with HCFC-22 are phased out.
There has been no clear reduction in consumption of main refrigerants in 2008 (HFC-134a, HFC-404A and HFC-407c).
SF6
The overall consumption of SF6 in 2008 was approx. 5.9 tonnes. Consumption of SF6 was used for power switches in high-voltage power systems and laboratories. This is a small increase compared with 2007.
PFCs
The Danish consumption of PFCs (per fluoropropane) in 2008 was 0.5 tonnes. The PFC consumption in 2008 derives from to areas:
- optics fibre production
- refrigerants in commercial refrigeration
1.1.2 Emission
The GWP-weighted actual emissions of HFCs, PFCs, and SF6 in 2008 were 895.7 thousand tonnes CO2 equivalents and the emission has increased compared to 2007, where the corresponding emissions were 884.4 thousand tonnes CO2 equivalents as reported in /27/. A new source – Medical Dose Inhalotors - was introduced in the F-gas inventory. Comparing the new time series in this report the 2007 value is 894.3, so the 2008 value is a very little increase only.
The total emission in 2008 has increased for HFCs but decreased for PFCs. The emission of SF6 is increased a little since 2007.
The increase in emissions for HFCs is in particular occurring from increased emissions of HFC-404A and increased emissions of HFC-134a from stock in commercial refrigerants.
In Table 1.1, consumption, actual emissions and stock in products are summarised.
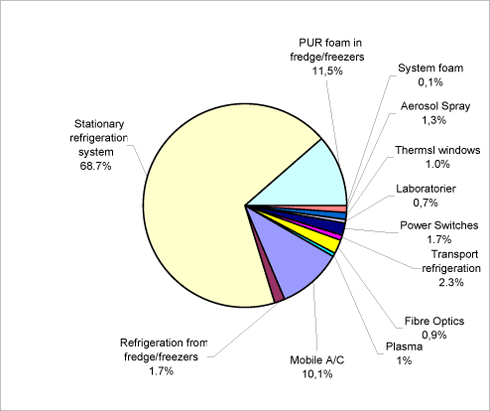
In Figure 1.1, the relative contributions of HFCs, PFCs, and SF6 to the total emission in CO2-equivalents are shown for application areas for 2008.

Figure 1.1 The relative distribution of GWP emissions, analysed by application area, 2008
The figure shows that emissions from refrigerants used in commercial stationary refrigerators account for the largest GWP contribution. These refrigerators cover 68.7 per cent of the total actual contribution in 2008. The major contribution is from HFC-404A.
The second-largest GWP contribution, accounting for 11.5 per cent, is emission from release of HFC-134a stock in insulating foam in fridges and freezers.
Emissions of HFC-134a from mobile A/C contribute with 10.1 per cent and emissions of HFC-134a and HFC-404A from transport refrigeration contribute with 2.3 per cent of the total GWP contribution.
The three sources of SF6 emissions in 2008 were power switches, double glazing windows and laboratories/fibre optics. These account for 3.3 per cent of the total GWP contribution.
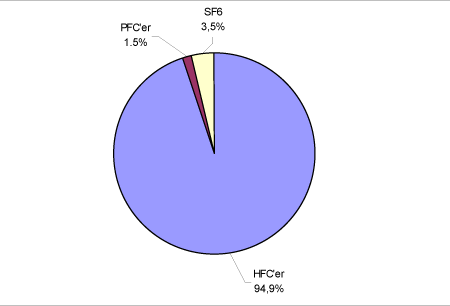
HFCs contribution is estimated to comprise 94.9 per cent of the overall GWP contribution in 2008, Emissions of SF6 comprise 3.5 per cent and emissions of PFC contribute with 1.5 per cent of the total emission.
The relative distribution is shown in Figure 1.2.

Figure 1.2 The relative distribution of the GWP contribution from HFCs, PFCs, and SF6, 2008.
HFC’s
Actual emissions from HFCs have been calculated to 851 373 tonnes CO2 equivalents. In 2007, emissions were 838 724 tonnes CO2 equivalents, refer /27/. It is an increase of approx. 12 650 tonnes CO2 equivalents.
The actual emission from HFCs has increased to its highest level since HFCs has been monitored.
SF6
Actual emissions have been calculated at 1.3 tonnes, equivalent to a GWP contribution of 31 599 tonnes CO2 equivalents. In 2007, emissions were
30 347 tonnes CO2 equivalents, refer /27/.
PFCs
The emission of PFCs origins from PFCs in production of fibre optics and stock emission from commercial refrigeration containing HFC-413A. The total GWP-weighted PFC emission is 12 791 tonnes CO2 equivalents.
1.1.3 Trends in total GWP contribution from F-gases
Figure 1.3 shows the trend in Danish GWP contributions from HFCs, PFCs, and SF6 for 1992-2008. The differences from the present calculations of the total GWP value compared with earlier calculation methods are illustrated in the figure.

Figure 1.3 Trends in GWP-weighted potential, actual and adjusted actual emissions 1992-2008, 1.000 tonnes CO2 equivalents.
The figure shows that the GWP emission has continued the increase started in 2001 and reached the highest level for calculation of actual emissions. The increase curve from 2007 to 2008 is stagnant and the smallest yearly increase since 2001.
The development in the GWP contribution 1992-2008 can also be seen in Table 1.2 below. A new source is added in the 2008 emission calculation. The new source is MDI, which contain an increasing amounts of HFC-134a as blowing agent.
| Potential | Actual | Actual, adjusted imp/exp. |
New actual, adjusted imp/exp. |
New Actual adjusted imp/exp. Including new source |
|
|---|---|---|---|---|---|
| 1992 | 400 | ||||
| 1993 | 800 | 230 | |||
| 1994 | 1300 | 263 | |||
| 1995 | 1600 | 480 | 344 | ||
| 1996 | 1700 | 520 | 435 | ||
| 1997 | 1700 | 560 | 472 | ||
| 1998 | 625 | 577 | 564 | ||
| 1999 | 700 | 683 | |||
| 2000 | 818 | 793 | |||
| 2001 | 699 | ||||
| 2002 | 719 | ||||
| 2003 | 745 | ||||
| 2004 | 797 | ||||
| 2005 | 829 | ||||
| 2006 | 865 | ||||
| 2007 | 884 | ||||
| 2008 | 886 | 896 |
Version 1.0 March 2010, © Danish Environmental Protection Agency