The Greenhouse gases: HFCs, PFCs and SF6
4 Emission of F-gases
This section reports the actual emissions of the greenhouse F-gases HFCs, PFCs, and SF6 for 2008. All emissions are calculated as actual emissions according to IPCC’s tier 2 methodology. Thus, a new source (MDI) is included in the 2008 emission calculation.
The calculation is based on the reports on consumption of these substances analysed by application areas (section 3.2). For relevant product groups, adjustments have been made for imports and exports of the substances in products (see also chapter two for principal description of methodology). The specific emission calculation refers to appendix 4 which shows the particular emission factors, calculation method and assumptions, determination of IPPC Tier method etc., in relation to calculation of emissions from individual substance and application areas /4, 16/.
The total GWP-weighted actual emission of HFCs, PFCs, and SF6 in 2008 is calculated to 895.8 thousand tonnes CO2 equivalents. The corresponding emissions in 2007 without emissions from MDI were approx. 884.4 thousand tonnes CO2 equivalents. In absolute figures it corresponds to a calculated total increase of approx. 11.4 thousand tonnes CO2 equivalents, but if emissions from the new MDI source is included (approx. 10 thousand tonnes in 2008) the different between 2007 and 2008 is limited.
The consumption and GWP contribution for HFCs, PFCs, and SF6 for 2007 (without new MDI source) and 2008 are shown in the table below.
| Substance group | Consumption 2007, tonnes |
Consumption 2008, tonnes |
GWP contribution 2007, tonnes |
GWP contribution 2008, tonnes (including new MDI source) |
|---|---|---|---|---|
| HFCs | 403.2 | 454.4 | 838 724 | 851 373 |
| PFCs | 0.7 | 0.5 | 15 362 | 12 791 |
| SF6 | 5.4 | 5.8 | 30 347 | 31 599 |
| Total | 884 434 | 895 763 |
The HFC emission from commercial refrigerators (HFC-134a, HFC-404A and HFC-407c) increased in 2008 as compared to 2007. The increase is coursed solely by stock emission from the commercial refrigerants.
4.1 Emissions of HFCs from refrigerants
As required in the IPCC guidance for calculation of emission of f-gases a distinction is made between:
- Fridges and freezers for household use and retailers etc.
- Commercial refrigeration (in industry and retail) and stationary air conditioning systems
- Mobile air conditioning systems (in cars, trucks, bus, trains etc.)
- Mobile refrigeration systems (in vans and lorries)
Actual emissions from these sources occur in connection with:
- filling of refrigerants (emission is 0.5 percent to 2 per cent of refilled amount depending on application area).
- continual release during the operational lifetime. An assumed average value which account operational leakage including release occurring as a result of accident and damage (depending on application area, the average yearly emission differ from 10 percent to 33 percent).
Release resulting from disposal of items and equipment in the applications is not calculated as a contribution to the total f-gas emissions in Denmark because Danish legislation ensures that management and treatment of refrigerants prevent uncontrolled emissions. Thus, disposal in Denmark is stated as an activity in the calculations where zero emission occurs and this principal statement are used in order to reduce stock (the quantity of substances contained in a product after end life time).
Appendix 3 shows the specific emission factors used in the calculations.
Commercial refrigeration and stationary A/C systems
Commercial refrigeration, used e.g. in retail, supermarket, restaurants etc. or in industry, and stationary A/C systems, also used by retailers and industry, as well in offices, constitute the largest source of emissions. The most commonly used refrigerants in this product group are HFC-134a, HFC-404A and HFC-407c, where HFC-404A stands for the majority of the consumption and emissions in 2008.
In addition, use of the refrigerants HFC-408a, HFC-409a, HFC-410A, and HFC-507c is less common, and HFC-401A and HFC-402A are phased out in Denmark because of the substances contents of ozone depleting substances.
It is not relevant to adjust for imports and exports of HFCs in stationary commercial refrigeration and stationary A/C systems since filling of refrigerants only will take place on site when the units are installed.
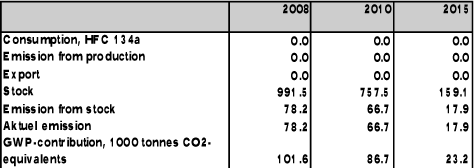
Table 4.2 shows the consumption, stock and actual emission for 2008 for the main HFC substances used in Danish commercial refrigeration systems. Emissions for HFCs have been converted to CO2 equivalents in order to take into account the different GWP values of the substances and emission for 2010, 2015 and 2020 in a future scenario is also shown.
The projected future scenario takes into account the effect of a statutory order on phasing-out HFCs etc. and the effect of taxes on F-gases. As the tabel indicates the emissions from commercial refrigeration will continue in several years even there are no installations of new HFC refrigeration systems because of the statutory order which not allow construction of new installations (larger than 10 kg HFC) after 1. January 2007. In the trend analysis, the total emission from this sector is estimated to more than 340 000 tonnes CO2 equivalents in year 2015. But after then a significant reduction is expected and in year 2020 most HFC refrigeration systems is considered phased out.
Refrigerators/freezers
Actual emissions from refrigerants in refrigerators and freezers are determined on the basis of consumption adjusted for imports and exports of HFCs. The calculation assumes that the refrigerant is removed and treated upon disposal so that no emission occurs (see appendix 3).
When adjusting for imports and exports, the estimates of imports/exports in Environmental Project no. 523 are used /2/. In this case, exports are assumed to comprise 50 percent of the consumption pr. year. The calculation is made on the basis of Statistics Denmark's foreign trade statistics /3/ of average figures of the amount of HFC-134a in a standard fridge/freezer manufactured in 1999. This figure has not been updated
Table 4.3 below shows actual emissions from refrigerators/freezers in 2008, 2010 and 2015.
Total emissions of HFC-134a and HFC-404A refrigerants from refrigerators/freezers in 2008 were estimated to 15 100 tonnes CO2 equivalents. In the future scenario of actual emissions, it is estimated that the total emission in 2015 will decrease to 9 600 tonnes CO2 equivalents coursed by a decreasing stock.
Mobile A/C
Emissions from mobile A/C systems are mainly due to leakage and accident damage.
The calculation has been adjusted for import and re-export of HFC-134a, which is the only HFC imported in A/C systems in cars, vans and trucks. In Denmark, the consumption of HFC-134a for mobile A/C systems is used solely for refilling. Initial filling is carried out by car manufacturers in the country of production.
The assumptions used in the calculation of emission and stock in mobile A/C systems appear from Table 4.4. The assumptions have been adjusted according to individual statistical categories for types of transport and they represent estimated values based on information from car importers and refrigerator service enterprises /16/.
| Percentage of vehicles with A/C, % |
Filling pr vehicle kg HFC-134a |
Percentage of vehicles that undergo A/C maintenance, % |
|
|---|---|---|---|
| Cars | 10 | 0.75 | 50 |
| Busses | 20 | 9 | 20 |
| Vans | 10 | 0.8 | 50 |
| Trucks | 50 | 1.5 | 40 |
Table 4.5 shows a projection of the calculated actual emissions from mobile A/C systems and the parameters associated with the calculation.
Within the next five years, emission from mobile A/C is assumed to be the application area with the largest emission of HFC-134a in Denmark.
Vans and lorries with transport refrigeration system
There are an estimated 5 500-6 000 refrigerator vans and lorries in Denmark /16/. These require an average filling of about 8 kg, equivalent to approx. 46-49 tonnes refrigerants (HFC-134a, HFC-404A or HCFC-22) for the total stock in vans and lorries.
Actual emissions from mobile refrigeration systems in vans and lorries in 2008 are stated in the Table 4.6.
There has been no consumption of HFC-402A for refrigerator vans and lorries since this substance has been banned for use in both new and old installations. But the emission from stock is still about 0.2 tonnes HFC-402A, corresponding to 290 tonnes CO2 equivalents.
The total actual emission from mobile refrigeration systems in vans and lorries was estimated to 18 589 tonnes CO2 equivalents in 2008 which is a decrease compared to the 2007 estimate.
4.1.2 Emissions of HFCs from PUR foam products and propellants
Tree calculation principles have been applied in the calculation of emissions of HFCs used in Polyurethan (PUR) foam plastic products, depending on the type of product:
- Hard PUR foam plastics (closed cell)
- Soft PUR foam plastics (open cell)
- Polyether foam (closed cell)
The calculation principles are summerized in table 4.7 below and in appendix four.
| Hard PUR foam | Soft PUR foam | Polyether foam | |
|---|---|---|---|
| Release during production, % | 10 | 100 | 15 |
| Annual loss, % | 4.5 | - | 4.5 |
| Lifetime, years | 15 | - | 1-10 |
Insulation foam
There is no longer production of HFC based hard PUR insulation foam in Denmark. This production has been banned in statutory order since 1. January 2006.
The import of HFC-134a in products with PUR insulation foam, e.g. household fridges and freezers, is considered to 0 in 2008. This assumption is difficult to verify and no applicable method seems available.
The calculation of actual emissions are therefore only from existing stock of household fridges and freezers.
Actual emissions of HFC-134a from insulating foam are summarised in Table 4.8.
Table 4.8 Calculation parameters and emissions of HFC-134a from insulating foam for 2008, 2010 and 2015, tonnes
In the projection scenario for 2010 and 2015, it is estimated that the stock will be reduced significantly in 2015 as a result of the phase-out of HFC-134a as blowing agent and from 2018 it is estimated that there will be no more actual emissions from this source.
Aerosol sprays
Emission of HFCs from their use as aerosol spray is estimated as 100 per cent of the consumption in the year of application /4/. Emissions from this use occur during consumption after calculation of imports and exports.
Total emission from this areas amounts in 2008 to 7.1 tonnes of HFC-134a corresponding to 9 165 tonnes CO2 equivalents. Compared with 2007, emission estimates have decreased by approx. 1 700 tonnes CO2 equivalents.
Medical Doze Inhalers (MDI)
The emission of HFC-134a from medical doze inhalers is estimated as 100 per cent of the consumption in the year of application. Calculation of emission from MDI is based on yearly statistics from Danish Medicines Agency. A survey has determined that HFA (HFC 134a) has been fully introduced in all MDI on the Danish market, since 2007. The average contents is 72 mg/pr. doze.
The total emission in 2008 from MDI was 7.23 tonnes of HFC-134a corresponding to 9 398 tonnes CO2 equivalents. A time-series of the emission of HFC-134a from MDI has been included the F-gas inventory since the application was registered in 1998.
Optical fibre production
Both HFC and PFC are used for technical purposes in Danish optics fibre production.
HFC-23 is used as a protection and cleaning gas in the production process. The emission factor is therefore determined as 100 per cent release during production. The actual emission from HFC-23 is 1 404 tonnes CO2 equivalents in 2008.
4.1.3 Emissions of sulphur hexafluoride
The total emission of SF6 in 2008 has been calculated to 1.3 tonnes, equivalent to a GWP contribution of 31 599 tonnes CO2 equivalents.
Emissions derive from three sources - power switches, double-glazed windows and laboratories.
Double-glazed windows
Use of SF6 in double-glazed windows was phased out in 2002, however, there are still emissions from stock in existing double-glazed windows in Danish buildings. The stock is estimated from consumption data from Danish producers of double-glazed windows 1992-2002 and life time for double-glazed windows are determined to 20 years.
Emissions from double glazed windows are calculated on following factors:
- 15 per cent emission from production
- 1 per cent gradual emission from stock pr. year
- 65 per cent emission when disposal after 20 years
Table 4.9 Calculation parameters and emissions of SF6 from double-glazed windows for 2008, 2010 and 2015, tonnes
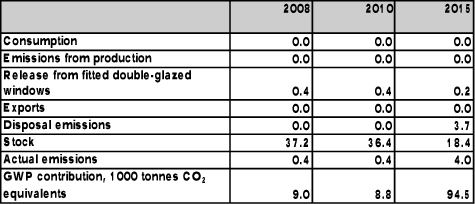
SF6 emissions from existing double-glazed windows will increase in the coming years because of end of life and disposal of old windows containing SF6. The future scenario for GWP contribution from double-glazed windows in 2015 shows an increase to 94.5 ktonnes CO2 equivalents to be compared with 9.1 ktonnes CO2 equivalents in 2008.
Power switches in high-voltage transmission stations
Power switches are filled or refilled with SF6, either for new installation or during service and repair. Filling is usually carried out on new installations and a smaller proportion of the consumption of SF6 is due to refilling /11/.
Emissions from power switches in high-voltage transmission systems are calculated due to the processes involved in the following way:
- release of 5 per cent on filling with new gas (average figure covering normal operation and failure/accidents)
- gradual release of 0.5 per cent from the stock (average figure covering normal operation and failure/accidents)
- release of 5 per cent from drawing off and recycling used gas (average figure covering normal operation and failure/accidents)
These figures are determined in a report of Danish SF6 use in high-voltage power switches /11/.
No emissions are assumed to result from disposal since the used SF6 is drawn off from the power switches and is either re-used internally by the company concerned, or re-used externally through means of a collection scheme. Emissions resulting from external re-use are determined on the assumption that 0.5 per cent of the annual stock is sent for external re-use.
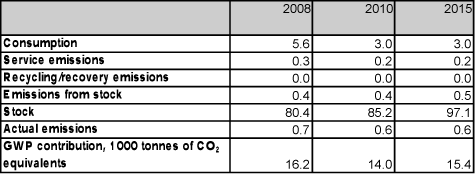
Table 4.10 shows the amounts involved in the processes leading to emissions and calculated actual emissions from SF6 power switches.
Table 4.10 Calculation parameters and emissions of SF6 from power switches in high-voltage plants 2008, 2010, and 2015, tonnes
Laboratory purposes
Consumption of SF6 in laboratories covers two purposes:
- Plasma erosion in connection with the manufacture of microchips in clean-room laboratories
- Analysis purposes to a limited extend.
The emission is calculated to 0.27 tonnes SF6 in 2008 and it was primary for plasma erosion purpose. The emission is 100 % release during consumption and equivilizes 6 450 tonnes CO2 equivalents.
4.1.4 Emissions of per fluorinated hydrocarbons
Commercial refrigerators
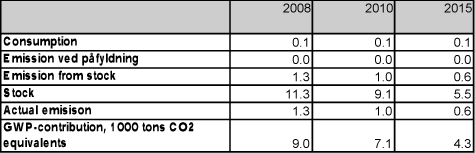
The PFC emissions from commercial refrigerators occur from stock and from a smaller use of PFC-14 (R413A which contain 9 % perfluorinated hydrocarbons). The actual GWP-weighted emission from this source is 9 044 tonnes CO2 equivalents, which is a further reduction compared to the last six years.
Stock in commercial refrigerators has been estimated at about 11.3 tonnes in 2008 and trend is going toward phasing out units using HFC blends with PFC refrigerants.
The emission calculations use the same parameters as described for HFC emissions from commercial refrigerators (see appendix 3). Refrigerants containing PFC are only used in stationary refrigerators. Therefore no estimates for imports and exports are relevant.
Table 4.11 Calculation parameters and emissions of PFCs from commercial refrigerators in 2008, 2010 and 2015, tonnes
Optical fibre production
The PFC emission from optics fibre production has decreased in 2008. This sector use PFC-14 and PFC-318 for technical purpose in optics fibre production.
The PFCs are used as a protection and cleaning gas in the production process. The emission factor is therefore determined as 100 per cent release during production. The actual emission from PFC-14 and PFC-318 is estimated to 3 747 tonnes CO2 equivalents in 2008.
Version 1.0 March 2010, © Danish Environmental Protection Agency