Natural gas for ship propulsion in Denmark
3 Substituting with natural gas in shipping in Denmark
- 3.1 The setting in Denmark – what is the potential?
- 3.2 Estimation of potential in short sea shipping
- 3.3 Scenarios for natural gas conversion
- 3.4 Summary on the potential for conversion in Denmark
3.1 The setting in Denmark – what is the potential?
Denmark is often considered an island nation, despite the fact that the main peninsula Jutland is connected to the European continent. However, with approximately 440 named islands and islets of which 71 are populated shipping and ferry industry is an important supplier of domestic freight and passengers transport, and as Denmark is situated in the strait connecting the Baltic Sea with the North Sea passenger and ferry routes criss-cross the waters to connect with our neighbours.
Approximately half a million ship calls occur in the Danish ports every year and 95% of them are related to ferry operations[11] and 5% are related to cargo ships as seen in Table 3-1.
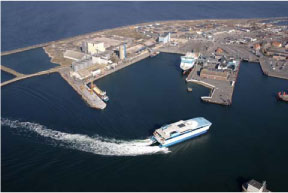
Figure 3‑1 The fast ferry Villum Clausen, Bornholmstrafikken
| 2007 | % in 2007 | 2008 | % in 2008 | |
|---|---|---|---|---|
| Ship calls total | 545249 | 552217 | ||
| Cargo ship calls | 28423 | 5.2 | 26120 | 4.7 |
| Ferry calls | 516826 | 94.8 | 526097 | 95.3 |
The potential for conversion to natural gas is identified in this chapter following two tracks: one for ferries and one for cargo short sea shipping. For both the key indicators are fuel consumption on the vessels (summing this up to routes) and the attribution of the fuel consumption to the relevant number of ports obviously focusing on the largest contributors. In this way the number of vessels/routes that eventually need retrofits or newbuilds and ports needing fuelling stations/storage are estimated and combined in scenarios to reflect various development projections.
3.1.1 Identifying large fuel consumers - ferry routes and major ports
In 2008, almost 10 million passengers were transported by ferry within the borders of Denmark. 31% were transported on the East-West routes mainly between Zealand and Jutland and 69% of the transportation of passengers was between smaller islands and across fjords and straits.
The main Danish ferry routes[12] are seen in figure 3-1, however, the project does address other minor routes.

Figure 3‑2 Map of main ferry routes (from Danish Shipowners’ Association)
The ferries and ports of interest concerning conversion of ferries to natural gas and establishment of storage/bunkering facilities will include those with the largest consumption. It is therefore essential to identify the energy consumption on each ferry route in Denmark and the present assessment includes the local and smaller island ferries, the regional ferry sector and the ferry routes to our closest neighbours such as Sweden, Norway and Germany.
 The port with the highest number of calls is not necessarily the port that has the largest energy consumption.
The ferry route Venø-Klippen has more than 24,000 port call annually but each voyage is only 266 meters.
The estimated fuel consumption of vessels operating on the routes can be found based on the data of the ferries installed power[13] combined with a few assumptions as outlined below.
Estimation of fuel consumption
The fuel consumption for each ship is estimated from the equation found below by summarizing the product of engine load (MCR%), main engine size (kW), AIS signal time interval (s) and fuel consumption factor (g/kWh)[14]:
![]()
where E = fuel consumption, %MCR = engine load (%), Δt = Sailing time (s), PME = main engine power (kW), EF = specific fuel consumption factor (g/kWh), I = AIS signal interval, k = fuel type, l = engine type, x = calculation year. The MCR is set to 75% and the specific fuel consumption factor is set to 220g/kWh. With a fixed fuel consumption factor it does not distinguish between engine types and this will tend to underestimate fuel consumption in gas turbine powered vessels, such as fast ferries.
The fuel consumption for ships calling the same port is summarised and the total energy consumption for the respective port is found. Obviously, a minimum of two ports are involved in ferry operations, and the energy consumption is assigned to the major port or to the port with the most routes to ensure the least challenges in supply of natural gas and bunkering facilities.[15]
3.1.2 Ferries calling Danish ports
3.1.2.1 Ferries with Danish registered company or flag
The table 3-2 below lists the 20 ports with ferry routes consuming more than 1,000t fuel in total for the port. The list includes Danish flagged or owned ferries and it is not suprising the large ferries, fast ferries and the long distance routes that qualify. A more detailed list can be seen in appendix 5.
| Port | Ferries | Number of ferries | Total fuel consumption (t/y) |
|---|---|---|---|
| Sjællands Odde Havn | Mai Mols, Mie Mols, Max Mols | 3 | 65000 |
| Rønne Havn | Hammerodde, Dueodde, Povl Anker, Villum Clausen | 4 | 57000 |
| Rødby Færgehavn | Prinsesse Bennedikte, Prins Richard, Deutchland, Schleswig-Holstein | 4 | 55000 |
| Københavns Havn | Crown of Scandinavia, Pearl of Scandinavia | 2 | 41000 |
| Gedser Havn | Prins Joakim, Kronprins Frederik | 2 | 40000 |
| Hirtshals Havn | Bergensfjord, Fjord Cat | 2 | 35000 |
| Helsingør Havn | Tycho Brahe, Hamlet , Aurora af Helsingborg, , Mercandia IV | 4 | 28000 |
| Esbjerg Havn | Dana Sirena, Norrøna (Winter), Fenja, Manja | 4 | 27000 |
| Århus Havn | Maren Mols, Mette Mols, | 2 | 20000 |
| Hanstholm Havn | Norrøna (Summer) | 1 | 9400 |
| Hou Havn | Kanhave, Vesborg, Tunøfærgen | 3 | 6200 |
| Tårs Havn | Spodsbjerg, Odin Sydfyn, Frigg Sydfyn | 3 | 3600 |
| Frederikshavn Havn | Margrethe Læsø, Ane Læsø | 2 | 3500 |
| Kalundborg Havn | Kyholm | 1 | 2500 |
| Svendborg Havn | Ærøskøbing, Højesten | 2 | 2400 |
| Fynshav Havn | Thor Sydfyn, Skjoldnæs | 2 | 2100 |
| Rudkøbing Havn | Marstal, Stryboen | 2 | 1900 |
| Havnsø Havn | Sejerøfærgen | 1 | 1100 |
| Horsens Havn | Endelave | 1 | 1100 |
| Stigsnæs Havn | Omø, Agersøfærgen | 2 | 1000 |
The largest energy consumption occurs at Sjællands Odde port. There are three fast ferries, Mai Mols, Mie Mols and Max Mols in operation that have large fuel oil consumption due to the high speed and the distance on the ferry route between Sjællands Odde and the ports of Ebeltoft or Århus. The second most energy consuming ferry is the fast ferry Villum Clausen, which has port calls in Rønne and Ystad (Sweden).
Also the port of Rødby is a large contributors with the frequent ferries at the Rødby færgehavn route to Germany despite not being fast ferries. The ferries are the sister ships Prinsesse Bennedikte, Prins Richard and the sister ships M/V Deutchland and M/V Schleswig-Holstein, which are operated by Scandlines. Beside these ferries M/V Holger Danske operates from Rødby port with dangerous cargo when required.
The DFDS Seaways Crown of Scandinavia and Pearl of Scandinavia have large fuel consumption due to the relatively long distance from Copenhagen to Oslo and the installed engine power of the ships. Also, Gedser port has significant large fuel consumption on the route between Gedser and Rostock.
3.1.2.2 Ferries with foreign ownership or other flags
Since the majority of the routes are domestic most ferries are operated under Danish flags and companies registered in Denmark operate the transboundary routes included above. However, there are routes operated by companies abroad with vessels under German, Swedish or Norwegian flags. The inclusion of these is analysed in the table below.
| Port | Ferries | Number of Ferries | Total fuel consumption |
|---|---|---|---|
| Frederikshavn Havn | Stena Line Express, Stena Dania, Stena Jutlandica, Stena Saga | 4 | 82000 |
| Hirtshals Havn | Superspeed I, Superspeed II | 2 | 67000 |
| Grenaa Havn | Stena Nautica | 1 | 11000 |
| Havneby Havn (Rømø) | SyltExpress | 1 | 3500 |
The type of ferries and the distances covered by these international routes vis- a-vis the engine power installed onboard adds significantly to the picture of ferries’ fuel consumption in Denmark. Now, the port of Frederikshavn has by far the largest consumption and Hirtshals is also larger than Sjællands Odde Havn due to the routes to Norway and Sweden. The potential for reducing the emissions by converting to natural gas because of the large fuel consumption is considerable and adding nearly 150,000 ton in only two ports. However, LNG bunkering infrastructure is more advanced in the ports of destination routes and for the purpose of the present study it is assumed that the natural gas (LNG) facilities will be placed there rather than in Denmark. There may, however by technical or safety reasons justifying storage/bunkering in both ports of call that would allow for this conversion to be included at a later stage.
3.2 Estimation of potential in short sea shipping
The number of port calls for cargo ships entering Danish ports is approximately 5% of the total number of port calls and that includes all cargo ships such as the large container ships, bulkers, tankers and general cargo ships. No statistics are available specific for the short sea traffic be it tramp or line. The detailed information on this section is found in appendix 5.
3.2.1 The number of ports in short sea shipping
The relevant cargo ports have been identified as those having the largest cargo turnover per year, but information on main import-export ports is not directly related to short sea shipping and to identify the ports with short sea line traffic a number of ports was contacted. However, the dataset on short sea shipping was based mainly on the number of short sea cargo routes operating in the ports identified in a study by Danske Havne (2008).
| Port | Cargo volume (in 1,000 ton) |
|---|---|
| Fredericia Havn | 14426 |
| Århus Havn | 9200 |
| Københavns Havn | 6984 |
| Esbjerg Havn | 3664 |
| Odense Havn | 3170 |
| Aalborg Havn | 3167 |
| Aabenraa Havn | 1815 |
| Randers Havn | 1375 |
| Kolding Havn | 1268 |
| Rønne Havn | 1236 |
The present study has also investigated the potential of short sea line traffic based on the information available from a number of sources in the Danish sector engaged in short sea shipping. The three large providers[16] of short sea shipping and the Danish Shipowners’ Association[17] was interviewed with respect to the number and type of short sea line traffic in relation to the conversion to LNG and installation of storage and bunkering facilities in ports. The interviews revealed that the line traffic is less fixed that anticipated and that changes to the routing occur occasionally.
Product and power plant ports
Product ports such as Statoil port, Aalborg Portland port or Stålvalseværkets port are not included in the evaluated ports for short sea line traffic since the cargo ships although often calling regularly call relatively rare and serve other ports in the interval. This also includes the ports serving power plants with coal. Actually, the import of coal for Enstedværket makes the port one of the largest in Denmark when it comes to cargo volume.
Product port
Interview with Michael Hetland at Statoil port revealed that the product tankers calling the port are operated in the United Kingdom for a period of up to six month before returning.
The Danske Havne study
Danske Havne is the national association of commercial ports with 80 active ports in Denmark, Faroe Islands and Greenland. The short sea shipping operating in the member ports includes feeder ships, RoRo cargo[18], Roll on-Roll off Passenger (RoPax), general cargo, tanker, bulkers etc. To identify the short sea line traffic, which operates from the Danish ports, a list of routes from a study performed in 2007-2008 was provided by Danske Havne (2008).
Because the study had focus on container traffic, general cargo and the RoRo shipping sector the ports servicing the bulk trade with e.g. agricultural products, construction materials, timber, scrap, etc. were not included in the Danske Havne study. This would concern the ports in e.g. Randers, Vejle, Horsens, Aabenraa, Odense, and several more, but the presence of line traffic or the actual volumes involved are not known. To accommodate this uncertainty we have added three undisclosed ports to the 11 ports identified in Dansk Havne’s study bringing the total number of ports to 14 involved in short sea line shipping[19].
In addition to the three unnamed ports, the main short sea shipping ports (in alphabetical order) are:
- CMP/Copenhagen
- Esbjerg
- Fredericia/Associated Danish Port (ADP)
- Frederikshavn
- Grenå
- Hanstholm
- Hirtshals
- Hundested
- Kolding
- Aarhus
- Aalborg
The largest of these are Fredericia, Aarhus, Copenhagen and Esbjerg.

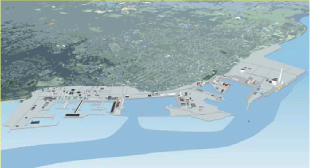
Figure 3‑3 Port of Esbjerg
3.2.2 The number of vessels
The short sea line traffic in Danish ports comprises Danish and foreign vessels operating on some 75 lines with 216 calls/year in 2007-2008 according to Danske Havne (see Appendix 5). It is beyond the scope of the present study to identify the individual vessels, their engine power or the length of their voyage, so for each of the lines we have assigned a 6,000GT average to the lift on-lift off traffic and 25,000GT to the Ro-ro cargo lines and 1 day voyage/call is attributed to each line. For the longer cargo lines from Europe this latter assumption will in effect only include the distance covered in Danish territorial water.
Since the data are from the height of the shipping boom we have reduced the fuel consumption with 25% to reflect the present cooler market conditions. The fuel consumption in the short sea shipping is therefore estimated on the basis of crude assumptions and must be taken as indicative.
The number of vessels calling Danish ports in short sea line traffic on the 75 lines has been set to 78 vessels. Some of the lines have relatively rare calls (< one per month) and obviously operate on other voyages where natural gas may not be accessible. A more conservative estimate may leave these out, but the number could also be set higher considering the bulk trade was not included in the Danske Havne study or considering a future situation where the availability of natural gas for bunkering is more widespread in SECAs and a number of vessels operate in these waters with dual fuel engines.[20] In the following the “maximum” number of vessels considered is maintained at 78.
3.3 Scenarios for natural gas conversion
To identify the ports in Denmark that have the potential for installing a LNG or CNG refilling system four scenarios have been identified. The consumption of energy on ships, which is estimated for the ferries and the vessels engaged in short sea shipping calling at least one Danish port.
This in turn defines the three basic needs in terms of infrastructure:
- Ships - the installations needed on ships (be it new ships or existing with retrofits)
- Port - the installations needed in ports or other bunkering infrastructure
- Infrastructure - the gas processing, storage and distribution network
For the ships the number of Danish ferries and number of vessels in short sea shipping is estimated. For the ports the number of ports are estimated within the ferry sector and the short sea shipping sector.
The final bullit is considered elsewhere in the report (section 5 and 6), and for the purpose of estimating the energy consumption and eventually pollution reduction scenarios it is anticipated that natural gas is distributed to the bunkering facilities and ships at par with existing fuel distribution.
3.3.1 Defining the scenarios
Four scenarios have been defined. The first scenario is a “maximum” long-term scenario where all ferries and greater portion of short sea shipping is expected to use natural gas for propulsion. The following scenarios define more realistic scenarios with fewer vessels and fewer port installations thereby also potentially moving into a shorter and more feasible time frame. To link the fuel or energy consumption for ferries to a specific port where an installation could be located the mainland or main island port is chosen (except for Rønne and Odden Færgehavn). Although the Femern Link is in the planning stage the port of Rødby is included.
Estimating the energy consumption and converting to natural gas (LNG):
The energy estimate for the fleet uses the installed engine power (kW) as the basis for calculating the fuel consumption assuming and average loading of 75% of maximum continuous service rating (MCR), and 60% operation time for ferries and 80% for cargo vessels. A conversion factor from oil to LNG is used to arrive at energy consumption in ton. LNG consumption data has been rounded.
3.3.2 Scenario 1 – the “maximum”
Scenario 1 includes all ferry ports and the total LNG fuel consumption for ferry and all short sea line traffic.
Scenario 1 includes:
- All ferry ports
- All short sea cargo ports
| Gross tonnage | Total ports* | Total vessels | Total LNG (t/y) |
|---|---|---|---|
| Ferries | |||
| 0-499 | 19 | 23 | 7000 |
| 500-9,999 | 13 | 21 | 100000 |
| >10,000 | 9 | 21 | 225000 |
| Ferries total | 41 | 65 | 332000 |
| Cargo ships | |||
| Cargo (short sea shipping) | 14 | 78 | 104000 |
| Ferry & cargo ships and ports total | 55 | 143 | 436000 |
*A port may occur in several categories, the ports are Hou, Svendborg, Rudkøbing, Rønne, Esbjerg and Helsingør.
3.3.3 Scenario 2 “many ferries – few cargo ports and ships”
Scenario 2 includes all ferry ports and the total LNG fuel consumption for ferry and for short sea line traffic for four ports. To identify ports, data concerning total annual cargo per port[21] have been used. The largest annual cargo operated by a port has been used as reference to choose the four ports.
Scenario 2 includes:
- All ferry ports
- Four short sea cargo ports
| Gross tonnage | Total ports | Total vessels | Total LNG (t/y) |
|---|---|---|---|
| Ferries | |||
| 0-499 | 19 | 23 | 7000 |
| 500-9,999 | 13 | 21 | 100000 |
| >10,000 | 9 | 21 | 225000 |
| Ferries total | 41 | 65 | 332000 |
| Cargo ships | |||
| Cargo (short sea shipping) | 4 | 20 | 62000 |
| Ferry & Cargo ship port total | 45 | 85 | 394000 |
*A port may occur in several categories, such ports are Hou, Svendborg, Rudkøbing, Rønne, Esbjerg and Helsingør. **The ports are Fredericia, Esbjerg, Copenhagen and Aarhus.
3.3.4 Scenario 3 “few ferries – many cargo ports and ships”
Scenario 3 includes ferry ports which routes total fuel consumption is larger than 20,000 tons per year. This includes a total of nine ferry ports. The ports are Sjællands Odde, Rønne, Rødby færgehavn, Copenhagen, Gedser, Hirtshals, Helsingør, Esbjerg, and Aarhus. The ferry port and cargo port in Copenhagen have different locations and occur twice. Scenario 3 for cargo ships includes all the short sea cargo ports and ships with an estimated of the total fuel consumption.
Scenario 3 includes:
- Nine ferry ports
- All short sea line traffic ports
| Gross tonnage | Total ports | Total vessels | Total LNG (t/y) |
|---|---|---|---|
| Ferries | |||
| 500- >10,000 | 9 | 27 | 299000 |
| Cargo ships | |||
| Cargo (short sea shipping) | 14 | 78 | 104000 |
| Ferry & Cargo ship port total | 23 | 105 | 403000 |
3.3.5 Scenario 4 “Reduced scenario”
Scenario 4 repeats the nine ferry ports with routes consuming more than 20,000 tons per year from Scenario 3 and the Short shipping from Scenario 2 and includes:
- Nine ferry ports
- Four short sea line traffic ports
| Gross tonnage | Total ports | Total vessels | Total LNG (t/y) |
|---|---|---|---|
| Ferries | |||
| 500- >10,000 | 9 | 27 | 299000 |
| Cargo ships | |||
| Cargo (short sea shipping) | 4 | 20 | 62000 |
| Ferry & Cargo ship port total | 13 | 47 | 361000 |
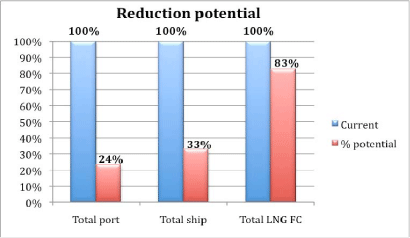
It is seen that limiting the number of ports from Scenario 1 to 4 with >75% and reducing the number of vessels with 67% still allows a recovery of 83% of potential conversion of fuel to LNG.
3.4 Summary on the potential for conversion in Denmark
In Denmark ferries comprise the lion’s share of seaborne transport with more than half a million port calls annually and the cargo traffic responsible for some +50,000. Based on data and estimates on ship sizes, engine data, frequency of calls and operation time scenarios were developed for the ferry traffic and the cargo short sea shipping identifying different number of vessels and ports in four scenarios. For these four scenarios the estimated fuel consumption was calculated for vessels and attributed to ports. The largest fuel consumption is found in fast ferries, which usually operate of about 30knobs and above, and on ferries with traditional engines on the longer routes. Compared to the ferries, in Denmark the consumption of fuel attributed to short sea shipping is limited and our estimate range from 15-25% depending on the scenario. The contributors in short sea shipping are overwhelmingly the RoRo cargo ships.
Even in the reduced Scenario 4 it is seen that with >75% fewer ports and reducing the number of vessels with 67% a recovery of 83% of the potential conversion of fuel to LNG is possible.

Figure 3‑4 Reduction potential in the most comprehensive scenario (current, blue bar) and in the less dramatic scenario (red) for ports, vessels and LNG fuel consumption
[11] Danmarks Statistik 2010: www.statbank.dk
[12] Source: Bilfærgernes Rederiforening (Danish Car Ferries’ Association)
[13] Vessel data input (GT and engine power) from Hans Otto Kristensen, DTU and the actual shipowners.
[14] The calculation procedure is found at the Danish Ministry of the Environment web page “Ship emissions and air pollution in Denmark”.
[15] Exceptions exist e.g. Odden færgehavn and Rønne havn.
[16] Scandlines (Lars Jordt), DFDS (Gert Jacobsen) and Unifeeder (Jørn Oluf Larsen)
[17] Arne Mikkelsen, Danish Shipowners’ Association.
[18] Ro-Ro cargo is a Ro-Ro vessel with less than 12 passengers
[19] In an optimistic assessment more ports could be included. In the ”Vækst i Danske Havne” Transport- og Energiministeriet, Søfartsstyrelsen og Konkurrencestyrelsen (2005) the total number is 27 cargo ports (later in their report reduced to 19), although these are not evaluated for short sea line trafic.
[20] We have added a contribution to the potential LNG consumption by including approx. 15,000 t/y estimated from the 31 lesser vessels operating the tramp trade and registered with the members of Rederiforening af 1898 and Rederiforening for Mindre Skibe (based on data from H.O. Kristensen, DTU)
[21] Total annual cargo per port from “Danmarks statistik” (see appendix)
Version 1.0 November 2010, © Danish Environmental Protection Agency