Identification and assessment of alternatives to selected phthalates
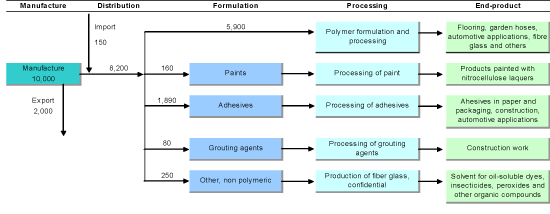
Figure 2.6 "Best estimate scenario" of the overall flow of DBP through manufacturing processes. Tonnes DBP/year. Figures are rounded and higher than actual figures. (COWI, 2009b)

Version 1.0 November 2010, © Danish Environmental Protection Agency