The Advisory list for self-classification of dangerous substances
3 Technical description of the self-classifications
- 3.1 Mutagenicity
- 3.2 Carcinogenicity
- 3.3 Reproductive toxicity
- 3.4 Acute oral toxicity
- 3.5 Sensitisation by skin contact
- 3.6 Skin irritation
- 3.7 Danger to the aquatic environment
In the precious report, a detailed description is given of how the advisory classifications were assigned to the chemicals in the advisory self-classification list. This includes description of the classification rules and the (Q)SARs used for predicting the dangerous properties of the chemicals. The current section describes only those changes that have been made in order to make the CLP-version of the list.
3.1 Mutagenicity
The CLP-criteria for classification for mutagenicity are divided into 3 different categories:
Classification as mutagenic, category 1A (Muta1A; H340: May cause genetic defects) is based on evidence of a causal association between human exposure to the substance and heritable genetic damage.
Classification as mutagenic, category 1B (Muta1B; H340: May cause genetic defects) is based on animal studies showing mutagenicity to germ cells either in assays on germ cells or by demonstrating mutagenic effects in somatic cells in vivo or in vitro as well as metabolic proof that the substances reaches the germ cells.
Classification as mutagenic, category 2 (Muta2; H341: Suspected of causing genetic defects) is based on animal studies showing mutagenity to germ cells either in assays on germ cells or by demonstrating mutagenic effects in somatic cells in vivo or in vitro as well as metabolic proof that the substances reaches the germ cells.
(Q)SAR based evaluation
The criteria for CLP-classification are the same as used under the Dangerous substance directive (DSD). Thus, the same procedure for screening the substances for mutagenicity were applied as described in the previous report /11/.
Briefly, five (Q)SAR models for predicting genotoxicity were used. For a substance to be selected as a probable mutagen it was necessary for the following criteria to be fulfilled: Positive prediction in two or more models, accepting only predictions where no significant deactivating fragments were detected. If one or more positive tests could be seen (as part of the training sets for the models) for any genotoxicity endpoint, this took precedence over model predictions.
When classification is proposed on basis of test data, a positive result in a single in vivo test is sufficient evidence on which to base the classification. Contrary to that, positive predictions in at least two models were required.
5,742 of the chemicals investigated in the current project met the criteria in the systematic evaluation and were assigned advisory classifications, Muta2.
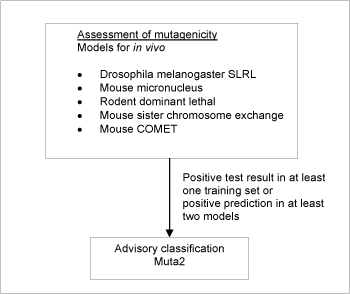
Figure 2: Schematic diagram illustrating the systematic evaluation applied to assign advisory classifications for mutagenicity.
3.2 Carcinogenicity
This endpoint can in the CLP regulation result in classification in 3 different categories:
Classification as carcinogen in category 1A (Carc1A; May cause cancer) is based on a strong causal relationship in humans.
Classification as carcinogen in category 1B (Carc1B; H350: May cause cancer) is based on conclusive animal data from 2 species or 1 species with supportive evidence such as genotoxic effects in vitro or in vivo.
Classification as carcinogen in category 2 (Carc2; H351: Suspected of causing cancer) is subdivided into two:
- Well-investigated substances with restricted tumorigenic effects. It is normally based on clear data of tumour formation in one species. Mutagenicity data in vitro and in vivo can be used as supportive evidence.
- Substances that are insufficiently investigated, but raising concern for man.
(Q)SAR based evaluation
The criteria for CLP-classification are the same as used under the Dangerous substance directive (DSD). Thus, the same procedure for screening the substances for mutagenicity were applied as described in the previous report /11/.
Briefly, four models predicting carcinogenicity in vivo and models predicting three genotoxicity in vitro endpoints were applied in the screening. For a substance to be selected as a probable carcinogen it was necessary for the following criteria to be fulfilled: Positive according to the ICSAS methodology /7/, corresponding to two or more positive carcinogenicity predictions, accepting only predictions for chemicals without significant deactivating fragments.
If one or more positive tests were observed (as part of the training sets for the models) for any cancer endpoint, this took precedence over model predictions. As the models are heavily biased towards making a correct prediction for substances included in the training set the latter criterion only resulted in little change. However, it was felt that there was no reason to artificially reduce the quality of the advisory classification by neglecting to use test data, which were available.
One or more negative tests in the training set of each model also took precedence over predictions of that model, except in cases where positive training set tests were present in other cancer models.
Identification of genotoxic carcinogens
Since many non-genotoxic carcinogens are acting by a wide variety of often unknown mechanisms, it was chosen to focus here on chemicals likely to cause cancer through a genotoxic mechanism. Therefore, a further selection criterion for genotoxicity was set up.
As opposed to the selection criteria for mutagenicity, not all genotoxic carcinogens are necessarily clastogenic (cause loss, addition or rearrangement of parts of chromosomes). To select the genotoxic chemicals from the chemicals already predicted positive for in vivo carcinogenicity, which include genotoxic as well as non-genotoxic carcinogens, a battery of models for sensitive in vitro genotoxicity endpoints was used.
The genotoxicity criterion was a positive estimate in one or more of the models for the following in vitro genotoxicity endpoints; Reverse mutation test (Ames), chromosomal aberrations (CHO/CHL), or mutations in mouse lymphoma.
A schematic diagram of the systematic evaluation is given in figure 3. According to these criteria, 3,726 of the chemicals assessed in the current project were identified as genotoxic carcinogens and selected for advisory classification for carcinogenicity. The models employed do not allow discrimination between classifications in the three categories, so the lower classification Carc2 was applied in all cases.
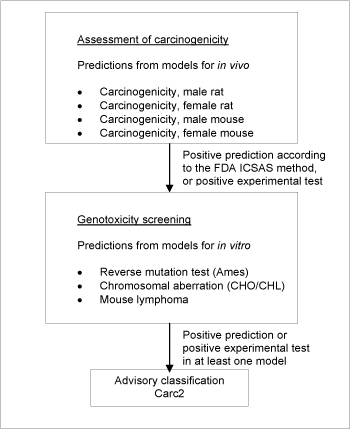
Figure 3: Schematic diagram illustrating the systematic evaluation applied to assign advisory classifications for carcinogenicity.
3.3 Reproductive toxicity
This endpoint can result in classification in 3 different categories:
Classification as toxic to reproduction in category 1A (Repr1A; H360: May damage fertility or the unborn child) is based on a strong causal relationship in humans.
Classification as toxic to reproduction in category 1B (Repr1B; H360: May damage fertility or the unborn child) is based primarily on animal data, and secondly on “other relevant information”. Data from in vitro studies, or studies on avian eggs, are regarded as “supportive evidence” and would only exceptionally lead to classification in the absence of in vivo data.
Classification as toxic to reproduction in category 2 (Repr2; H361: Suspected of damaging fertility or the unborn child) is based primarily on animal data, and secondly on “other relevant information”. Substances in category 2 are insufficiently investigated, but raising concern for man.
Classification for reproductive toxicity covers a wide range of effects on either fertility or to the developing organism before and after birth (structural or functional damage). The (Q)SAR models applied in the current project only cover certain but far from all types of harm to the unborn child. Hence only certain types of mechanisms causing malformations or foetal mortality are covered. No (Q)SAR models were used for effects concerning other types of developmental toxicity and fertility.
(Q)SAR based evaluation
The criteria for CLP-classification are the same as used under the Dangerous substance directive (DSD). Thus, the same type of procedure for screening the substances for mutagenicity were applied as described in the previous report /11/.
Briefly, three models predicting in vivo teratogenicity or fetal lethality related endpoints were applied in the assessment. For a substance to be selected as probably toxic to reproduction in the assessment, the criterion was a positive prediction in any of the three models and without a negative prediction in the model for teratogenic risk in humans (see Figure 4).
The screening resulted in a list of 4,036 positive predictions. The models employed do not allow discrimination between classifications in the three classification categories, so the lower classification Repr2 was applied in all cases.
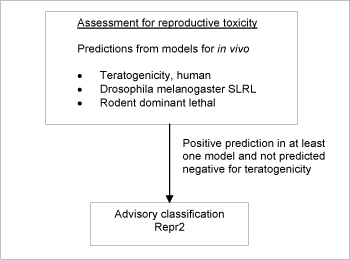
Figure 4: Schematic diagram illustrating the systematic evaluation applied to assign advisory classifications for reproductive toxicity.
3.4 Acute oral toxicity
The formalized criteria for classification for acute oral toxicity include a number of options of tests including fixed-dose procedure and interpretation of the various sources of information about acute oral toxicity. This information is referred to as the acute toxicity estimate (ATE), and is based on acute LC50/LD50 values, most often from tests in the rat. The following classification criteria are used.
| Classification | Classification criteria |
|---|---|
| AcuteTox1 | ATE ≤ 5 mg/kg body weight |
| AcuteTox2 | 5 < ATE ≤ 50 mg/kg body weight |
| AcuteTox3 | 50 < ATE ≤ 300 mg/kg body weight |
| AcuteTox4 | 300 < ATE ≤ 2000 mg/kg body weight |
Table 5: CLP-criteria for classification for acute oral toxicity
(Q)SAR based evaluation
The criteria for CLP-classification are using different cut-off values as compared to those used under the Dangerous substance directive (DSD). Thus, the procedure for screening the substances for acute oral toxicity were slightly modified from the descriptions in the previous report /11/. These modifications only covered the new cut-off values.
Briefly, acute toxicity was predicted as follows:
- If test data from the rat were readily available (i.e. had been used to establish the model) these took precedence over any predictions.
- Acute toxicity data from the mouse was used to predict rat oral LD50’s using four QAARs (Quantitative Activity-Activity Relationships referred to as QSAR 1´, QSAR 2´, QSAR 3´, QSAR 4´), see /11/ for further details.
- If no test data were available, rat oral LD50 was estimated according to the Pharma Algorithms Inc. ToxBoxes (vers. 2.9) acute toxicity LD50 for Rat (oral), see /11/ for further details.
A schematic diagram of the systematic evaluation is given in figure 5.
This resulted in the following numbers of substances with classification for acute oral toxicity:
| Acute oral toxicity category | Number of classifications |
|---|---|
| AcuteTox1 | 60 |
| AcuteTox2 | 259 |
| AcuteTox3 | 1968 |
| AcuteTox4 | 12937 |
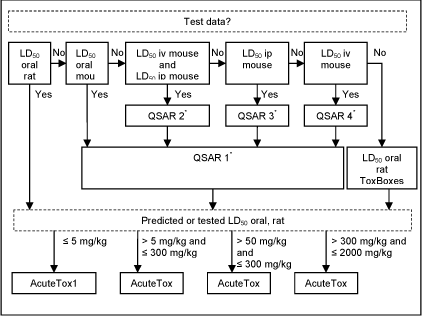
Figure 5: Diagram illustrating the systematic evaluation used to assign advisory classifications for acute oral toxicity
3.5 Sensitisation by skin contact
This endpoint can result in a classification for skin sensitisation in category 1 (SkinSens1; May cause an allergic skin reaction). The classification is based on evidence in humans that the substance can lead to sensitisation by skin contact in a substantial number of persons, or if there are positive results from an appropriate animal test.
(Q)SAR based evaluation
The current advisory classifications for sensitisation by skin contact originate from 2001 and have not been updated. The general documentation on the assessments undertaken - start list, criteria for application domain etc. - can be found in the documentation report from 2001 /3/.
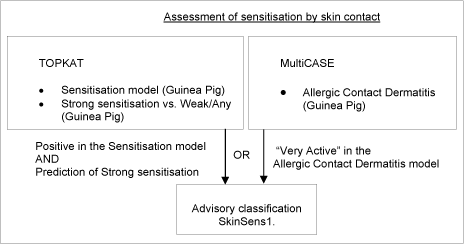
Figure 6: Schematic diagram illustrating the systematic evaluation applied to assign advisory classifications for sensitisation by skin contact
9.669 chemicals met the above criteria, for which an advisory classification of SkinSens1 was assigned. This large number of chemicals with predicted sensitizing effects is based on models representing the current “state-of-the-art”. To address the issue that the models may be over-sensitive further investigations were conducted. Estimates of percentages of allergens on EINECS ranged from 5-25%, with some preference being expressed for 10%, which is the number of Annex VI of CLP (or previously Annex I of DSD) substances currently classified for this effect. It is not possible, however, to estimate the influence of confounders on the distribution represented in Annex I. Positive bias can have been introduced because chemicals testing positive are over-represented. Negative bias can have been caused by the fact that most of the chemicals have never been tested at all. The question of numbers remains open.
3.6 Skin irritation
This endpoint can result in a classification for skin irritation category 2 (SkinIrr2; Causes skin irritation).
(Q)SAR based evaluation
The criteria for CLP-classification are slightly changed compared with those that are used under the Dangerous substance directive (DSD) because the cut off value in the Magnuson-Kligman test with rabbits to discriminate between skin irritants and non skin irritants has been increased from a score value of 2.0 to 2.2. However because the previous conducted (Q)SAR model predictions of skin irritation related to strong skin irritants, the same procedure for screening the substances for skin irritation were applied as described in the previous report (c.f. /11/ for further details).
Substances which cause significant inflammation of the skin determined on the rabbit according to the cutaneous irritation Annex V test method (persisting for more than 24h after exposure of less than 4h) should be classified for skin irritation with SkinIrr2.
Briefly skin irritation was predicted as follows:
- If test data for rabbits were readily available, these took precedence over any predictions.
- If no test data were available, skin irritation was estimated according to the DK MultiCASE model for severe skin irritation vs mild skin irritation, see /11/ for further details.
A schematic diagram of the systematic evaluation is given in figure 7.
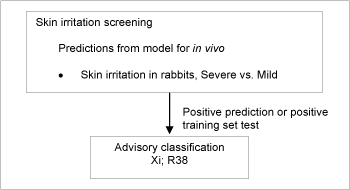
Figure 7: Schematic diagram illustrating the systematic evaluation used to assign advisory classifications for skin irritation
This resulted in 8,005 substances, which were assigned an advisory classification of SkinIrr2. As the model does not discriminate between strong irritants and corrosive chemicals, the advisory classifications based on the predictions from the model should be considered as “minimum classifications”.
3.7 Danger to the aquatic environment
The CLP-classification criteria are composed of three main elements: 1) potential for rapid degradation, 2) bioconcentration potential in fish, and 3) short-term toxicity to aquatic organisms (fish, daphnia, and algae). Classifications are assigned according to the following scheme:
| Classification | Classification criteria* |
|---|---|
| Acute1 Very toxic to aquatic life |
EC50/LC50 ≤ 1.0 mg/L |
| Chronic1 Very toxic to aquatic life with long lasting effects. |
EC50/LC50 ≤ 1.0 mg/L and not readily degradable or BCF**≥ 500 |
| Chronic2 Toxic to aquatic life with long lasting effects. |
EC50/LC50 > 1 and ≤ 10 mg/L and not readily degradable or BCF** ≥ 500 |
| Chronic3 Harmful to aquatic life with long lasting effects. |
EC50/LC50 > 10 and ≤ 100 mg/L and not readily degradable or BCF** ≥ 500 |
| Chronic4 May cause long lasting harmful effects to aquatic life |
Cases when data do not allow classification under the above criteria but there are nevertheless some grounds for concern. |
Table 10: EU criteria for classification for danger to the aquatic environment
* EC50/LC50 is the lowest concentration where effects are seen in 50% of the species in ecotoxicity tests fish, daphnia or algae.
** BCF: Bioconcentration factor
(Q)SAR based evaluation
Advisory classifications were assigned on the basis of combinations of estimates for ready biodegradability, bioconcentration in fish and acute toxicity to aquatic organisms according to the criteria in table 10. Different combinations of (Q)SAR models were used as illustrated in figure 8. It is noted that the classification criteria of the new CLP Regulation is slightly changed form the previously employed ones:
- The BCF trigger has been increased from 100 to 500 (and the equivalent log Kow trigger has been increased from 3 to 4)
- The combination of high bioaccumulation potential BCF > 500) (or log Kow > 4) and an acute aquatic toxicity value between 10 and 100 ppm also results in classification (hazard statement “chronic 3”), which was not the case according to the previous criteria
Details about the models used are described in the previous report /11/.
Classification with hazard statement “Chronic 4” was not used in this exercise, as the (Q)SAR based evaluation is unsuitable for predictions of classification in cases where (Q)SAR data do not fulfil the criteria mentioned in table 10 but when there are nevertheless reasons for concern. Another reason is that when the bioaccumulation potential in fish is predicted to be above 500 then the acute aquatic toxicity in fish, daphnia and/or algae are always below 100 ppm, which means that one of the other possible environmental hazard classifications apply.
It is noted that compared to the classification criteria according to which abiotic degradation (and assessment of primary degradation products for their environmental hazard classification) can be used, only predictions concerning potential for rapid biodegradation was employed here. Furthermore only predictions for bioconcentration in fish were used even though the classification criteria refers to use of log Kow when reliable measured BCF data in fish are not available.
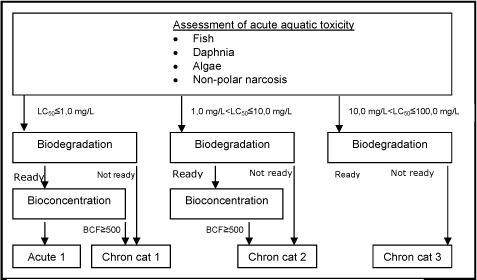
Figure 8: Schematic diagram illustrating the systematic evaluation applied to assign advisory classifications for danger to the aquatic environment.
A total of 17,779 of the chemicals assessed in the current project were selected according to one of the four classification categories based on the combination of model predictions as indicated in the classification criteria and shown in Figure 8. The classifications for danger to the aquatic environment were assigned to the following number of chemicals:
| Acute1 | 3,619 |
| Chronic1 | 6,093 |
| Chronic2 | 4,946 |
| Chronic3 | 3,121 |
Version 1.0 December 2010, © Danish Environmental Protection Agency