Stofkoncentrationer i regnbetingede udledninger fra fællessystemer
5. Explaining the variation of EMC's and SMC's
5.1 Variation of EMC- and SMC-values
5.2 Distribution of EMC-values
5.3 Correlation with event and catchment characteristics
5.1 Variation of EMC- and SMC-values
Table 5.1 shows summary statistics for TSS, COD and BOD based on the measurement programs reviewed in chapter 4. Other pollutant parameters have not been reported frequently enough to calculate summary statistics, but the ranges for these parameters can be seen in table 5.2.
Table 5.1
| Parameter | Mean |
Median |
Max. |
Min. |
Range |
No. of data |
St.dev. |
| TSS | 274 |
237 |
751 |
22 |
729 |
71 |
182 |
| COD | 188 |
148 |
1005 |
34 |
971 |
66 |
161 |
| BOD | 65 |
43 |
286 |
2 |
284 |
73 |
68 |
Table 5.2
Range for reported EMC/SMC-values.
| Constituent | Low value [mg/l] |
High value [mg/l] |
| Total phosphorus | 0.31 |
8.3 |
| Total Nitrogen | 0.48 |
15.2 |
| Zinc | 0.11 |
0.47 |
| Copper | 0.028 |
0.17 |
| Lead | 0.08 |
0.45 |
As seen in the tables above the parameters vary considerably. As earlier explained the variations stem from variations between sites and differences in measuring campaign methodologies, but it is not clear how to distinguish between the two types of contributions to the variation. Subsequently, it is very difficult to distinguish between the influences from rainfall, runoff characteristics and site variations such as rainfall intensity, rainfall duration, rain depth, discharges on surfaces and in pipes, runoff coefficient, first flush tendency of the system, land use, catchment area, population density, dry weather flow, antecedent dry weather period etc.
The very large NURP project arrived at a set of recommended values for the United States although variations were large between sites. Making conclusions about SMC/EMC-values based on a few measurement sites and a limited number of monitored events may very well result in doubtful conclusions. Furthermore, if a "small" study is extended the variation may increase due to the condition that the already monitored sites and events were not representative for the spatial and temporal variations.
Table 5.3 summarizes the main literature data on TSS, COD, Tot-N and Tot-P by country to provide a basis for comparison with the Danish measurement data. Sites from the NURP database with less than 50 mg COD/l have been excluded.
5.2 Distribution of EMC-values
As already mentioned the distribution of EMC-values of a number of pollutant has been shown to be log-normal distributed (VanBuren et al, 1997). This statistical consistency allows for probabilistic modelling of run-of quality. By specifying return periods or exceedance probabilities it is possible to estimate corresponding EMC’s and vice versa. This is illustrated on Fig. 5.1.
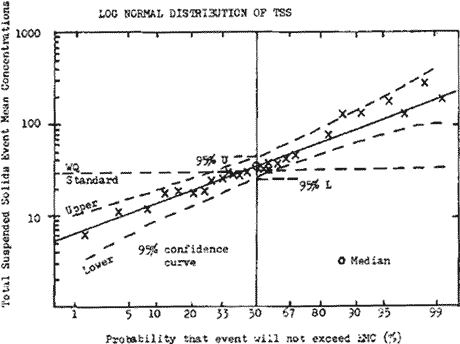
Figure 5.1
Example of log normal distribution of total suspended solids (TSS), from (Ellis,
1986).
According to Hémain (1986) data from the NURP program partly followed a log-normal distribution (for TSS, T-tot P, Tot-Pb, and Tot-Zn), whereas COD did not seem to fit the distribution. Similar results were found in the French national programme (Hémain, 1986).
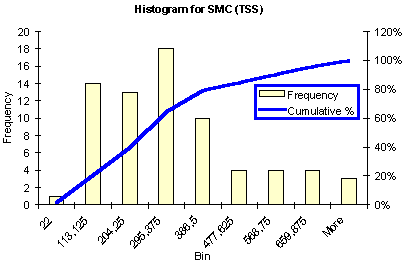
Figur 5.2
Distribution of reported SMC-values for TSS.
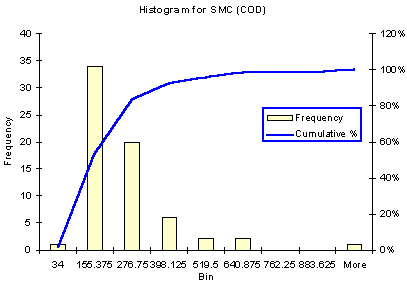
Figure 5.3
Distribution of reported SMC-values for COD.
Histograms based on SMC-values of TSS and COD from the literature review are shown in Figs. 5.2 and 5.3. Application of the simple Bowman-Shelton test showed the COD data to be log-normal distributed whereas the TSS data could neither be said to follow a normal or log-normal distribution.
5.3 Correlation with event and catchment characteristics
The first thing researches do when obtaining some measured data is to look for correlations between results and influencing parameters characterizing individual events and individual sampling sites as mentioned above. Often anticipated correlations are not found. Very few references e.g. report correlation with ADWP (Pearson et al, 1986) contrary to what one may expect. In the study by Saget et al (1998) EMC-values were correlated with mean slope of the catchments and time of concentration without success. It is a general result that no singular input characteristics can explain the main part of the EMC-values (Hémain, 1986).
When looking at the extent of the measurement campaigns, which have been carried out it can be concluded that no single project have been able to explain the differences between estimated EMC-values with good confidence. This can also be seen when plotting parameters reported in this review against different catchment characteristics. Plots showing relationships with the catchment characteristics are seen in figure 5.4 to 5.8.
The scatter plots do, in general, not show pronounced dependency on either catchment area or population density. It can be seen, however, that European values seem to be higher than pollutant levels in United States. This is consistent with the fact that the American sites represent storm sewers, however influenced to some extent by illicit wastewater connections.
Regression analyses have been carried out on data from the NURP and USGS databases (Tasker and Driver, 1988; Driver and Tasker, 1990). It was found that the various regression models could account for 10 to 68 percent of the total variation in observed loads, and that regression models may be used for planning levels calculations, or in identifying data-collection needs.
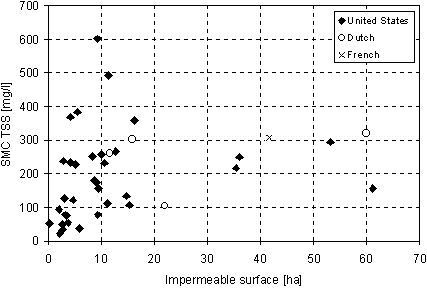
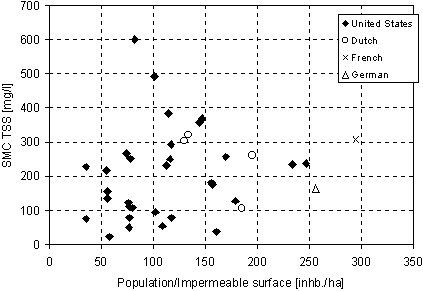
Figure 6.1
SMC values of TSS, dependency on catchment area and population density.
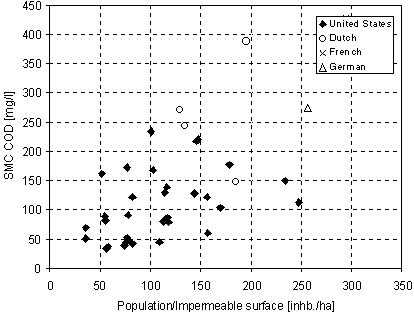
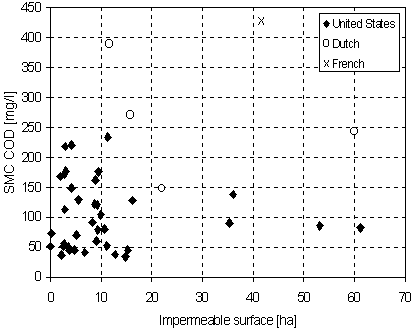
Figure 6.2
SMC values of COD, dependency on catchment area and population density.
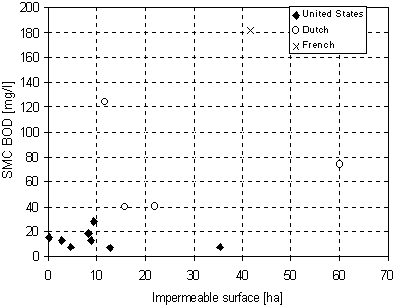
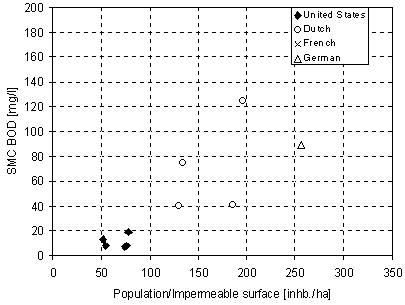
Figure 6.3
SMC values of BOD, dependency on catchment area and population density.
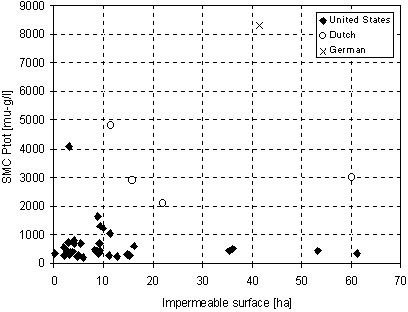
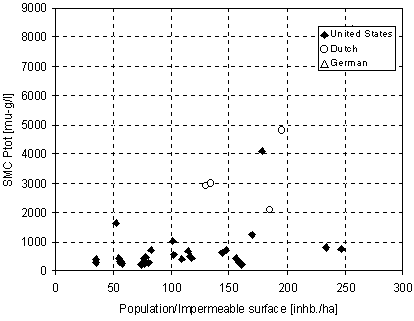
Figure 6.4
SMC values of Ptot, dependency on catchment area and population
density.
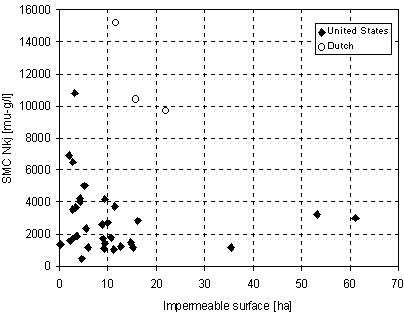
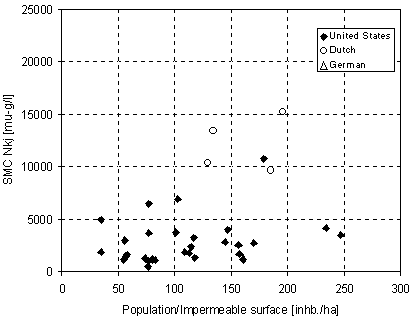
Figure 6.5
SMC values of Nkj, dependency on catchment area and population density.
|
|