Helhedsorienteret miljøvurdering af minkavl og forslag til indsatsområder5 English summaryThe environmental impact from percolation or evaporation of nitrogen at different hall arrangements is calculated from a life cycle perspective compared to the total ammonia evaporation and potential N percolation. The results are listed in the table below. N total added to mink farming in Denmark through the feed was approx. 10,450 tons in 1999.
The total difference on a national basis between a hall arrangement with collection of manure and automatic clean-out (Scenario B) and a traditional hall without collection of manure and a weekly clean-out (Scenario C) has been calculated to approx. 1,763 tons N loss. This corresponds to a total N loss approx. 30% larger than traditional clean-out. In order to assess the sensitivity of the listed assumptions about the nitrogen balance at the different hall arrangements, the calculation is extended with C3, where it is assumed that the percolation is 40% in the hall. The result of this additional calculation shows that the difference between manure collection with daily automatic clean-out and a traditional hall without manure collection and where the percolation in the hall is assumed to be 40%, is a 2,782 tons larger N loss on a national basis. By including Scenario C3 in the UMIP calculation, the calculation is a "worst-case" scenario, and with the current assumptions about percolation of N and P on farm land, the difference of Scenario B and worst case (C3) is an approx. 48% larger N loss. The used UMIP method allows calculation of data, so that comparison can be made between different types of environmental effects, and the calculation results indicate which focus areas are important. The calculation results are presented in a so-called environmental profile showing how much each phase or process contributes to the environmental effects. The calculated result is expressed in milli person equivalents (mPE), which is the part of the annual environmental impact from an average person (see Chapter 1.2).
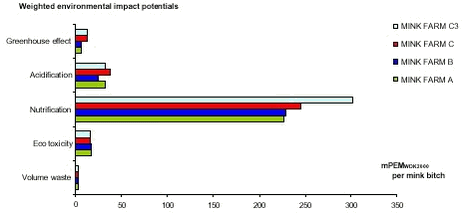
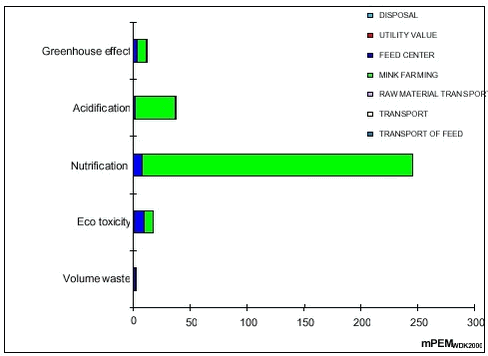
Figure 5.1 The weighted potential environmental effects at different Scenarios for manure collection. From figure 5.1 is seen that the most important environmental effect for all scenarios is the nutrient salt load. The second largest contribution is acidifica-tion. By way of comparison, a contribution to the nutrient salt load of 250 mPE per mink bitch is equivalent to a total contribution from the Danish mink production (2,136,500 mink bitches) of 534,125 PE, i.e. the annual contribution of 534,125 average citizens to the nutrient salt load in Denmark. The contribution to the nutrient salt load is largest from Scenario C3 which is the worst case scenario for traditional clean-out without troughs. With the selected assumptions, the difference is approx. 30% from Scenario A, which is the best for Scenario C3. The difference between Scenario A and C is approx. 10%. The difference in the nutrient salt load between Scenario A and B is limited, and if miscellaneous considerations of uncertainty are included, there is no reason to assume that there is a difference in the total contribution to the nutrient salt load. It is characteristic for the accomplished calculation of the nitrogen mass balance that it is mostly nitrogen, that is moved, for example from fixed form to airy form (NO3/NH3) or from percolation in the stable to percolation in the field. It can be seen from the following figure how each contribution are dispersed on sources, exemplified by Scenario C.
The mink production represents approx. 91% of the total impact. The other important source is production of feed, which is approx. 8% of the total impact. The remaining sources are entirely marginal and less than 1% of the total contribution (transport of raw materials, transport of feed, removal of dead animals). Contribution from transport has thus only a small influence on the total environmental effect when related to an annual mink bitch. The substances that contribute to the potential nutrient salt load are P, NO3 and NH3. The main part of the contribution to the potential nitrification comes from the mink production. The potential percolation of P derives from approx. 31.7 % of the contribution, the potential percolation of NO3 represents approx. 60% and NH3 represents the remaining approx. 7.5% of the contribution. The calculation shows that the utility value obtained by using mink manure instead of other fertilisers is limited. The utility value is credited by setting off the emissions from the energy usage that otherwise should be used to produce a certain amount of fertilizer corresponding to the N value that the mink manure has for the plants. The following table illustrates the differences between the calculated potential acidification and nutrient salt load per mink bitch for each scenario.
It can be seen from table that the difference between Scenario B, which is automatic daily clean-out and Scenario C/C3 which is traditional clean-out without manure collection is in the interval 12.2-33.4%. The UMIP calculation indicates that with the selected assumptions, a total environmental gain can be reached by collecting manure and urine in the halls for distribution on the fields. With the chosen assumptions in the scenarios, the environmental gain is indicated to be approx. 12% and approx. 33% seen from a worst case point of view. Furthermore, according to the UMIP calculation, phosphorus is the main source of the nutrient salt load, and the largest environmental gain can, thus, be achieved by preventing percolation of phosphorus. It should, however, be stressed that part of the phosphorus content is not necessarily in a soluble form and, thus, not accessible for percolation. According to the UMIP calculation, the ammonia evaporation and the differences between each scenario is of minor importance than for the total effect.
|