Modellering af optagelse af organiske stoffer i grøntsager og frugt
Bilag G
Jury-Model for Transport in Soil
The following 2nd order differentialequation describes the transport of substances in the soil, accounting for both the diffusion in the air and water phases and the advection. Both the effectiv diffusionscoefficient (DE) and the advective flow velocity (VE) are assumed to be constant:
| Equation 34 |
where
| CT | is the total concentration in soil (mg/kg) |
| µ | is the degradation rate constant for the degradation in soil (d-1). |
| DE | is the effective diffusioncoefficient in soil (m2/d), accounting for both the diffusion in the soil pore water and pore air. |
| VE | is the advective flow velocity of water in the soil (m/d) |
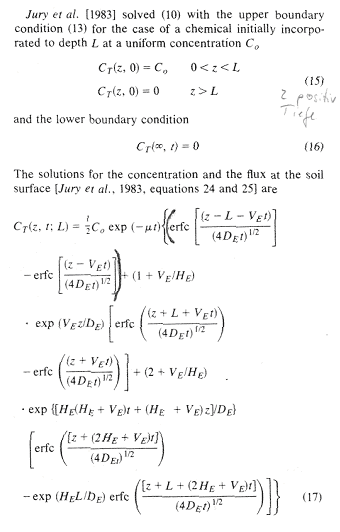
The solution of Jury et al. is used (1983, beware! there is an error in equation 24
in this paper, see erratum 1987). This solution includes diffusion in the gas and water
phase, advection of water, degradation of the compound and an unpolluted layer on top of
the polluted soil layer. As upper boundary condition, concentration at the soil surface is
zero. The sensitivity of this model has been studied by Anderson & Parker (1990). The
model has already been used in risk assessment by Sanders & Stern (1994). For the
simulation of a layer of uncontaminated soil on a layer of contaminated soil (or
groundwater), a suitable solution is found in Jury et al. (1990), eqs. 17-21. Of
the three times, the equation was typesetted in journals, only one version (erratum 1987)
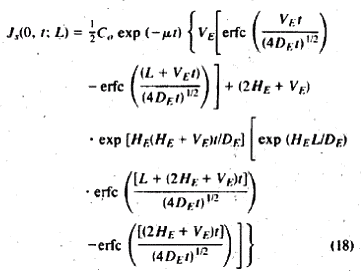
is correct! We therefore use a hand-corrected scan of the solution (from Jury et al.
1990):
The concentration in calculated from:
 |
Equation 35 |
 |
Equation 36 |
For the initial and boundary conditions
 |
Equation 37 |
the solution is found by superposition:
 |
Equation 38 |
where
| z | is the depth below soil (negative) |
| t | is the time |
| CT(z,t) | is the total concentration in the soil at depth z and time t |
| JS(0,t) | is the volatilization flux at the soil surface and time t |
| L | is depth of the coverage layer |
| W | is the depth of the polluted layer |
| µ | is the 1st order degradation rate constant in soil |
| HE | is calculated from |
| Equation 39 |
| DA,Luft | is the effective diffusion coefficient in the air |
| d Luft | is thickness of the stagnant layer |
| VE | is calculated from |
| Equation 40 |
JW is the volumetric soil water flux (m/d)
Example
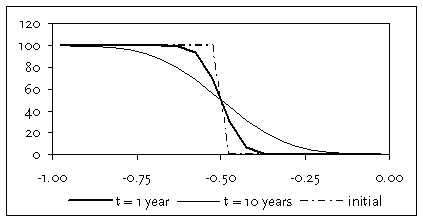
Figure G.1 shows the result of a simulation for naphthalene with an initially contaminated layer between -0.5 and -3 m depth, and a non-contaminated soil above. The averaged concentration after 10 years in the originally unpolluted layer between 0 and -50 cm is 12.38% of the initially polluted layer.

Figure G.1
Simulated migration of Naphthalene from a polluted soil layer into a
unpolluted cover of thickness 50 cm (Soil 1).
Persistent volatile chemicals migrate with time into the uncontaminated layer. To consider this in plant uptake modelling, the average concentration in the root zone is calculated with the Jury model, and used as factor. The soil concentration relevant for the plant is then the concentration of the chemical in the contaminant layer times the migration factor.
Table G.1
Factors for migration of compounds into uncontaminated soil (ratio between
average concentration in upper layer and the concentration in the initial polluted layer).
Root zone thickness here set to 0.5 m.
Compound |
Soil 1 |
Soil 1 |
Soil 2 |
Soil 2 |
Naphthalene |
0.039 |
0.124 |
0.218 |
0.053 |
Benzo(a)pyrene |
0.000 |
0.000 |
0.000 |
0.003 |
MTBE |
0.219 |
0.174 |
0.057 |
0.003 |
Toluene |
0.223 |
0.169 |
0.011 |
0.000 |
n-Dodecane |
0.230 |
0.069 |
0.002 |
0.000 |
Trichloroethene |
0.208 |
0.186 |
0.014 |
0.001 |
Benzene |
0.233 |
0.076 |
0.004 |
0.000 |
Tetrachlorethene |
0.242 |
0.104 |
0.005 |
0.000 |
All chemicals have –except benzo(a)pyrene - the potential to migrate from a deeper
polluted layer into a overlying non-polluted layer. The results in Table G.1 show that the
average concentration in the root zone is about a factor 5 below that of the initially
polluted layer after 1 year. The volatile chemicals, MTBE, toluene, trichloroethene,
benzene, tetrachloroethene and n-dodecane, reach their maximum in soil 2 before the
first year, and the upper part of the polluted layer depletes quickly. Toluene is known to
be degraded quickly in aerobic soils (Rippen 2002), therefore, the value is an upper
estimate.