|
| Forside | | Indhold | | Forrige | | Næste |
Stimuleret in situ reduktiv deklorering. Vidensopsamling og screening af lokaliteter
Appendiks B Udvalgte case studier med bioaugmentation
Dover Air Force Base, Dover Delaware
Ellis et al. (2000) presented a field-scale demonstration of in situ bioaugmentation for treating dissolved phase TCE at Dover Air Force Base. Comprehensive microcosm studies were performed prior to
system design to assess the need for bioaugmentation. The microcosm studies described by Lee et al. (2000). used site soil and groundwater amended with various electron donors including: organic acids
such as acetate, benzoate, butyrate, formate, lactate, and propionate; alcohols such as ethanol and methanol; sugars, including sucrose, glucose, and fructose; complex organics such as molasses or yeast
extract; other compounds including vitamin B12; ethylene glycol and glutamic acid. Sulfate and bicarbonate were added as electron acceptors in addition to the nitrate, sulfate, iron, and bicarbonate already
present in the groundwater and soil. Many trea™ents were amended with nutrients, vitamins, or trace elements and/or yeast extract. In all, over 1000 individual microcosms were tested during this phase of
the study. TCE was reduced to vinyl chloride in only a few microcosm bottles after incubation of up to 500 days. Ethene was not produced in any bottles, even under methanogenic conditions. If
Dehalococcoides spp. were more widely distributed at this site, then a greater percentage of these microcosms should have converted TCE beyond cis-DCE. Additional treatability studies were performed
using Dover soil and groundwater to assess biostimulation performance in aquifer columns (Harkness et al. 1999). TCE was not reduced beyond cis-DCE in columns that had been fed electron donors for
up to 371 days. However, injection into one column of a small volume of the Pinellas culture, which contains close relatives of Dehalococcoides ethenogenes, stimulated complete dechlorination of cis-DCE
to ethene within 20 days. This effect was repeated in a second column injected with the same culture. Furthermore, VC production was transient in both bioaugmented columns, with rapid conversion to
ethene.
The bioaugmentation field pilot test at Dover AFB involved a recirculation design and the addition of lactate (Ellis et al. 2000). The well layout of the pilot test area (PTA) is illustrated in Figure B-1. The
layout of the PTA and the pumping rates were designed with the aid of groundwater flow modeling and subsequent tracer tests with bromide. The trea™ent well network consisted of one row of three
extraction wells and another row of three injection wells, with each row oriented perpendicular to the prevailing hydraulic gradient. The two rows were 6 m apart. Based on the results of modeling and tracer
testing, a combined extraction rate of 11.6 L/min was chosen as the design flow that would achieve sufficient capture. This pumping rate resulted in an estimated residence time of 60 days.
The system was operated in biostimulation mode for the first 269 days, with TCE being stoichiometrically dechlorinated to cis-DCE, but not to VC or ethene. Lactate was delivered on a 7-day, pulsed
feeding schedule to minimize biofouling at the injection wells. The PTA was augmented with the Pinellas culture on days 260 and 284 (180L, and 171 L, respectively), and VC and ethene was detected
within 90 days of bioaugmentation. A complete mass balance conversion of TCE and cis-DCE to ethene was achieved within 8 months after bioaugmentation.
After completion of the pilot test, Hendrickson et al. (2001) used 16S rDNA-based PCR methods to screen for the presence of Dehalococcoides ethenogenes-like bacteria within the PTA. One year after
the completion of the pilot, close relatives of Dehalococcoides ethenogenes were detected throughout the test plot, but were not detected outside the PTA, which provided additional evidence that the
attainment of complete dechlorination within the test plot was linked to the presence of Dehalococcoides. Additional sampling performed 2 and 3 years after the completion of the pilot test detected the
continued presence of Dehalococcoides ethenogenes-like bacteria within the PTA, but again not in the upgradient background wells. These data indicate that the Dehalococcoides strains injected into the
subsurface can survive for long periods, and continue to dechlorinate as long as an anaerobic environment is maintained.
Kelly Air Force Base, San Antonio, Texas
Major et al (2002) conducted a demonstration of bioaugmentation for treating dissolved-phase PCE, TCE and cis-DCE at Kelly AFB in San Antonio, Texas. Prior to the demonstration, the site
groundwater contained about 1 mg/L of PCE and lower amounts of TCE and cis-DCE, without any detectable VC or ethene. Analysis with 16S rDNA-based PCR methods did not detect
Dehalococcoides in any groundwater or sediment samples from the PTA. Laboratory microcosm studies showed that non-bioaugmented trea™ents containing lactate or methanol resulted in stoichiometric
conversion of TCE and cis-DCE, without further dechlorination of cis-DCE to VC or ethene. Microcosms bioaugmented with KB-1, a halo-respiring culture that contains various strains of
Dehalococcoides, and methanol stoichiometrically converted all of the TCE to ethene. The field test consisted of three recirculation plots, two that served as control plots, and one that was bioaugmented
with KB-1.
Figure B-2 illustrates the example performance monitoring results for the bioaugmentation test plot. The test plot was recirculated for 89 days to equilibrate the system and to conduct the bromide tracer test.
From day 90 to day 175, methanol and acetate were added as electron donors to establish reduced conditions and to stimulate reductive dechlorination by the indigenous bacteria. Bioaugmentation with 13L
of KB-1 occurred on day 176. Performance monitoring of the control and test plots showed that in the presence of methanol and acetate, the indigenous bacteria could be stimulated to dechlorinate PCE to
cis-DCE. However, no dechlorination past cis-DCE was observed in the control plots for the remainder of the test. In contrast, VC was detected 52 days after bioaugmentation with KB-1 in the test plot,
and by day 318 ethene was the dominant product. Calculated half-lives for degradation were on the order of minutes to hours. 16S rDNA-based PCR methods were used to monitor the migration and
growth of KB-1 culture after injection. Molecular monitoring showed that the culture had completely colonized the 9.1 meter-long aquifer test plot within 115 days after the one-time injection of KB-1. The
two control plots were installed and operated in the same manner as the test plot, but were never amended with KB-1. In these control plots dechlorination stalled at cis-DCE, with no VC observed during
216 days of operation. Molecular analysis confirmed that Dehalococcoides was not present in the control plots.
Bachman Road Residential Wells Site, Oscoda Michigan
Lendvay et al. (2003) conducted a field demonstration of the relative performance of bioaugmentation and biostimulation through side-by-side closed-loop, recirculatory remediation test plots at the
Bachman Road Residential Wells Site in Michigan. Molecular analysis indicated that indigenous Dehalococcoides populations existed at the site, and this population was enriched (the Bachman Road
Culture) and used for the bioaugmentation plot. Two test plots (4.6 x 5.5 m) were constructed perpendicular to groundwater flow, separated by one plot of the same size. Each plot consisted of an
extraction well, two injection wells, and a series of performance monitoring points. A bromide tracer study was performed to quantify the hydraulics of each test plot, and a design recirculation flow rate of 7
gpm was selected for each plot. Both the biostimulation and bioaugmentation plots received lactate as an electron donor. The bioaugmentation test plot was preconditioned with a lactate (0.5 to 1.0 mM)
and nutrient feed prior to bioaugmentation. On day 29, 200 L (108 cell/mL) of the Bachman Road Culture was introduced into the bioaugmentation plot.
Relative to the control (biostimulation) plot, bioaugmentation resulted in a significant reduction in the time to achieve complete dechlorination to ethene. Complete dechlorination of PCE to ethene was
achieved within 6 weeks after inoculation in the bioaugmentation plot, whereas, after 4 months of operation nearly 76% of the PCE was converted to ethene in the biostimulation plot. Important findings of
this work include: (1) dechlorination in the bioaugmentation plot was demonstratively linked to the presence of Dehalococcoides; (2) Dehalococcoides populations grew (measurable numbers increased) as
system operation proceeded; (3) addition of Dehalococcoides can significantly shorten lag times to the onset of dechlorination; and (4) biostimulation approaches can achieve complete dechlorination to
ethene at sites where certain Dehalococcoides populations occur naturally.
Industrial Site, Boston, Massachusetts
GeoSyntec and ERM are performing a bioaugmentation pilot test at an industrial facility in Boston (Chang et al. 2002; 2003). Spent organic solvents, primarily TCE, were released to unconsolidated soils
through a dry well located interior to the main manufacturing building. The TCE is suspected to have traveled along building pilings downward to the basal unit of fractured bedrock. The pilot test area (PTA)
is located directly downgradient from the dry well. Concentrations of TCE in the pilot test area range from 30 to 120 mg/L. Due to the proximity to salt water, sulfate and chloride concentrations in shallow
bedrock were approximately 400 and 5,500 mg/L, respectively. Pre-design laboratory studies using PCR and 16S rDNA-based methods detected the presence of an indigenous Dehalococcoides
population. Microcosms studies confirmed that when supplied with an exogenous electron donor, the indigenous microorganisms could be stimulated to convert TCE to ethene. However, compared to
microcosms amended with the KB-1™ culture, the rate of ethene production achieved by the native bacteria was much slower, even after a six month incubation period. Based on the results of the
laboratory trials, bioaugmentation was selected for the field pilot test.
A recirculatory, forced-gradient pilot test system was designed based on the demonstrated success of achieving effective reagent delivery and maximum mass balances with these types of pilot-scale systems
for bioremediation applications at other sites (e.g., Hopkins and McCarty 1995; McCarty et al. 1998; Ellis et al. 2000). The PTA is comprised of an injection well, extraction well, and three monitoring
wells. The PTA layout was oriented such that the induced gradient was parallel with the prevailing ambient flow direction and hydraulic gradient to minimize leakage from the pilot test area. Prior to
performing any biological trea™ents, the hydraulics of the PTA (i.e., flow rates, residence time, capture, mass recovery) were quantified via tracer testing with iodide. The tracer test demonstrated hydraulic
connectivity across the PTA, but only 15% of the iodide delivered to the injection well was recovered at the extraction well. These results indicated a high degree of mixing between the recirculation cell and
ambient groundwater. Subsequent observation in the vicinity of the Site revealed that dewatering activities at a neighboring property caused periodic 90-degree changes in the hydraulic gradient in the PTA.
Example results for the pilot system are illustrated in Figure B-3. The PTA was fed acetate for the first 3 months of operation for the purpose of establishing reducing conditions in the test zone, prior to
bioaugmentation. During this preconditioning period, sulfate concentrations and oxidation/ reduction potential (ORP) decreased linearly, and TCE was dechlorinated to cis-DCE. Dechlorination did not
proceed beyond cis-DCE prior to bioaugmentation. During the fourth month of operation (June 2002), the PTA was augmented with KB-1™ and methanol was added as a supplemental electron donor.
Acetate addition was discontinued in October 2002 due to site-specific reasons. Bioaugmentation was achieved by transferring 40L of KB-1™ culture from the stainless steel culture containers into the
injection well. Argon gas was used to displace the culture from the containers and push it into the well. The bioaugmentation culture volume was calculated based upon a design target of 0.01% of the pore
volume in the PTA.
As shown in Figure B-3, TCE and cis-DCE have been degraded to below their respective State remediation standards throughout the PTA. Transient accumulations of cis-DCE and VC appeared at peak
concentrations that were approximately equivalent to the initial micromolar concentration of TCE. Detectable conversion of VC to ethene began in the latter half of 2002, a few months after bioaugmentation.
In 2003, production of ethene has continued to increase; however, VC losses have not been balanced by ethene increases. The cause for this gap is not known, but is likely related, in large part, to dilution of
the plume in the PTA as a result of the shifting hydraulic gradients at the Site. Molecular assays (PCR and genetic analyses) of groundwater samples collected from the PTA after bioaugmentation indicate
that the density of Dehalococcoides populations in the PTA has increased significantly since bioaugmentation.
Caldwell Trucking NPL Site, New Jersey
Golder Associates and GeoSyntec are operating a bioaugmentation/biostimulation system to treat a PCE/TCE DNAPL source area in fractured bedrock groundwater at the Caldwell Trucking Superfund
Site in New Jersey. The system is treating a source area in fractured basaltic bedrock in a test area measuring approximately 120 feet wide, and 40 feet long. The source area was bioaugmented (February
2001) with the KB-1™ culture, and electron donors (methanol, lactate and acetate) are added periodically in a batch mode via multiple injection wells. Groundwater circulation is not a component of this
design. Initially, electron donor was added on a weekly basis. After monitoring results showed relatively slow trea™ent performance, the frequency of donor addition was increased to a daily basis. Example
performance monitoring results are provided in Figure B-4. As of Fall 2002, results indicated an order of magnitude decline in PCE/TCE concentrations, with an accompanied increase in the concentration of
cis-DCE and VC. There is evidence that cis-DCE production has peaked and concentrations are starting to decline. TCE concentrations in the well containing the highest TCE concentration (680 mg/L)
have declined by 90 percent. Furthermore, the use of molecular probes has demonstrated that the Dehalococcoides microorganisms that were injected in the KB-1™ culture have become distributed
throughout the test area.
Compared to the other bioaugmentation projects described above, the rate of trea™ent at Caldwell has been somewhat slower. One primary reason for this observation is that the Caldwell system is treating
a DNAPL source area, while the other projects (except for the Boston site) are treating dissolved phase plumes. Other key factors affecting the rate of trea™ent performance at Caldwell include electron
donor delivery design and a presence of chloromethanes and chloroethane co-contaminants. While the Dover AFB, Kelly AFB, Bachman Road, and Aerojet bioaugmentation systems used forced gradient,
groundwater circulation to deliver electron donor, the Caldwell system uses batch injection. High concentrations of chloroform (CF) and 1,1,1-trichloroethane at Caldwell also likely compete for electron
donor, and slow the relative rate of cis-DCE and VC conversion to ethene.
Aerojet General Corporation, Sacramento, California
A field demonstration was initiated to assess TCE dechlorination in a deep aquifer at the Aerojet Superfund site in California (Cox et al., 2000; 2002). Previous laboratory microcosm studies for the Aerojet
site had shown that TCE dechlorination consistently stalled at cis-DCE, unless bioaugmented with dehalorespiring bacteria. The addition of lactate alone to the pilot test area (PTA) groundwater failed to
promote significant TCE dechlorination past cis-1,2-DCE (VC and ethene were not produced). Bioaugmentation of the PTA with KB-1 immediately accelerated the rate of TCE and cis-DCE
dechlorination, and VC and ethene production from cis-1,2-DCE were observed within 8 days following bioaugmentation. Within 125 days, the concentrations of TCE (starting from 2 mg/L), cis-DCE,
1,1-DCE and VC were below respective MCLs in the PTA. Molecular characterization techniques (16S rRNA screening using PCR) were used to evaluate the presence of Dehalococcoides: i) prior to
bioaugmentation, to assess the effects of electron donor addition alone; and ii) following bioaugmentation to track the success of KB-1 addition, and to assess its transport and survival in the PTA
groundwater. Initial sample analyses were negative, suggesting that Dehalococcoides was not present in the PTA groundwater. A few days after bioaugmentation, a strong signal representative of the
Dehalococcoides strain in KB-1 was detected in the PTA well where KB-1 was introduced to the aquifer. A final sample round for Dehalococcoides was collected 75 days after bioaugmentation, and all
wells in the PTA, to a distance of 50 feet from the point of introduction, indicated moderate to strong DHE signal suggesting transport of KB-1 through the PTA.
Table B-1. Selected Field Demonstrations.
| Site Name, Location |
VOC |
Contaminant Concentration |
Geology |
Culture |
Culture Volume Used (L) |
System Scale |
Reference |
| Dover Air Force Base, Dover, DE |
TCE |
5 mg/L |
Silty sands |
Pinellas |
350 |
Pilot |
Ellis et al. 2000 |
| Kelly AFB, San Antonio, TX |
PCE |
2 mg/L |
Shallow silty gravel |
KB-1 |
13 |
Pilot |
Major et al. 2002 |
| Bachman Road, Lake Huron, MI |
PCE |
|
Fine to medium grained sand |
Bachman
Road
|
200 |
Pilot |
Lendvay et al. 2003 |
| Aerojet, Sacramento, CA |
TCE |
2 mg/L |
Deep alluvium |
KB-1 |
50 |
Pilot + Full |
Cox et al. 2000; 2002 |
| Caldwell Trucking NPL, NJ |
TCE |
200 mg/L |
Fractured Basalt |
KB-1 |
160 |
Full |
Finn et al. 2003 |
| Industrial Site, MA |
TCE |
80 mg/L |
Fractured Bedrock |
KB-1 |
40 |
Pilot |
Chang et al. 2002; 2003 |
Figure B-1. Pilot test well layout and inferred groundwater flow lines for Dover AFB bioaugmentation demonstration (from Ellis et al. 2000). (EW = extraction well; IW = injection well).
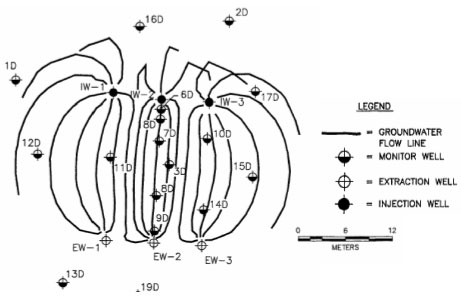
Figure B-2. Performance monitoring results for bioaugmentation test plot at Kelly AFB (Major et al. 2002)
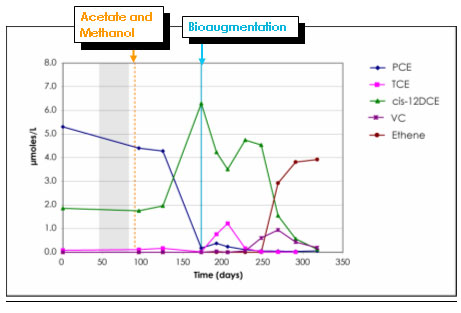
Figure B-3. Performance monitoring results (MW-1004B) for bioaugmentation demonstration in fractured bedrock, Boston, Massachusetts.
Figure B-4. Example performance monitoring results (MW-C14) for bioremediation system at Caldwell Trucking NPL site.
Klik her for at se figuren.
SUMMARY
The successful application of bioaugmentation for in situ remediation of chlorinated solvents in groundwater has been demonstrated by multiple research teams at multiple sites. These technology
demonstrations have been validated through critical evaluations, expert peer-review, and publication in leading scientific journals. As shown by these demonstrations, bioaugmentation with certain
Dehalococcoides cultures can achieve in situ dechlorination half lives on the order of hours for chloroethenes, and thereby dramatically shorten the timeframe for attaining compliance with cleanup criteria. In
addition, each of the case studies demonstrated the benefits of applying molecular assays (i.e., 16S rDNA-based PCR) for tracking the growth and transport of bioaugmentation cultures. From these works,
it is evident that exogenous cultures can survive, proliferate, and potentially migrate significant distances in the subsurface.
The projects reviewed here all have several recommended design elements in common, including (1) pre-design studies to identify appropriate electron donors and identify the need for bioaugmentation; (2)
simple groundwater flow modeling to quantify system hydraulics of trea™ent areas; (3) tracer testing to calibrate system flow models and confirm connectivity between injection and monitoring points within a
trea™ent area; (4) execution of pilot test to verify feasibility and quantify performance prior to design of a full-scale system; and (5) confirmation of trea™ent performance through mass balance analysis,
geochemical monitoring, and molecular monitoring. It should be recognized that the intensive monitoring programs used in most of these cases studies (i.e., extensive sampling requirements) was only
appropriate because these projects were technology demonstrations. The resource requirements for routine pilot- and full-scale bioaugmentation applications are typically less than the examples described
here.
| Forside | | Indhold | | Forrige | | Næste | | Top |
Version 1.0 Februar 2005, © Miljøstyrelsen.
|