|
| Forside | | Indhold | | Forrige | | Næste |
Frakturer fra lodrette testboringer pĺ Vestergade 10 Haslev
Bilag F
Fracture Propagation Modeling
For Fractures Created at
Vestergade 10
Haslev, Denmark
31 January 2001 – 6 February 2001
Provided to:
NCC Danmark A/S
Kirkebjerg Alle 88
DK-2605 Brøndby
Denmark
Submitted by:
FRx, Inc.
P.O. Box 498292
Cincinnati, Ohio
45249
USA
March 2001

Summary
The fracture propagation model CIRFRX has matched pressure and uplift data collected during creation of the fractures at Haslev in February 2001. Inputs to the model included the operational parameters (injection rate, depth, etc.) used to create the fracture. Three geotechnical parameters, elastic modulus, facture toughness (or stress intensity), and leak-off coefficient were varied to obtain a close matches of early time data, when the model should most accurately reflect reality, and late time, which provides overall characterization of the fracturing process at Haslev. In all cases, the values of the independent parameters fall within the range of expectation. If the soil and fractures at Haslev truly conform to the assumptions of the model, the shallow fracture should have a sand-filled radius between 3 and 5 meters with maximum propped thickness of 3mm to 2mm, respectively. Likewise the deep fracture should have a sand-filled radius of about 4 meters with maximum propped thickness of 2mm.
Model Characteristics and Applications
CIRFRX is a propriety analytical model of fracture form that is based on the physics of a strictly horizontal fracture that propagates from the perimeter of a disk-shaped cavity in homogeneous media. It utilizes theories of linear elastic failure mechanics as developed by Murdoch [1993]. Further, it incorporates concepts of leak-off, confining stress (overburden pressure), and rheology within the fracture cavity. It accepts operational parameters such as injection rate, depth, slurry viscosity, fluid: solid ratio, injected volume, and sand grain size. It also requires geotechnical data such as the elastic modulus, Poisson’s ratio, unit weight, toughness and leak-off coefficient for the soil surrounding the fracture. As a simple analytical model, it assumes axial symmetry around the injection well and ignores heterogeneities and other factors that certainly influence the propagation of real fractures. In practice, the uncertainty typical of geotechnical parameters further diminishes the precision and accuracy of this model. Nonetheless, we successfully have used CIRFRX to perform parametric studies.
As with many models of physical systems, matching the predictions of the model to experimental data can enhance validity. CIRFRX provides predictions of fracture length, maximum aperture, and fracturing pressure as functions of injection time. Establishing a history match with fracture length would require a means of observing or detecting the tip of fracture while it is propagating. While this can be accomplished by placing detectors in monitoring wells along the expected pathway of the fracture, in practice the fourth order dependency of fracture length coupled with the effort of installing monitoring wells render these data unreliable, overly expensive, or too sparse. In contrast, reasonable estimates of aperture and pressure can be made with ease and at sufficient time intervals to render a full spectrum of data. Specifically, aperture can be inferred from uplift, or surface deformation during creation of the fracture, and propagation pressure can be estimated from wellhead injection pressure. Uplift provides reasonable estimates of aperture if the facture is close to the surface in comparison to its depth and if the overlying formations are sufficiently non-deformable. Fracture propagation pressure can be estimated from wellhead pressure by compensating for (1) head imposed by the depth of the well and (2) friction losses due to flow.
Model Input and Results
The CIRFRX model was used to generate two sets of predictions that fit and bracket the monitoring data collected during the creation of the fracture T1 at Haslev. The input parameters either were taken from the operational record or were assumed to have a value within an expected range. Table 1 provides a list of the input data. Three parameters were varied to obtain the predictions. All of the variations fall within the typical range of values.
Table 1 Model Input Parameters This list compiled from the source data file and can be confirmed by comparison to the echo of input data listed in the output files, which are presented in Appendix “A” and Appendix “B”. The second column provides justification for the values uses.
| Input Parameter |
Source or Justification |
T1 Early Time Match |
T1 Late Time Match |
T2 Early Time Match |
T2 Late Time Match |
| Slurry Flow (l/min) |
From operational record |
45.88 |
45.88 |
45.88 |
45.88 |
| Depth (m) |
From operational record |
4.3 |
4.3 |
7.8 |
7.8 |
| Initial slot (cm) |
Typical range 10 to 30 |
30 |
30 |
30 |
30 |
| Modulus (kPa) |
Varied to obtain match
Typical Range 6000 - 60000 |
56250 |
14000 |
90000 |
30000 |
| Poisson ratio |
Typical value |
0.3 |
0.3 |
0.3 |
0.3 |
| Viscosity (cp) |
Typical Range 20 to 200 |
200 |
200 |
200 |
200 |
| vol sand/vol fluid |
From operational record |
0.248 |
0.248 |
0.307 |
0.307 |
| max pressure (psi) |
Not used in history match option |
46 |
46 |
46 |
46 |
| name of frx |
|
Haslev |
Haslev |
Haslev |
Haslev |
| total frx vol (L) |
From operational record |
392.6 |
392.6 |
332 |
332 |
| Frx radius (m) |
Not used in history match option |
4.00 |
4.00 |
4.00 |
4.00 |
| leakoff factor (cm2/sec) |
Varied to obtain match
Typical Range 0.002 - 0.03 |
0.003 |
0.027 |
0.001 |
0.005 |
| unit weight soil (kPa/m) |
Typical value |
22 |
22 |
22 |
22 |
| porosity of sand |
Typical value |
0.4 |
0.4 |
0.4 |
0.4 |
| aperture for sd (cm) |
Typical value |
0.2 |
0.2 |
0.2 |
0.2 |
| output file name |
|
T1.out |
T1.out |
|
|
| fracture toughness kPa cm1/2 |
Varied to obtain match
Typical Range 500 - 1500 |
750 |
1160 |
750 |
1260 |
The model is complex so that each parameter can affect multiple characteristics of the predictions. Nonetheless, each of the three parameters was manipulated for a specific purpose.
- Modulus – The ratio of the elastic modulus and toughness control the proportion of the fracture radius and uplift. Greater ratios make longer, thinner fractures.
- Leak-off coefficient – This parameter lumps several flow characteristics of soil immediately surrounding the fracture. It controls the amount of fluid that exits through the fracture surfaces into pores of surrounding soil during creation of the fracture.
- Fracture toughness – This reflects the stress intensity that develops around the tip of the propagating fracture. In conjunction with the elastic modulus it controls the proportion of the fracture, as discussed above. Furthermore, it linearly affects the fracture propagation pressure, so variation has the effect of increasing or decreasing the range of pressure.
The model provides predictions of fracture length, aperture, and propagation pressure as functions of time. The final values of length, aperture, and pressure are summarized in the output data files, which are presented in Appendix “A” and Appendix “B”. Table 2 lists the key independent results, which are the radius, the maximum aperture, and the fluid efficiency – all other outputs are derived from combinations of these values and the inputs. The fluid efficiency for the late-time match is unusually low for fractures created in low permeability soils. Its value suggests the final fracture form or the matched data do not conform to the assumptions of the model.
Table 2 Key Final Results Although the summary output of the model includes many more lines of information, much is derived from the values listed below. For instance, the propped radius, which is the radius where the pressurized aperture equals the diameter of a grain of sand, is obtained by specifying an “s” shaped distribution of aperture between the maximum (at the origin) and zero at the radius and determining where the aperture is equal to the size of the sand. Also, the maximum propped aperture is the product of the maximum pressurized aperture and the volume fraction of solids injected (with accounting for leak-off). The fluid efficiency is the fraction of injected liquid that remains in the fracture and is a measure of the importance of the leak-off coefficient.
| Key Result |
T1 Early Time Match |
T1 Late Time Match |
T2 Early Time Match |
T2 Late Time Match |
| Radius: |
25.4 ft, (7.74 m) |
13.1 ft, (3.99 m) |
35.1 ft, (10.7m) |
22.3 ft, (6.8m) |
| Maximum pressurized aperture: |
0.53 cm |
0.87 cm |
0.26 cm |
0.52 cm |
| Propped radius: |
15.77 ft, (4.81 m) |
9.58 ft, (2.92 m) |
12.30 ft, (3.75m) |
13.86 ft, (4.23m) |
| Maximum propped aperture: |
0.16 cm |
0.29 cm |
0.09 cm |
0.19 cm |
| Fluid efficiency: |
0.8427 |
0.3707 |
0.9288 |
0.7655 |
Uplift Match for T1
Uplift data were collected for a location within 20 cm of the injection well during the creation of the fracture at 4.3 m bgs. Measurements were made through a surveyors’ telescope directed at a graduated staff erected next to the injection wellhead. These data were collected at intervals of approximately 40 seconds. Figure 1 shows the time sequence of these data. Uplift increased monotonically but not linearly. During the first three minutes the rate of increase of uplift near the injection well slowly diminished, following a pattern predicted by CIRFRX. Afterwards the rate of increase intensified. In the final minutes, uplift increased more slowly, and seemed to exhibit the concave downward trend predicted by the model. This late time behavior suggests that the fracture developed into a second form that somewhat conformed to the model assumptions and that a late time history match may have some validity for scaling beyond the size of this fracture.
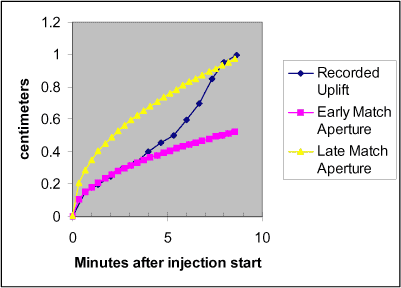
Figure 1 History match of uplift data collected during creation of T1. Uplift measurements (solid diamonds) were made for a location 20 cm north of the injection well. We assumed uplift provides a direct measure of the aperture of the underlying fracture and further that the central uplift measures the maximum aperture of the fracture (a condition which is slightly violated by the asymmetry of most hydraulic fractures.) A history match of the first three minutes is depicted as solid squares. During early time the fracture is most likely to conform to the assumptions of the model. A history match that generates the final uplift value is shown as the solid triangles. This late time match provides an overall characterization of the fracturing process at Haslev. Parameters used in these history matches are listed in Table 1.
Three geotechnical parameters (elastic modulus, toughness or fracture tip stress intensity, and leak-off coefficient) were varied to match predicted aperture to uplift data. The reliance upon a direct match between aperture and uplift collected for a central location assumes (1) that uplift provides an adequate measurement of aperture and (2) that the maximum aperture occurs at the central location.
Typical fractures violate these assumptions to varying degree. Even under ideal conditions of homogeneity and strict elasticity, deep fractures, i.e. fractures of small extent compared to depth, disrupt a much broader area of surface than the projected plan of the fracture. Specifically, the vertical strain immediately above the fracture is dissipated radially so that from greater depth a greater surface is affected. A pea under a mattress is an analogy of this effect. Furthermore, elasticity or plasticity of overlying soils can dampen induced strain and render uplift smaller than aperture. In any case, the maximum uplift above a horizontal fracture (and presumably maximum aperture) rarely coincides with the injection well. Rather the maximum shifts among different locations while the fracture is being created.
Within scope of these qualifications, we have confidence in the early time history match for fracture T1. The subject fracture at Haslev was created at a depth of 4.3 m. The CIRFRX model, using parameters to make the early time history match, predicts that the fracture reached a radius of more than 5 meters within three minutes. Note, this is the radius of the fracture tip, which is microscopically fine, as opposed to the radius in which sand can be transported. Thus we can feel comfortable that the pea-under-the-mattress effect did not play a significant role in the early-time match. Also, only a few centimeters of gravel on the surface appeared to be the only soil structures that might have the capacity to attenuate the strain induced by the fracture. Finally, during early time we can presume that the fracture has not propagated sufficiently far from the well to assume significant asymmetry. Indeed, quantitative characterization of the final uplift pattern proved to be more symmetric than typical.
The late-time history match may be considered incidental. The variation of actual uplift between 3 and 8 minutes suggests departure from the assumptions of the model or the history match process. Certainly, the maximum final uplift was found one meter east of the central point for which the uplift data in Figure 1 were collected. However, the relative symmetry suggests stronger factors were important. The doming cracks that were observed around T1 may be significant. These cracks appeared during the second half to the injection episode and allowed the soil to accommodate the strain induced by the underlying fracture. The opening of the doming cracks represents the formation of new space in the soil under the uplift measurement staffs, and some of the uplift may be an accounting of this new space. If so, then the recorded uplift exaggerates the actual aperture of the fracture created 4.3 meters below ground.
Pressure Match for T1
A transducer connected to the wellhead measured the injection pressure. The transducer provided both electronic and visual output. The electronic data were collected by a datalogger at fairly large time intervals, so the manually recorded data are shown Figure 2 as solid squares. Following a sequence typical of horizontal hydraulic fractures, the pressure initially increased to a maximum and quickly decreased, or “broke-down” to propagation pressure. After about a minute, pressure increased, probably due to the arrival of sand-laden slurry to the bottom of the well. After about 2.5 minutes, pressure gradually decreased throughout creation of the fracture.
CIRFRX does not include concepts that can explain the second increase in pressure. Consequently, two history matches were performed, one to match early-time data just after breakdown and the other to match the late-time data. These matches are shown as solid squares and solid triangles in Figure 2. Three input parameters were varied to obtain the match, as listed in Table 1.
The late-time history match validates only the last minute. The basic structure of the model precludes a more thorough match. The primary component of pressure prediction is the fracture propagation pressure, which depends upon the ratio of the modulus and toughness is inversely proportional to the square of the fracture radius. Since the fracture radius increases approximately as the fourth root of time, the propagation pressure decreases as the square root of time. The model predicts a wellhead pressure, which we match, by adding a constant term for the head difference due to the depth of the well and a very small term that accounts for friction losses due to the flow of slurry through the fracture gap. The flow term varies with the log of time, so after the first minute acts much as the constant term. Thus the form of the predicted pressure is strongly concave upward. This characteristic impacts the ability to history match periods of steadily declining pressure. For instance, if a pressure match were to be obtained for the entire interval after 3 minutes, the modulus and toughness would have to assume extremely unrealistic values. Consequently, the late-time match should be considered incidental. It may be possible to use the model to extrapolate fracturing process over a short span of operating conditions.

Figure 2 History match for collection of pressure data during creation of T1. A transducer measured wellhead injection pressure. The first maximum, of about 40 psi, is the breakdown pressure, or the pressure at which the fracture crack first forms in the soil surrounding the disk-shaped cavity. Breakdown pressure is not predicted by CIRFRX, but the subsequent decreasing pressures are matched by the model using the early-time parameters. The pressure increase after 1 minute coincided with the arrival of sand-laden slurry to the bottom of the well. The effect suggests either a departure of fracture propagation from key model assumptions or an inadequate modeling of rheology within the fracture, or both. A history match of the first three minutes is depicted as solid squares. During early time the fracture is most likely to conform to the assumptions of the model. A history match that generates the final uplift value is shown as the solid triangles. This late time match provides an overall characterization of the fracturing process at Haslev. Parameters used in these history matches are listed in Tabel 1.
Matches for T2
Parameters used to obtain history matches for T1 were used as initial values for matching T2. By use of a greater modulus and lesser leak-off coefficient, the model achieved a match of early-time uplift and pressure data. This same prediction reasonable matched the final uplift observation. A second set of model parameters was necessary to achieve a match of late-time pressure data. However, the model overstated the uplift by a factor of two when the second set of parameters was used. Both sets of parameters predicted a propped fracture radius of about 4 meters. In both cases the predicted propped aperture was thin – less than 2 mm. This is consistent with the difficulty of identifying traces of T2 in the cores recovered from the site.
The input data for the T2 history matches are listed in Table 1 and the key results are presented in Tabel 1. Figure 3 and Figure 4 present the time sequence of the history matches of uplift and pressure.
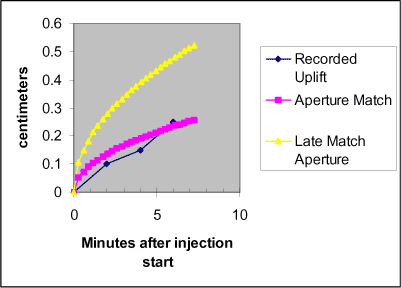
Figure 3 History match of uplift data collected during creation of T2. Uplift measurements (solid diamonds) were made for a location 20 cm south of the injection well. We assumed uplift provides a direct measure of the aperture of the underlying fracture and further that the central uplift measures the maximum aperture of the fracture (a condition which is slightly violated by the asymmetry of most hydraulic fractures.) A history match of the first three minutes is depicted as solid squares. During early time the fracture is most likely to conform to the assumptions of the model. A history match that matches late-time wellhead injection pressure is shown as the solid triangles. This late time match provides an overall characterization of the fracturing process at Haslev. Parameters used in these history matches are listed in Table 1.
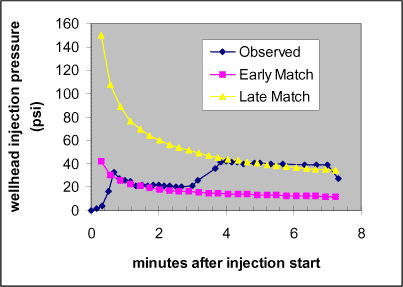
Figure 4 History match for collection of pressure data during creation of T2. A transducer measured wellhead injection pressure. The first maximum, of about 35 psi, is the breakdown pressure, or the pressure at which the fracture crack first forms in the soil surrounding the disk-shaped cavity. Breakdown pressure is not predicted by CIRFRX, but the subsequent decreasing pressures are matched by the model using the early-time parameters. The pressure increase after 31 minutes cannot be attributed to any process event. The effect suggests either a departure of fracture propagation from key model assumptions. A history match of the first three minutes is depicted as solid squares. During early time the fracture is most likely to conform to the assumptions of the model. A history match that matches the final three minutes is shown as the solid triangles. This late time match provides an overall characterization of the fracturing process at Haslev. Parameters used in these history matches are listed in Table 1.
Conclusions
The CIRFRX model can history match portions of the data collected during the creation of fracture T1 at Haslev.
The early time match provides the most reliable estimates of geotechnical parameters and fracture form because the small fracture probably best fits the assumptions of the model. Indeed the modulus, toughness, and leak-off coefficient used to obtain the early-time history match all fall within the range of expectation. Use of these parameters predicts a fracture with a propped length of about 5 meters. The 2 mm aperture predicted by use of these parameters understates the 3 mm observed in several cores collected from the site.
A late time match can be obtained for the purpose of providing an overall characterization of the fracturing process. The match should be considered incidental for at least five reasons. (1) The match relies upon greater leak-off than typically encountered in low-permeability glacial tills. (2) The model does not include any concepts that can reasonably predict long periods of declining pressure such as occur during the second half of injection. (3) The predictions of pressure and uplift match only the final values. (4) The validity of uplift measurements may be compromised by formation of doming cracks, which are additional space. (5) The final fracture was asymmetric. Despite these five flaws, the late time match provides a maximum bound of fracture aperture (0.29 cm) that appears to be born out by observation of cores collected from the site. The corresponding minimum bound to the predicted radius of the fracture is about 3 meters.
Appendix “A”
T1 Early Time History Match CIRFRX Output
haslev1.out
******************************************
Analysis of horizontal, circular hydraulic fracture
Using CIRFRX 1.1 by FRX Inc.
File: haslev1.out
******************************************
*************************** Input **************************
Flowrate l/min:  45.8800,   12.1215 gpm
Depth:   4.3000 m,  14.1040 ft
Modulus kPa:  56250.00
Poisson ratio:  0.30
Viscosity cp: 200.000
Sand/fluid: 0.248
Max Pressure (psi): 46.000
Slot radius (cm): 10.000
Leakoff coefficent: cm/min1/2:  0.003
Unit weight soil: 22.000
Min. frx aper for sand (cm): 0.2000
Slot radius (cm):  30.00  Borehole radius (cm):   1.50
*************************** Results **************************
Radius:     13.1 ft,              Duration:      8.6 minutes
Toughness (kPa cm1/2): 750.00
Propped radius:   0.13 ft,       Minimum aperture for sand: 0.2000 cm
Volume in Fracture (gal):      6.2     Lost Volume:      1.1 gal
Pumped volume (gal):    103.7         Fluid efficiency: 0.0596
Gel volume:     83.1 gal,                Sand volume:   20.6
Total Bulk Volume Sand:     34.4 gal,            4.6 cuft
Gel rate:      9.7 gpm,          Bulk sand rate:  53.75 lbs/min
Lbs. sand/gal gel:   5.48
Maximum pressurized aperture:     0.14 cm               At half radius:     0.08 cm
Maximum propped aperture:     0.05 cm
Max propped aperture at half radius:     0.03 cm
Appendix “B”
T1 Late Time History Match CIRFRX Output
haslevC.OUT
******************************************
Analysis of horizontal, circular hydraulic fracture
Using CIRFRX 1.1 by FRX Inc.
File: haslevC.OUT
******************************************
*************************** Input **************************
Flowrate l/min:  45.8800,   12.1215 gpm
Depth:   4.3000 m,  14.1040 ft
Modulus kPa:  14000.00
Poisson ratio:  0.30
Viscosity cp: 200.000
Sand/fluid: 0.248
Max Pressure (psi): 46.000
Slot radius (cm): 10.000
Leakoff coefficent: cm/min1/2:  0.027
Unit weight soil: 22.000
Min. frx aper for sand (cm): 0.2000
Slot radius (cm):  30.00  Borehole radius (cm):   1.50
*************************** Results **************************
Radius:     13.1 ft,              Duration:      8.6 minutes
Toughness (kPa cm1/2): 1160.00
Propped radius:   9.58 ft,       Minimum aperture for sand: 0.2000 cm
Volume in Fracture (gal):     38.4     Lost Volume:     43.5 gal
Pumped volume (gal):    103.7         Fluid efficiency: 0.3707
Gel volume:     83.1 gal,                Sand volume:   20.6
Total Bulk Volume Sand:     34.4 gal,            4.6 cuft
Gel rate:      9.7 gpm,          Bulk sand rate:  53.75 lbs/min
Lbs. sand/gal gel:   5.48
Maximum pressurized aperture:     0.87 cm               At half radius:     0.49 cm
Maximum propped aperture:     0.29 cm
Max propped aperture at half radius:     0.16 cm
Appendix “C”
T2 Early Time History Match CIRFRX Output
t2Early.OUT
******************************************
Analysis of horizontal, circular hydraulic fracture
Using CIRFRX 1.1 by FRX Inc.
File: t2Early.OUT
******************************************
*************************** Input **************************
Flowrate l/min:  45.8800,   12.1215 gpm
Depth:   7.8000 m,  25.5840 ft
Modulus kPa:  90000.00
Poisson ratio:  0.30
Viscosity cp: 200.000
Sand/fluid: 0.307
Max Pressure (psi): 46.000
Slot radius (cm): 10.000
Leakoff coefficent: cm/min1/2:  0.001
Unit weight soil: 22.000
Min. frx aper for sand (cm): 0.2000
Slot radius (cm):  30.00  Borehole radius (cm):   1.50
*************************** Results **************************
Radius:     35.1 ft,              Duration:      7.2 minutes
Toughness (kPa cm1/2): 750.00
Propped radius:  12.30 ft,       Minimum aperture for sand: 0.2000 cm
Volume in Fracture (gal):     81.5     Lost Volume:      7.2 gal
Pumped volume (gal):     87.7         Fluid efficiency: 0.9288
Gel volume:     67.1 gal,                Sand volume:   20.6
Total Bulk Volume Sand:     31.7 gal,            4.2 cuft
Gel rate:      9.3 gpm,          Bulk sand rate:  58.65 lbs/min
Lbs. sand/gal gel:   6.79
Maximum pressurized aperture:     0.26 cm               At half radius:     0.14 cm
Maximum propped aperture:     0.09 cm
Max propped aperture at half radius:     0.05 cm
Appendix “D”
T2 Late Time History Match CIRFRX Output
t2late.OUT
******************************************
Analysis of horizontal, circular hydraulic fracture
Using CIRFRX 1.1 by FRX Inc.
File: t2late.OUT
******************************************
*************************** Input **************************
Flowrate l/min:  45.8800,   12.1215 gpm
Depth:   7.8000 m,  25.5840 ft
Modulus kPa:  30000.00
Poisson ratio:  0.30
Viscosity cp: 200.000
Sand/fluid: 0.307
Max Pressure (psi): 46.000
Slot radius (cm): 10.000
Leakoff coefficent: cm/min1/2:  0.005
Unit weight soil: 22.000
Min. frx aper for sand (cm): 0.2000
Slot radius (cm):  30.00  Borehole radius (cm):   1.50
*************************** Results **************************
Radius:     22.3 ft,              Duration:      7.2 minutes
Toughness (kPa cm1/2): 1260.00
Propped radius:  13.86 ft,       Minimum aperture for sand: 0.2000 cm
Volume in Fracture (gal):     67.1     Lost Volume:     20.7 gal
Pumped volume (gal):     87.7         Fluid efficiency: 0.7655
Gel volume:     67.1 gal,                Sand volume:   20.6
Total Bulk Volume Sand:     31.7 gal,            4.2 cuft
Gel rate:      9.3 gpm,          Bulk sand rate:  58.65 lbs/min
Lbs. sand/gal gel:   6.79
Maximum pressurized aperture:     0.52 cm               At half radius:     0.29 cm
Maximum propped aperture:     0.19 cm
Max propped aperture at half radius:     0.11 cm
| Forside | | Indhold | | Forrige | | Næste | | Top |
Version 1.0 August 2006, © Miljøstyrelsen.
|