[Front page] [Contents] [Previous] [Next] |
Future Air Quality in Danish cities
2. Methodology
This chapter describes the overall approach and applied air quality models to estimate future air quality concentrations at street level.
Scenario Years
The assessment is carried out for the reference year 1995 and the scenario years: 2000, 2005, 2010, 2015 and 2020. All scenario years are run with meteorological parameters for the reference year 1995.
Species
Modelled substances include health related substances: NO2 (NOx), O3, CO and benzene. Predictions for particles are based on expert judgement since high quality air quality models for prediction of particle concentrations are not available at present but under development.
Cases
Future air quality levels are predicted in a street named Jagtvej in the central part of Copenhagen. Jagtvej is selected because it represents a near worst case situation and because a monitor station is present in the street and in the urban background. Furthermore, detailed traffic data is available. Jagtvej has an average daily traffic of about 24.000 vehicles, the street width is 25 meters with 3-5 storeyed buildings.
Additionally, calculations are carried out with less detailed input data for 103 other streets in the Copenhagen area with a wide range of traffic loads and street configurations to be able to generalise and relate the results to general traffic conditions in urban areas.
Nested Modelling
Nested Modelling
Future air quality levels are predicted in Jagtvej, Copenhagen by nested modelling taking into account emissions in the street, urban background levels and regional air quality levels. Interactions between the street air, the urban background air and the regional background air together with chemical transformations are modelled, see Figure 2.1.
Figure 2.1
Illustration of the overall nested modelling approach estimating regional, urban and
street air quality levels
In Figure 2.2 different components of the nesting modelling system is shown in greater details.
Figure 2.2 [Look here]
Illustration of the different components of the nested modelling approach
Regional Background Modelling
Regional Background levels
Figure 2.3
Example of model results from the DEM model shown on a 50x50 km2 grid. Annual
regional background concentrations of NO2 in 1995. Left: Europe. Right:
close-up of Denmark.
| Results for 1995 in ppb | 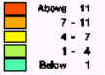 |

| Results for 1995 in ppb |  |

Regional background levels are predicted by the Danish Eulerian Model (DEM), a large-scale transport model based on 50x50 km2 emission grids and 150x150 km2 meteorological grids for all Europe (Zlatev 1995; Zlatev et al.1998). Development in European emissions is based on proposals for the new ECE protocols on regulation of trans-boundary air pollution, see Appendix 1. The model estimates hourly time-series of NOx, NO2, O3 and CO. The model runs on a super computer at UNI•C in Copenhagen. An example of model results is given in Figure 2.3.
Urban Background Modelling
Urban Background Levels
The urban background levels in Copenhagen are modelled by the dispersion model Urban Background Model (Berkowicz 1999) based on a 2x2 km2 emission grid for the urban area. Meteorological parameters are taken from an urban background top-roof mast at a nearby university building (HC �rsted Institute). Grid emissions are given by the Urban Emission Model (Danish Road Directorate 1996).
Urban Emission Model (UBE)
The Urban Emission Model (UEM) estimates vehicle emissions on a 2 x 2 km2 grid. The emission model takes into account the traffic levels on each road in each grid cell. The model covers an urban area of 151 km2 around Jagtvej in Copenhagen. The model was originally developed by the Danish Road Directorate (Danish Road Directorate 1996) but it has been improved as part of the present project with more vehicle categories, more detailed diurnal variation in traffic loads and new emission factors based on COPERT III.
The model domain is illustrated in Figure 2.4.
Figure 2.4 [Look
here]
Model domain of the Urban Background Model (UBM) and the Urban Emission Model (UEM).
Identification No. for each 2x2 km2 grid cell are also shown. Jagtvej in
Copenhagen is located in cell d4.
Species and Time Resolution
The following species are included: CO, NOx, NMVOC, particulates, and also CO2. The diurnal variation in emissions on an hourly basis is estimated for working days, Saturdays and Sundays further sub-divided in July and remaining months. CO and NOx emissions are used in the Urban Background Model to produce a time-series of these pollutants.
Road Types
Road types includes residential streets (30 km/h), traffic roads (50 km/h), arterial roads (60 km/h) and motorways (110 km/h).
Vehicle categories
The following vehicle types are included:
| Conventional gasoline passenger cars | |
| Closed loop catalyst gasoline passenger cars | |
| Conventional gasoline light duty vehicles (vans) | |
| Closed loop catalyst gasoline light duty vehicles (vans) | |
| Diesel passenger cars | |
| Diesel light duty vehicles (vans) | |
| Lorries (3.5-7.5 tonnes) | |
| Lorries (7.5-16 tonnes) | |
| Lorries (16-32 tonnes) | |
| Lorries (> 32 tonnes) | |
| Urban buses. |
Emissions
Development in traffic emission factors is based on the EU COPERT III emission model (see chapter 3).
Street Pollution Modelling
Danish Operational Street Pollution Model (OSPM)
Air pollution levels in the street are modelled by the Danish Operational Street Pollution Model (OSPM) as a contribution from the direct traffic emission in the street and a contribution from the urban background. (Berkowicz et al. 1997; Jensen 1997, 1998). The urban background is determined by the UBM model.
The OSPM model calculates hourly concentration levels of: CO, NO2, NOx (NO + NO2), O3 and benzene.
The model describes the physical and chemical process in the street. The model takes into account the street configuration (street orientation, width, building height etc.) and simple photo-chemistry between NO, NO2 and O3.
Figure 2.5 [Look
here]
The OSPM model describes the recirculation of air in a street canyon and simple
photo-chemistry.
Traffic data and Emissions
The diurnal variation in hourly traffic loads has to be given for working days, Saturdays and Sundays and further sub-divided in July and remaining months. Emission factors are also based on COPERT III.
[Front page] [Contents] [Previous] [Next] [Top] |