Effects of reduced pesticide use on flora and fauna in agricultural fields
4 Birds
(Petersen, B.S.)
The ornithological studies were aimed at describing the number of birds of different species utilizing the fields at different pesticide dosages. Although many factors may affect the distribution of birds in the agricultural landscape, it is believed that the number of birds occurring in a certain field, or dosage plot, is to a significant degree related to the amount of available food. The occurrence of birds in relation to the amount of animal and vegetable food resources is analysed and discussed in chapters 6 and 7.
The scale of the study and the resources available did not allow investigations of population size and dynamics – i.e., no attempts of measuring the absolute number of territories, production or survival rate were made. On the other hand, with three different crops, fifteen fields of >18 hectares, and three study years it is believed that the results are of considerable general value.
4.1 Pilot studies
The aim of the pilot studies was twofold: (1) to test and adjust the census methods in the field; (2) to collect data on the occurrence of birds on the study fields. The purpose of this initial collection of data was to check if the planned dimensioning of the study (number of fields, field size, sampling period, sampling frequency) was adequate to make the collection of a sufficiently large amount of data possible.
Two separate pilot studies were carried out. Firstly, a study was performed during the breeding season of 1996 on six fields at Gjorslev. Secondly, the occurrence of birds during the winter months was studied in the winter of 1996-97 on one field at each farm. The results of these investigations are briefly dealt with in the following. They do not contribute significantly to the elucidation of the main problem, but they provide documentation for the expedience of the methods used.
4.1.1 Breeding season 1996
During the breeding season, two investigations were conducted at Gjorslev. (1) On the three fields that were to be used in the main study (1997-1999), censuses were carried out with the purpose of providing data on the distribution of birds on the fields when these were homogeneously sprayed. This information could be important for the laying out of dosage plots as well as for the choice of census technique. (2) On the experimentally sprayed pilot test fields, a series of counts was carried out with the dual purpose of optimizing the census method and providing initial data on the possible differences in bird densities between dosage plots.
4.1.1.1 Field methods
The three main study fields were sown with winter wheat, spring barley and maize, respectively, in the harvest year 1995-96. All three fields are surrounded by hedges (cf. Fig. 1.3), and the study was primarily designed to reveal the effect of these hedges on the distribution of birds on the fields. Using marker sticks, each field was divided into four zones: 0-12 m, 12-50 m, 50-100 m and > 100 m from nearest hedge; a 0-12 m zone was also marked around any habitat islands within the fields. Each field was then divided into 12 census plots of approximately equal size (1.5-2 ha). Point counts of 10 minutes duration were carried out from the edge of each census plot. All birds seen or heard within or immediately above the census plot were recorded and assigned to one or more zones. Two censuses of each field (one between 8 and 11 a.m., one between 12 and 15) were carried out on five dates between 22 May and 17 June 1996, yielding a total of 10 (not independent) counts per field. For analysis, the number of individuals of each species recorded within each zone was calculated for each of the 10 counts separately, by adding up the counts from the 12 census plots.
In the pilot test fields, four 1.5 ha subplots (census plots) were delimited within each dosage plot. This subplot size roughly corresponds to the area of a field which can be surveyed from one point. Ten minutes point counts were carried out from the edge of each subplot. All birds seen or heard within or immediately above the subplot were recorded and assigned to one or more of the following four zones: hedge/habitat island; field 0-12 m (from hedge/habitat island); field > 12 m; air. Two censuses of each field (one between 8 and 11, one between 12 and 15) were carried out on 14 dates between 1 May and 11 July 1996. At the latter date, the number of birds in the cereal fields had clearly peaked, and the censuses were stopped. In the beet field, however, numbers were still high, and four additional censuses were carried out between 18 July and 12 August.
The counts revealed that some birds were not recorded when the observer was stationary at the census points, but were flushed or became vocal when the observer moved between the points. Therefore, the point counts were supplemented by transect counts from 21 June onwards. Each route through a subplot (from one census point to the next) formed a transect, and transect time was standardized at 5 minutes. Only birds within the subplot were recorded. In the analyses only registrations from the census points (not from the transects) were included. For each dosage plot, the counts from the four subplots were added up separately for the morning and afternoon counts, and the maximum of the two counts was used.
4.1.1.2 Analyses and results
The distribution of the seven most frequently recorded bird species on the homogeneously sprayed fields is shown in Table 4.1. There were no big differences between fields, so results from the three fields have been pooled in the presentation. It is clear from the table that all of the species are affected by the presence of hedgerows, either negatively (Skylark) or positively (the others). Because the census points were located along the hedges, the detection chance decreased (to an unknown degree) towards the mid-field. Thus, the Skylarks' avoidance of areas close to hedges is more pronounced than indicated by the data.
Table 4.1.
The distribution of selected bird species on homogeneously sprayed fields,
classified according to distance to nearest hedge. The mean number of individuals per
count is given. Percentages indicate the proportion of total field area belonging to each
distance zone or (for the first three bird species) proportion of total number recorded
within each of these zones.
Species |
Hedge & habitat island |
Field 0-12 m |
Field 12-50 m |
Field 50-100 m |
Field > 100 m |
Skylark |
|
1.13 (8%) |
3.20 (23%) |
5.37 (39%) |
4.23 (30%) |
Barn Swallow |
0.07 |
2.97 (32%) |
2.73 (29%) |
2.57 (27%) |
1.07 (11%) |
Sand Martin |
|
2.17 (37%) |
2.20 (38%) |
1.10 (19%) |
0.33 (6%) |
Blackbird |
2.80 |
0.23 |
|
|
|
Whitethroat |
8.80 |
0.33 |
|
|
|
Linnet |
5.80 |
0.70 |
0.30 |
|
|
Yellowhammer |
13.17 |
0.93 |
0.17 |
0.07 |
|
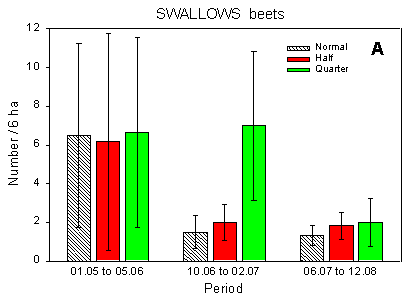
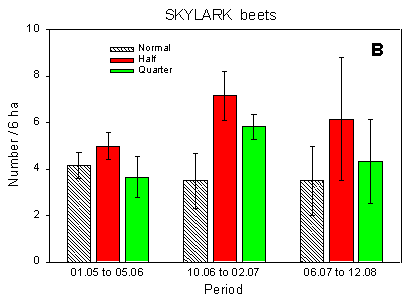
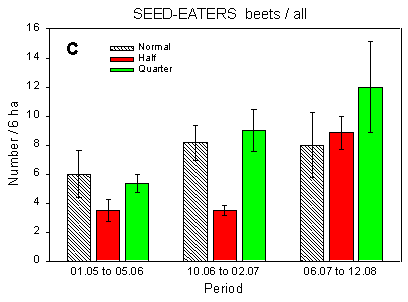
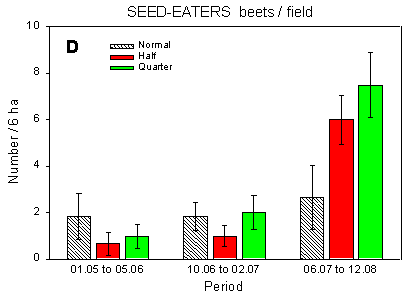
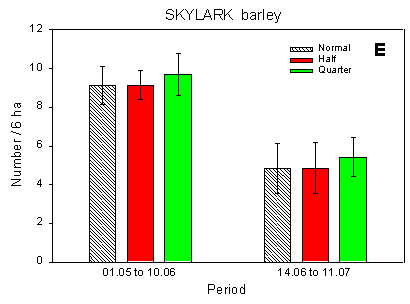
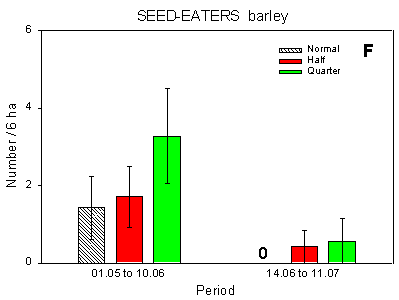
Fig. 4.1.
Examples of results0 from the bird counts on the pilot test fields, summer
1996. The mean number of individuals (+/– standard error) per count is shown for
plots with normal, half and quarter dosage. A: Beets; swallows and martins. B: Beets;
Skylark. C: Beets; seed-eaters (all records). D: Beets; seed-eaters (only birds on the
field). E: Barley; Skylark. F: Barley; seed-eaters (only birds on the field).
Some results of the counts on the experimentally sprayed pilot test fields are visualized in Fig. 4.1. The census period was divided into three parts for the beet field (1 May - 5 June; 10 June - 2 July; 6 July - 12 August) and two parts for the barley field (1 May - 10 June; 14 June - 11 July); in the wheat field no experimental sprayings were carried out. Results are shown for swallows, Skylark, and small seed-eaters (sparrows, finches and buntings).
The small seed-eaters occurring in farmland mainly feed in the fields but nest and seek cover in hedges and coverts. They are thus recorded on the field as well as in the surrounding hedges. For these species, analyses were carried out on all records as well as on the smaller sample of records from the field proper.
A formal test of differences between dosage plots is hampered by the lack of true replications; the observations on different dates within the breeding season are not strictly independent. However, to give at least some indication about the significance of the apparent differences, a log-linear model was fitted for each field and species (group), assuming the number of individuals recorded on a certain plot and date to follow a Poisson distribution. Likelihood ratio tests were used to test for differences between plots with respect to mean numbers and development in numbers between census periods. To be conservative, tests were adjusted for over-dispersion (variance greater than would be expected from a Poisson distribution), whereas under-dispersion (variance smaller than expected, indicating non-independence between observations) was not allowed. The analyses were performed using the GENMOD procedure in SAS/STAT software.
The following differences were found:
Beets, swallows: Significant differences between plots (p = 0.045*); pairwise contrasts reveal more birds at quarter dosage than at normal and half dosages (p = 0.025* and 0.047*, respectively). A closer look at the data shows that this difference did only occur in mid- and late June.
Beets, Skylark: Significant differences between plots (p = 0.0045**); more birds at half dosage than at normal (and maybe quarter) dosages (p = 0.0012** and 0.052, respectively).
Beets, seed-eaters (all): Significant differences between plots (p = 0.0092**); fewer birds at half dosage than at quarter (and maybe normal) dosages (p = 0.0024** and 0.054, respectively).
Beets, seed-eaters (field): Significant differences in development in numbers between plots (p = 0.019*); less positive development during the season at normal dosage than at half and quarter dosages (p = 0.0099** and 0.020*, respectively). No differences in overall mean numbers, but significant differences between plots in the last period (p = 0.029*); fewer birds at normal dosage than at quarter (and maybe half) dosages (p = 0.0090** and 0.053, respectively).
Barley, seed-eaters: Significant differences between plots (p = 0.014*); more birds at quarter dosage than at normal dosage (p = 0.0044**).
4.1.1.3 Discussion
The effects of hedgerows are clear from Table 4.1 as well as from the results presented in Fig. 4.1. In the beet field, the plots which received normal and quarter dosages were situated along the hedges surrounding the field whereas the half-dosage plot just bordered on hedges at its ends. Thus the Skylarks' avoidance of areas close to hedgerows is also the reason for their preference of the half-dosage plot. Conversely, the apparent avoidance of the half-dosage plot by the small seed-eaters, which include Linnet and Yellowhammer, (Fig. 4.1 C) is caused by their preference for hedgerows. Hedgerows may also affect the distribution of airborne species like swallows: swallows were fairly evenly distributed over the test field except on two observation days in mid-and late June, when quite strong westerly winds dominated and the swallows were almost exclusively foraging sheltered by the hedgerow bordering the quarter dosage plot (Fig. 4.1 A).
If only records of seed-eaters from the field proper are considered (Fig. 4.1 D), the balance between half and normal dosage is shifted in favour of the half-dosage plot. It is notable that there was a pronounced increase in numbers during the season in the plots with half and quarter dosage but not in the normal-dosage plot.
This might well reflect that towards the end of the season, more birds' food items were available in the half- and quarter-dosage plots than in the normal-dosage plot. Despite the name, the small "seed-eaters" during the breeding season to a large extent feed on arthropods, especially when feeding young (Christensen et al. 1996).
In the barley field, which was not bordered by hedgerows, a similar difference was found: significantly more small seed-eaters were recorded in the quarter-dosage plot than in the normal-dosage plot (Fig. 4.1 F). There were no differences in the distribution of Skylarks between plots.
Thus, from the ornithological pilot studies during the breeding season, two important conclusions emerged: (1) On the experimentally sprayed fields, some differences in the distribution of birds between dosage plots occurred. Dosage plots of 6 hectares and a sampling program with counts every fifth day during a three month period seemed sufficient to detect the differences. (2) The occurrence of hedgerows affects the distribution of all common farmland species to such an extent that even sizable treatment-related differences between plots may be masked.
Methodologically, it appeared that the point counts should be supplemented with line transects in order to increase the detection chance for stationary birds in the field. Further, it was clear that proper registration of swallows and martins demanded so much of the observer's attention that the registration of other, more important species suffered. So, as their distribution seemed to be very much affected by the meteorological conditions, it was decided that swallows, martins and swifts should not be recorded.
4.1.2 Winter studies
As part of the pilot studies, censuses were carried out during the winter of 1996-97 on four fields with autumn-sown wheat (the experimental wheat fields at Gjorslev, Lekkende, Oremandsgård and Nordfeld). Three counts per field were conducted between November and March. It was not clear from these pilot censuses whether the density of birds on the fields in winter was sufficient to allow statistical testing. Therefore, a full-scale winter study was carried out after the first project year (1997) on all 15 experimental fields.
4.1.2.1 Field methods
The winter counts were performed as line transects. Following a set pattern, the observer scoured each dosage plot, using a constant effort of 5 minutes per ha. All birds seen or heard on the field, above the field, or in hedgerows or habitat islands adjacent to the field were recorded. Before moving into the field, the observer scanned all three plots with a binocular, with the purpose of counting any birds of shy species that might be flushed when the transects were started. The number of birds recorded in each plot was converted to a standard plot size of 6 ha before analysis. Censuses were carried out between 1 November 1997 and 15 March 1998. Each of the 15 fields was visited twice a month, yielding a total of 9 counts per field.
4.1.2.2 Analyses and results
During the censuses 1996-97, a total of 168 birds of 21 species, or 4.7 birds per plot and count, were recorded (excluding a flock of 140 Common Gulls). No attempts to carry out any statistical analyses on this small sample were made.
In the winter of 1997-98, 4506 individuals of 49 species were recorded. Six species (groups) were selected for statistical analysis: Skylark, Crow, tits, Blackbird, Yellowhammer and small seed-eaters. Two analyses of the occurrence of Crow, Yellowhammer and seed-eaters were carried out: one using all records, one with records from hedgerows and habitat islands being excluded. Each of the three types of fields, winter wheat, "after wheat" (to be sown with beets) and "after beets" (to be sown with barley) was dealt with separately, so the total number of analyses performed was 27. Analysis of variance was used to test for differences between dosages treating the different farms as blocks. Because the repeated censuses of each plot were not strictly independent, the geometric mean of the 9 counts, calculated separately for each species (group), was used as the dependent variable. In the calculation of the geometric mean, the densities from the individual counts (which might contain zeros) were x+1 transformed.
Only one of the 27 tests for differences between dosages was significant at the 5% level: Blackbird on fields after wheat (p = 0.011*, more birds at quarter dosage than at half and normal dosages). A further two tests, both relating to the "after beets" fields, were significant at the 10% level, with the highest number of birds being found at normal dosage (Crow) and quarter dosage (Yellowhammer).
4.1.2.3 Discussion
The number of significant tests is equal to the number that would be expected by chance, if no true differences between dosage plots exist. The inevitable conclusion is that after one year of experimental treatments, no differences between dosages could be detected with respect to the occurrence of birds on the plots in winter. This is not very surprising, considering that the seed production of the year with experimental dosages was ploughed in during autumn.
Of greater importance is the fact that bird densities during winter proved quite low. Although a total of 4506 birds may sound impressive, the geometric mean number of individuals per count per plot (6 ha) did not exceed one in any of the species analysed. At such low densities, chance events become of considerable importance, and it was considered unlikely that any reliable differences between dosage plots could be detected. Therefore, winter counts were not performed during the remainder of the study period.
4.2 Methods
During the main phase of the study (1997-99), two kinds of ornithological investigations were carried out. Firstly, counts were performed on all 15 fields in all three study years from shortly after the germination of the spring crops until a few weeks before the harvest of barley and wheat. This census period coincides with the main breeding period of most bird species. Secondly, counts were carried out on the stubble fields in early autumn, from immediately after harvest until the fields were ploughed. These counts, coinciding with the dispersal and migration period, were performed in 1998 and 1999, i.e. after the winter counts were dropped.
4.2.1 Breeding season counts
4.2.1.1 Field methods
Each observation day, two kinds of censuses were carried out: morning counts (between 8 and 11 a.m.) and afternoon counts (between 12 and 15). Different methods were used for the two kinds of censuses. The morning counts were mainly based on point counts, and birds on the field as well as in the surrounding vegetation were censused. The afternoon counts were performed as line transects, and only birds on the field were censused. In all censuses, all species except swallows/martins and swifts were recorded.
In the morning, the sampling unit was the subplot. Before the counts began in early May, 12 subplots of about equal size were demarcated in each field. The number of subplots within each dosage plot was four or six, depending on the presence of hedgerows at the field borders and thus the comparability of plots (cf. section 4.1.1). If there were no hedges around a field, or if all three plots bordered on an equal amount of hedgerow and thus were directly comparable, four subplots of 1.5 ha were delimited within each plot (Fig. 4.2 A). In 7 of the 15 fields, however, the presence of hedgerows made it impossible to lay out three fully comparable dosage plots (Fig. 4.2 B). In these cases, six subplots of 1.0 ha were delimited within each of the two similar plots (always the normal- and quarter-dosage plots, cf. section 1.2.5), and the half-dosage plot was not censused during the morning counts.
The birds within each subplot were counted by means of a combination of point and transect counts. Firstly, a 10 minutes point count was carried out while the observer was stationary at the edge of the subplot. Then the observer spent 5 minutes walking through the subplot to the border of the next, adding to his list of records any birds within the subplot that had not been recorded from the census point. During the 15 minutes spent in each subplot, all birds seen or heard within or immediately above the subplot were recorded and assigned to one or more of the following four zones: hedge/habitat island; field 0-12 m (from hedge/habitat island); field > 12 m; air. Care was taken not to count an individual more than once. If a bird was recorded in more than one subplot, the observer assigned it to one, and just one of these. The chosen subplot should be the one where the bird did most of its feeding, not necessarily the one in which the nest was assumed to be located.
On the afternoon counts, the sampling unit was the plot, and all three plots were censused in all fields. Line transects were used. Following a set pattern, the observer walked through each plot, using a constant effort of 6 minutes per ha. All birds seen or heard within or immediately above the plot were recorded and assigned to one or more of the following three zones: field 0-12 m (from hedge/habitat island); field > 12 m; air. Because these counts primarily aimed at recording birds foraging in the fields, birds in hedgerows and habitat islands were not censused. Like at the morning counts, a bird recorded in more than one plot was assigned to one of these by the observer.
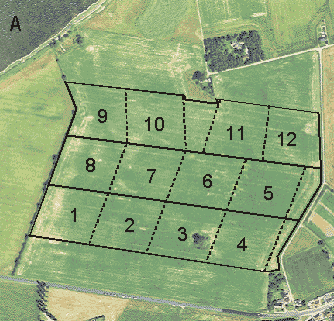
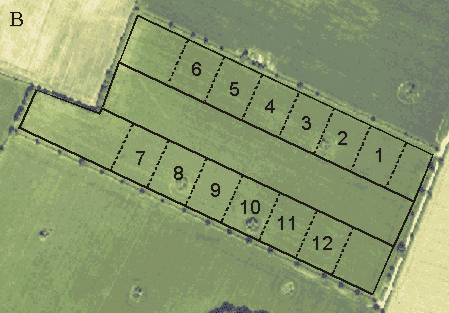
Fig. 4.2.
Two examples of the delimitation of subplots within plots. A: Four subplots
of 1.5 ha within each plot (Nøbøllegård). B: Six subplots of 1.0 ha within the normal-
and quarter-dosage plots (Gjorslev). Aerial photos by courtesy of Kampsax.
A total of 17 or 18 counts (each consisting of a morning count and an afternoon count) were performed at each field per year. In 1997, 17 counts per field were carried out between 6 May and 31 July. In 1998, the census period was 11 May to 5 August, and 17 counts per field were performed. Finally, in 1999 18 counts were performed between 6 May and 5 August. To avoid systematic biases from changes in the birds' activity during the day, the starting plot varied from count to count according to a rotating scheme.
4.2.1.2 Statistical analysis
The basic experimental unit was the plot, and the standard plot size was 6 ha. Consequently, for each bird species, field and year, the dependent variable was the number of individuals per 6 ha plot per count. The results of the morning and afternoon counts were analysed separately. For the morning counts, the number of individuals recorded in each subplot within a plot were summed up to yield a 6 ha plot total for each species. For the afternoon counts, the number of birds recorded within each plot was converted to the standard plot size of 6 ha by division. In order to improve approximation to a normal distribution, and make the variance independent of the mean, all standard plot totals were loge(x+1) transformed before further analysis.
The repeated censuses of a certain plot during the season are not statistically independent. Therefore, some kind of repeated-measures analysis is needed to test for differences between dosage plots (e.g., Stryhn 1996). Described graphically, a suitable method is as follows: The dependent variable is depicted as a function of the census date; for each species and type of count, this creates 135 curves (3 plots in 15 fields in 3 years). The 135 curves are then tested against each other for differences between dosages. This can be done by fitting a 16th or 17th degree polynomial (depending on the number of census dates) to each curve, whereupon the parameters (zero degree terms, 1st degree terms etc.) are tested against each other by means of analysis of variance. If a parameterization which yields orthogonal polynomials is used, the different parameters may be tested and (to some extent) interpreted independently of each other. In practice, the high-order coefficients are difficult to interpret, for which reason analyses of this kind are often limited to tests of zero, 1st and 2nd degree terms.
In the present case, the basic hypothesis is as follows: At the beginning of the breeding season, before any notable effects of pesticide sprayings occur, no systematic differences between dosage plots exist. As the season progresses, and the effects of the herbicide and insecticide sprayings manifest themselves, differences in the amounts of insects and other birds' food items develop between plots. Consequently, the quarter-dosage plots during the breeding season become relatively more attractive to the birds as feeding sites and the normal-dosage plots become relatively less attractive, with the half-dosage plots placed somewhere in between. This should be reflected in the seasonal development in the number of birds foraging in each of the three plots within a field.
The crucial check of this hypothesis is to test whether the first-order coefficient of the polynomial, i.e. the slope of the curve, is significantly greater in the quarter- (or half-) dosage plots than in the normal-dosage plots. Differences in mean number (the zero-order term) between plots may be a corollary of the differences in development, or they may reflect more permanent differences between plots. Because the relative dosage applied to a certain plot was the same in all three years, effects may have accumulated during the study. Accordingly, towards the end of the study period, dosage-related differences between plots might be present from the start of the breeding season.
To deal with this approach in practice, the mean and slope of the number-of-birds vs. date curve were calculated for each species, plot and year, using the REG procedure in SAS/STAT. The means and slopes were then analysed for differences between dosages by means of analysis of variance, taking into account the effect of differences between crops, years, farms and fields. It should be noticed that dosage was treated as a class variable, so no assumptions about the effect of half dosage falling in between those of quarter and normal dosage were made. The anova design applied is shown in Table 4.2; starting with the full model, stepwise model reduction was used. If a significant effect of dosage was revealed, least-squares means were calculated, and t-tests were used to test for pairwise differences. The analyses were performed using the GLM procedure in SAS/STAT.
Table 4.2.
The factors included in the anova of the occurrence of birds during the
breeding season, the nature of each factor (fixed/random), and the denominator (error
term) used in the test of significance of each factor in a balanced design (see text).
Source of variation |
Fixed / random |
Denominator in F test (if balanced) |
Dosage |
Fixed |
MS(Dosage´ Year) + MS(Dosage´ Farm) – MS(Residual) |
Crop |
Fixed |
MS(Crop´ Farm) |
Year |
Random |
MS(Dosage´ Year) |
Farm |
Random |
MS(Field(Farm)) + MS(Crop´ Farm) + MS(Dosage´ Farm) – MS(Dosage´ Crop´ Farm) – MS(Residual) |
Field (Farm) |
Random |
MS(Residual) |
Crop ´ Farm |
Random |
MS(Dosage´ Crop´ Farm) |
Dosage ´ Crop |
Fixed |
MS(Dosage´ Crop´ Farm) |
Dosage ´ Year |
Random |
MS(Residual) |
Dosage ´ Farm |
Random |
MS(Dosage´ Crop´ Farm) |
Dosage ´ Crop ´ Farm |
Random |
MS(Residual) |
Residual |
Random |
|
The error terms given in Table 4.2 are only fully valid in a balanced experimental design. In the present case, however, only the afternoon counts represent such a design. Because not all of the half-dosage plots were censused at the morning counts (cf. section 4.2.1.1), the experiment in this case is unbalanced and the F-tests must be modified, causing the tests to be only approximate. The modifications applied involve a weighting of the different terms in the denominator of the F-tests and an adjustment of the degrees of freedom, as called by the RANDOM/TEST statement in the GLM procedure in SAS/STAT (SAS Institute 1990).
While the test procedures thus were based on a model with just mean and slope - in order to make the interpretation of the tests as plain as possible - 2nd degree models were calculated for illustrative purposes and to provide more information about the seasonal development in bird numbers.
Two species and one species group were selected for analysis: Skylark, Whitethroat and small seed-eaters (sparrows, finches and buntings). These species were the only ones occurring in sufficient numbers in the fields to make a reliable analysis possible. As previously mentioned, morning and afternoon counts were analysed separately. Furthermore, the analyses of morning counts of Whitethroat and seed-eaters were performed on the total sample as well as on the smaller sample from the field proper. Thus, a total of eight different (but not mutually independent) series of curves were analysed. Table 4.3 summarizes the dependent variables selected and the size of the material.
Table 4.3.
The species selected for analysis and the census variables used. The number
of individuals recorded is given for each of the eight variables.
|
Morning counts |
Morning counts |
Afternoon counts |
Skylark |
– |
10,317 |
10,609 |
Whitethroat |
4,676 |
802 |
605 |
Small seed-eaters |
7,960 |
1,690 |
1,782 |
4.2.2 Autumn counts
4.2.2.1 Field methods
The autumn counts on harvested fields were basically carried out in the same way as the winter counts (section 4.1.2.1), but with a census effort corresponding to that of the afternoon counts during the breeding season. Thus, the sampling unit was the plot, all three plots were censused in all fields, and the census method was line transects. Before the transects were started, the observer scanned all three plots with a binocular, and any birds of shy species (geese, plovers etc.) that might be flushed when he moved into the field were counted. Then the observer walked through each plot following a set pattern, using a constant effort of 6 minutes per ha. All birds (except swallows/martins and swifts) that were seen or heard within or immediately above the plot, or in the adjacent vegetation, were recorded and assigned to one or more of the following four zones: hedge/habitat island, field 0-12 m (from hedge/habitat island); field > 12 m; air. Like on the other censuses, care was taken not to count any individual more than once, and if a bird was recorded in more than one plot, it was assigned to one of these by the observer. The starting plot varied from count to count according to a rotating scheme.
Only the ten cereal fields were censused. The counts were started as soon as possible after harvest, i.e. between 22 August and 8 September. Each field was censused once a week until it was ploughed, although with a maximum of 9 counts per field in 1998 and 7 counts in 1999. In 1998 the farmers were allowed to follow their normal routines and plough the fields as soon as they pleased; this led to great differences in counting periods and number of counts per field. Therefore, in 1999 the farmers were compensated for postponing the ploughing of the study fields until 7 counts had been performed. Unfortunately, one farm did not want to participate, so only 8 fields were censused in autumn 1999. A total of 64 and 56 counts were carried out in 1998 and 1999, respectively. The average number of counts per field, the period during which the counts were performed, and the median counting date are shown in Table 4.4.
Table 4.4.
Statistical information about the censuses on stubble fields in 1998 and
1999. For each combination of crop and year, the number of counts is shown (average and
range). Also, the period during which the censuses were performed is shown together with
the median counting date.
|
1998 |
1999 |
||||
|
No. of counts |
Period |
Median date |
No. of counts |
Period |
Median date |
Barley stubble |
4.2 (2-6) |
25.08 - 04.10 |
09.09 |
7 (7-7) |
26.08 - 06.10 |
15.09 |
Wheat stubble |
8.6 (8-9) |
22.08 - 06.11 |
26.09 |
7 (7-7) |
26.08 - 06.10 |
15.09 |
4.2.2.2 Statistical analysis
For each plot and census, the density of each species recorded was expressed as the number of birds per 6 ha, and the densities were loge(x+1) transformed before further analysis. Because the repeated censuses of each plot within a year are not strictly independent, the mean of the log-transformed densities (equivalent to the geometric mean) were used as the dependent variable in the analyses. Contrary to the situation in the breeding season, any dosage-related differences in food abundance between plots were expected to be manifest from the beginning of the census period, so tests of trends were not performed.
The geometric means of selected species were analysed for differences between dosages by means of analysis of variance. The experimental design is incomplete in this case. Basically, the whole experiment is a well balanced multiple Latin Square design: 3 crops, 3 fields, 3 years and 5 replicates (farms). The autumn counts, however, concern just a subset of the Latin Square: two crops and two years, but still 3 fields per farm (due to the rotation of crops). Therefore, the effects of crop, year and field cannot be estimated simultaneously; this led to a modification of the anova design (Table 4.5).
Table 4.5.
The factors included in the anova of the occurrence of birds on stubble
fields, the nature of each factor, and the denominator (error term) used in the test of
significance of each factor in a balanced design (see text).
Source of variation |
Fixed / Random |
Denominator in F test (if balanced) |
Dosage |
Fixed |
MS(Dosage´ Year) + MS(Dosage´ Farm) – MS(Residual) |
Crop |
Fixed |
MS(Crop´ Year) |
Year |
Random |
MS(Crop´ Year) + MS(Dosage´ Year) – MS(Dosage´ Crop´ Year) |
Farm |
Random |
MS(Crop´ Year´ Farm) + MS(Dosage´ Farm) – MS(Residual) |
Crop ´ Year |
Random |
MS(Crop´ Year´ Farm) + MS(Dosage´ Crop´ Year) – MS(Residual) |
Crop ´ Year ´ Farm |
Random |
MS(Residual) |
Dosage ´ Crop |
Fixed |
MS(Dosage´ Crop´ Year) |
Dosage ´ Year |
Random |
MS(Dosage´ Crop´ Year) |
Dosage ´ Farm |
Random |
MS(Residual) |
Dosage ´ Crop ´ Year |
Random |
MS(Residual) |
Residual |
Random |
|
In this anova, the interaction term crop´ year contains variation arising from differences in counting periods (cf. Table 4.4) as well as variation from year-dependent crop effects. The 2nd order interaction term crop´ year´ farm allows these effects to vary between farms, but includes as well some variation stemming from differences between fields.
As previously mentioned, there were 5 replicates in 1998 but just 4 in 1999, so the experimental design is unbalanced and the tests only approximate. The approximate F-tests were constructed in the same way as for the morning counts in the breeding season (section 4.2.1.2). Starting with the full model shown in Table 4.5, stepwise model reduction was used. All analyses were performed using the GLM procedure (with RANDOM/TEST statement) in SAS/STAT.
Two species and one species group occurred in numbers that were sufficient for analysis: Skylark (3,434 individuals recorded), Meadow Pipit (722) and small seed-eaters (3,415). Whereas Skylarks and Meadow Pipits chiefly occur on the fields, Yellowhammers and other small seed-eaters are also frequently recorded in the adjacent hedgerows and habitat islands. The analysis of the occurrence of these species was therefore carried out on the sample of birds from the field proper (1,861 individuals) as well as on the total sample.
4.3 Results
4.3.1 Breeding season counts
The results of the analyses of variance are summarized in Tables 4.6 - 4.8. It is clear from the tables that all main factors have significant effects on the distribution of all three species. The partitioning of the sums of squares (not shown) indicates that the quantitatively most important factors affecting the mean numbers of birds are farm and field (i.e. block factors), while crop plays a minor, but still important role. Crop, farm and field also account for the majority of the variation in slope (i.e. development in numbers), but farm and field are less dominant, and effects of dosage become apparent. So, while there are great differences between farms, and also between single fields, with respect to the mean number of birds present, the variation between blocks is less pronounced with respect to the changes in bird numbers that occur during the season, exposing the effects of the experimental factors crop and dosage. Variation between years, although often significant, never accounts for more that 10% of the total variation.
Table 4.6.
Schematic summary of the analyses of the occurrence of Skylarks on the
experimental fields during the breeding season. Statistical significance is indicated as
follows: *: 0.01<p<0.05, **: 0.001<p<0.01, ***: p<0.001.
|
Morning counts |
Afternoon counts |
||
|
Mean |
Slope |
Mean |
Slope |
Dosage |
|
|
|
* |
Crop |
*** |
** |
*** |
** |
Year |
** |
** |
|
|
Farm |
** |
|
** |
|
Field(Farm) |
*** |
|
*** |
|
Crop´ Farm |
|
* |
|
*** |
Dosage´ Crop |
|
|
|
|
Dosage´ Year |
|
|
|
|
Dosage´ Farm |
|
|
* |
|
Dosage´ Crop´ Farm |
|
|
|
|
Table 4.7.
Schematic summary of the analyses of the occurrence of Whitethroats on the
experimental fields during the breeding season. Statistical significance is indicated as
follows: *: 0.01<p<0.05, **: 0.001<p<0.01, ***: p<0.001.
|
Morning (all obs.) |
Morning (field) |
Afternoon |
|||
|
Mean |
Slope |
Mean |
Slope |
Mean |
Slope |
Dosage |
* |
** |
*** |
*** |
|
*** |
Crop |
|
|
|
*** |
|
** |
Year |
* |
|
*** |
** |
*** |
* |
Farm |
|
|
* |
|
|
|
Field(Farm) |
*** |
|
*** |
*** |
*** |
*** |
Crop´ Farm |
** |
|
*** |
|
* |
|
Dosage´ Crop |
|
|
|
|
|
|
Dosage´ Year |
|
|
|
|
|
|
Dosage´ Farm |
* |
|
|
|
* |
|
Dos.´ Crop´ Farm |
|
|
|
|
|
|
Table 4.8.
Schematic summary of the analyses of the occurrence of small seed-eaters on the
experimental fields during the breeding season. Statistical significance is indicated as
follows: *: 0.01<p<0.05, **: 0.001<p<0.01, ***: p<0.001.
|
Morning (all obs.) |
Morning (field) |
Afternoon |
|||
|
Mean |
Slope |
Mean |
Slope |
Mean |
Slope |
Dosage |
* |
* |
* |
** |
|
|
Crop |
|
* |
*** |
|
|
|
Year |
|
|
* |
** |
*** |
** |
Farm |
* |
|
** |
|
|
|
Field(Farm) |
*** |
*** |
*** |
* |
*** |
** |
Crop´ Farm |
* |
|
|
** |
*** |
*** |
Dosage´ Crop |
|
|
|
|
|
|
Dosage´ Year |
|
|
|
|
|
|
Dosage´ Farm |
|
|
|
|
** |
|
Dos.´ Crop´ Farm |
|
|
|
|
|
|
In all three species analysed, the occurrence differs between crops, although the effect of crop often varies between farms (as evidenced by a significant crop´ farm interaction). Concerning the effects of dosage, an important result is the lack of significant dosage´ crop interactions, implying that the effect of dosage can be analysed independently of any crop effects. In some cases the dosage´ farm interaction is significant (although not highly so), indicating that the effect of dosage varies between farms. Finally, the lack of any significant dosage´ year interaction indicates that the effect of dosage has been the same in all three study years.
In the Skylark, the pattern of occurrence is mainly determined by the crop, while the dosage effects are barely significant (Table 4.6, Fig. 4.3). The concordance between the models based on the morning and afternoon counts is good, considering that they use data from two independent series of counts, with different census methods. In the interpretation of the results, due attention should be paid to the fact that the number of birds recorded is a function of the number of birds present in the field and their activity. The number of Skylarks seems to peak in June, but numbers are surely still high in July when they are increased by the newly fledged young. However, the territorial activity is much higher in May and June than in July.
In the beginning of the season, before the germination of the spring crops, the highest Skylark densities occur in winter cereals. But when the growth of the spring cereals makes the barley fields attractive to Skylarks around 1 May, numbers increase here, reaching a culmination in June. In the beet fields, the number of Skylarks increases throughout the breeding season, and from mid-July onwards the highest densities are found in this crop.
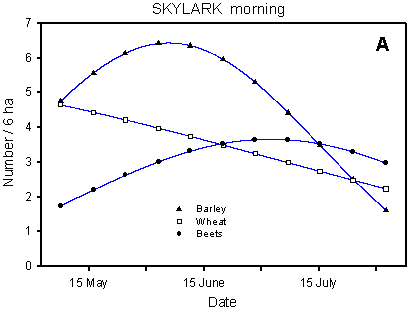
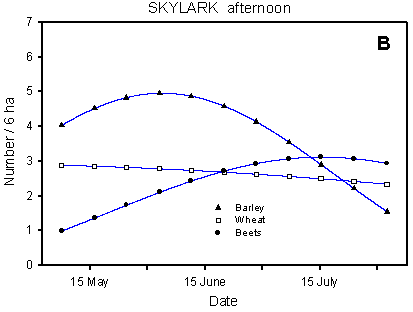
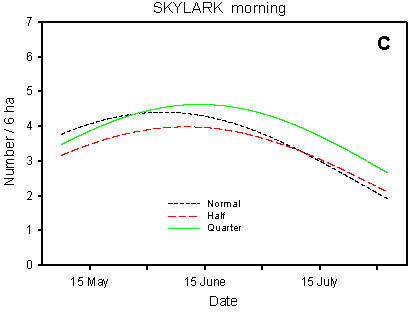
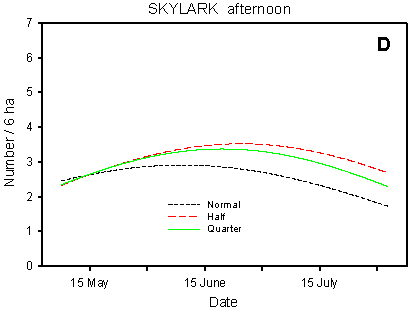
Fig. 4.3.
Models of the development in Skylark numbers on the experimental fields from
early May to early August in relation to crop (A, B) and dosage (C, D). A & C are
based on the morning counts, B & D on the afternoon counts. All models are based on
log-transformed data, so the densities indicated are not comparable with normal arithmetic
mean densities.
Compared with the crop effects, the effects of differences in dosage on the distribution of Skylarks are small (Fig. 4.3 C-D). On the afternoon counts, the between-dosages differences in development (slope) are significant (p = 0.021*); pairwise t-tests indicate a significant difference between half and normal dosage (p = 0.0061**), but not between quarter and normal (p = 0.085). On the morning counts, the dosage effects are not significant (p = 0.053), but the picture is the same as on the afternoon counts: the decrease in Skylark numbers begins earlier in the season in normal-dosage plots than in plots treated with half or quarter dosage. Actually, pairwise t-tests reveal a significantly "better" (i.e. less negative) development in quarter-dosage plots than in plots treated with normal dosage (p = 0.047*, Tukey-Kramer adjustment for multiple comparisons).
The first Whitethroats occur in the first week of May, and four weeks later almost all of the population has arrived from its African winter quarters. Territorial activity is high in the first half of June, and from around 20 June onwards the number of Whitethroats is increased by the first fledglings. During July, territorial activity decreases and the birds become less visible (Fig. 4.4 A).
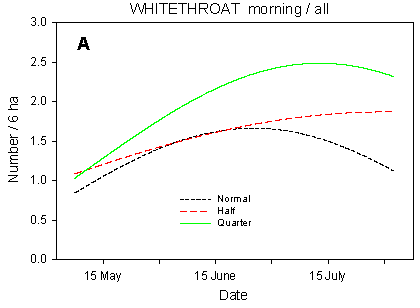
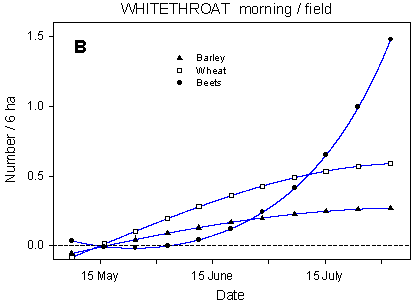
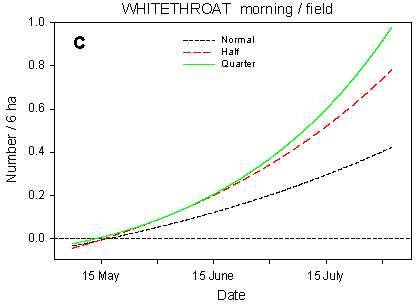
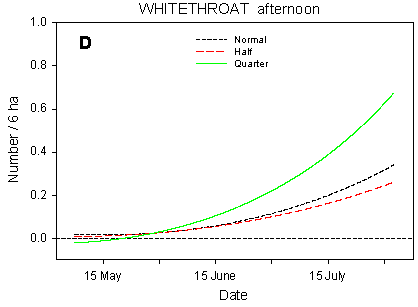
Fig. 4.4.
Models of the development in Whitethroat numbers on the experimental fields
from early May to early August in relation to dosage (A, C, D) and crop (B). A-C are based
on the morning counts, D on the afternoon counts. A concerns all records (including the
border vegetation), B-D only records inside the field. All models are based on
log-transformed data, so the densities indicated are not comparable with normal arithmetic
mean densities.
Although they frequently feed in the fields, Whitethroats need trees and bushes, or at least tall herbs, at the field borders for song-posts and nesting. Because the border vegetation varies strongly between the study fields, block factors farm and field account for the majority of the variation in Whitethroat numbers. Nonetheless, dosage effects are prominent, even when all records (including those in the border vegetation) are considered (Table 4.7). There are clearly significant differences in slope between dosages (p = 0.0021**); pairwise t-tests indicate that the overall increase in numbers during the season is significantly stronger in quarter-dosage plots than in normal-dosage plots (p = 0.0005***), with the development in half-dosage plots falling somewhere in between (Fig. 4.4 A).
About 17% of the morning records of Whitethroats are from the fields proper. The Whitethroats' use of the fields is crop-dependent, but generally the proportion of birds recorded in the fields increases during the season, accompanying the growth of the crops. Barley fields are used very little while wheat fields are more frequently used. The beet fields are initially not used at all, but become important feeding sites from around 10 July onwards (Fig. 4.4 B).
The dosage has a pronounced effect on the Whitethroats' distribution within the fields (Fig. 4.4 C-D). On the morning counts, the differences in development (slope) between dosages are highly significant (p = 0.0002***); pairwise t-tests indicate significant differences between quarter and normal dosage (p < 0.0001***) as well as between half and normal (p = 0.018*). The differences in mean numbers follow the same pattern. On the afternoon counts, the between-dosages differences in slope are also highly significant (p < 0.0001***), and pairwise t-tests indicate a highly significant difference between quarter and normal dosage (p = 0.0002***). However, the development in Whitethroat numbers in half-dosage plots is significantly different from that in quarter-dosage plots (p < 0.0001***) but does not differ from the development in plots treated with normal dosage. A probable reason for this difference between the morning and afternoon counts is that on the morning counts, only half-dosage plots surrounded by the same amount of hedgerows as the normal- and quarter-dosage plots were censused (cf. section 4.2.1.1), whereas all plots were censused on the afternoon counts, including those half-dosage plots that abut on a smaller amount of hedgerow than the normal- and quarter-dosage plots and thus are less likely to be visited by Whitethroats.
The small seed-eaters (sparrows, finches and buntings) nest in hedgerows, coverts and around farmsteads, whereas a major part of their foraging takes place in the fields. The number of individuals occurring in and along the fields rises steadily during the breeding season, partly because the population sizes are increased by fledglings, partly because the birds (especially sparrows) move from the farmstead surroundings to the fields when the young have fledged. Farm and field differences account for the majority of the variation in numbers because of great between-fields variation in border vegetation and distance to farm buildings.
Even when all records are considered, effects of dosage can be distinguished (Table 4.8, Fig. 4.5 A). There are significant differences between dosages in the development in seed-eater numbers during the breeding season (p = 0.020*); pairwise t-tests indicate slope differences between quarter and normal dosage (p = 0.037*) and between half and normal (p = 0.011*). There are similar differences in mean numbers although the difference between half and normal dosage is not significant (p = 0.096).
About 21% of the morning records of small seed-eaters concern birds inside the fields. The birds' use of the fields for feeding differs between crops (Fig. 4.5 B). In winter wheat there is a slow but steady increase in the number of birds during the season. The spring crops are used during a short period in May, but later on barley is the least preferred crop. Conversely, beets are used throughout the season, and beet fields are very important feeding sites from the beginning of July onwards.
Besides the crop effects, the distribution of small seed-eaters in the fields is affected by dosage effects. On the morning counts (Fig. 4.5 C), there are significant differences in seasonal development between dosages (p = 0.0081**); pairwise t-tests indicate significant slope differences between quarter and normal dosage (p = 0.013*) as well as between half and normal (p = 0.0069**). The differences in mean numbers follow the same pattern. On the afternoon counts, the differences in development (slope) between dosages are not significant (p = 0.17), and the effects of dosage on mean numbers vary between farms. However, the models for quarter, half and normal dosage (Fig. 4.5 D) follow a pattern which is quite similar to that seen on the morning counts.
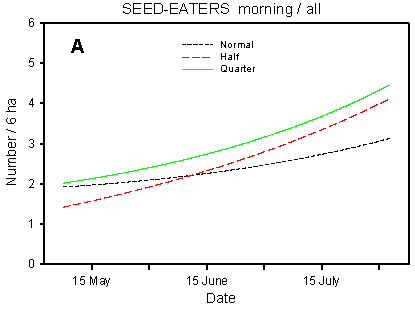
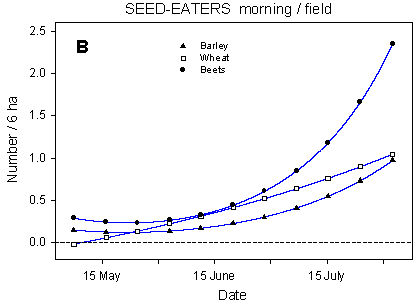
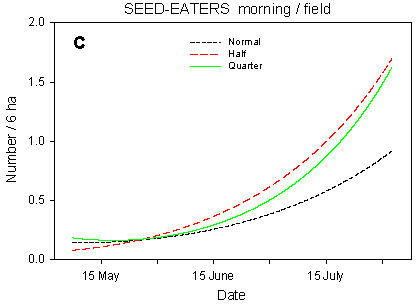
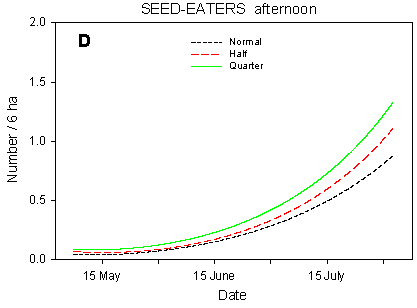
Fig. 4.5.
Models of the development in the numbers of small seed-eaters on the
experimental fields from early May to early August in relation to dosage (A, C, D) and
crop (B). A-C are based on the morning counts, D on the afternoon counts. A concerns all
records (including the border vegetation), B-D only records inside the field. All models
are based on log-transformed data, so the densities indicated are not comparable with
normal arithmetic mean densities.
4.3.2 Autumn counts
The results of the analyses of variance are summarized in Table 4.9. There are great differences between the analysed species and very few, if any, general conclusions can be drawn. The partitioning of the sums of squares (not shown) indicates that the dominating sources of variation are farm differences and/or the crop´ year´ farm interaction (which includes between-fields differences, cf. section 4.2.2.2). Effects of differences between years and between crops are less pronounced. No general effect of dosage is indicated, but in the Skylark and the seed-eaters, the dosage´ farm interaction accounts for 17% and 11%, respectively, of the total variation.
Table 4.9.
Schematic summary of the analyses of the occurrence of selected bird species
on the experimental fields in autumn. Statistical significance is indicated as follows: *:
0.01<p<0.05, **: 0.001<p<0.01, ***: p<0.001.
|
Skylark
|
Meadow Pipit
|
Small seed-eaters |
|
All obs. |
Field only |
|||
Dosage |
|
|
|
|
Crop |
|
|
* |
|
Year |
|
|
** |
* |
Farm |
* |
|
*** |
*** |
Crop ´ Year |
|
|
|
|
Crop ´ Year ´ Farm |
** |
*** |
|
|
Dosage ´ Crop |
|
|
|
|
Dosage ´ Year |
|
|
|
|
Dosage ´ Farm |
** |
|
|
|
Dosage ´ Crop ´ Year |
|
|
|
|
In the Skylark, the major sources of variation are farm and field differences. There is a clearly significant dosage´ farm interaction, indicating that some differences between dosages exist, but vary between farms. Testing each farm separately reveals significant (or almost significant) dosage effects in two farms only: Gjorslev (p = 0.0056**) and Nøbøllegård (p = 0.058). At Gjorslev, Skylark numbers are clearly higher in half-dosage plots than in normal- and quarter-dosage plots (pairwise t-tests: p = 0.0048** and 0.0031**, respectively). At Nøbøllegård, numbers tend to be lower in half-dosage plots than in normal- and quarter-dosage plots (p = 0.056 and 0.028*, respectively) (Fig. 4.6).
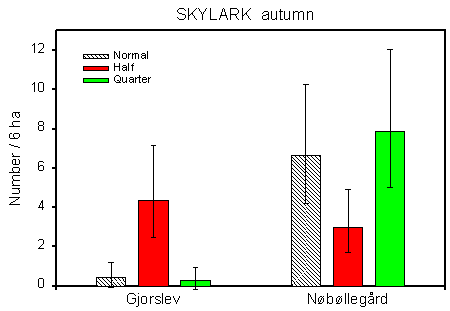
Fig. 4.6.
The occurrence of Skylarks on the experimental stubble fields at Gjorslev and
Nøbøllegård in autumn. The geometric mean numbers (+/– 2*standard error) are shown
for plots sprayed with normal, half and quarter dosage.
In both cases, the differences in Skylark numbers are probably due to structural differences, rather than to differences in pesticide use. At Gjorslev, all fields are surrounded by hedges, making the outer plots (always normal and quarter dosage) less attractive to Skylarks than the central (half dosage) plots (cf. section 4.1.1). At Nøbøllegård the reverse is true: the field that was censused in both years (and thus contributed 50% of the data) is bordered by a hedgerow along the half-dosage plot, making the quarter- and normal-dosage plots the most attractive to Skylarks.
In the Meadow Pipit, the crop´ year´ farm interaction is the dominant source of variation. In addition, the factors farm and crop´ year each account for 15-20% of the total variation. There are no indications of dosage effects. The Meadow Pipits occurring on the stubble fields are almost exclusively resting migrants, with numbers peaking from late September to mid-October. In 1998, when the number and timing of the counts varied between fields (Table 4.4), the censuses on almost all of the barley fields stopped before the peak of the migration, whereas the censuses on wheat fields continued until late October and thus included the main migration period. This is probably the main reason for the dominance of the crop´ year and crop´ year´ farm interactions.
The occurrence of small seed-eaters, contrary to the other species, is to a large extent dependent on the existence of hedgerows or other suitable vegetation along the field borders. The farms and fields vary in this respect, which is probably the reason why farm differences is the dominant source of variation in the numbers of small seed-eaters. There are significant differences between years; for unknown reasons more birds were recorded in 1999 than in 1998 (no such difference was apparent during the breeding season). A significant difference between crops is evident when all records are included, but disappears when only records from the field are considered and is therefore of little interest. There are no significant dosage effects.
4.4 Discussion
The bird species analysed represent different phenologies and strategies in their exploitation of the farmland environment and may thus be considered representative for the bird community associated with arable fields. The Skylark is the only species occurring in large numbers that both breeds and forages in agricultural fields, where it is dominant and numerous from March until November. During the breeding season, its diet mainly consists of arthropods, but in autumn cereal grains and other seeds become important, and in winter and spring green plant material is frequently eaten as well (Christensen et al. 1996). Probably as part of their anti-predator strategy, Skylarks avoid areas close to hedgerows and other vertical structures (cf. Petersen 1996, Chamberlain & Gregory 1999).
Contrary to the Skylark, the small seed-eaters (Yellowhammer, Linnet, Chaffinch, Greenfinch, Tree Sparrow etc.) take advantage of the existence of suitable vegetation bordering the fields, or habitat islands within the fields, for cover and breeding. However, most of their foraging takes place inside the fields. The species occur in Danish farmland year round, often forming flocks outside the breeding season. Over the year, plant seeds (including cereal grains) make up the bulk of their diet, but during the breeding season, insects are an important part of the diet in most species.
Whitethroats are strongly associated with hedgerows and tall herbaceous vegetation along the field borders but make frequent foraging trips into the fields. Being tropical migrants, they arrive in Danish farmland in May and leave in August-September. Whitethroats are chiefly insectivorous, but fruits and berries are of some importance in late summer and autumn.
Like the Whitethroat, the Meadow Pipit is mainly insectivorous, but in early autumn seeds may constitute 15% of the diet and even more later in the year (Cramp & Simmons 1977-94). The species breeds on permanent grassland and is rarely found on arable fields during the breeding season, but during autumn and spring migration (September-October and April) large numbers rest on suitable fields. Meadow Pipits show neither preference nor avoidance of hedgerows.
Put together, the selected species utilize a broad spectrum of the animal and vegetable resources available all over the fields. The major limitations follow from their relatively small size (max. Skylark 40 g) and the fact that none of the species use their bills to probe the soil (like Starling). No larger species occurred in numbers allowing reliable statistical analyses of their distribution.
Optimal use of the available resources by the birds involves changes of crop preferences during the breeding season. The Skylark's shift in preferences is visualized in Fig. 4.3. Skylarks seemingly prefer not too dense crops of 15-45 cm height, which is probably the reason for their gradual shift from winter cereals to spring cereals in May and general leaving of the cereal fields during July (cf. Schläpfer 1988, Jenny 1990b, Wilson et al. 1997, Chamberlain et al. 1999, Toepfer & Stubbe 2001). In dense crops Skylarks often concentrate their foraging activities around tramlines and other unsown areas where locomotion is unhindered and prey items are more easily seen (Odderskær et al. 1997b). Row crops like beets, by contrast, allow the birds to walk about unrestricted all over the field, and beet fields become useful for Skylarks when the crop biomass (and hence the structural diversity) starts to increase rapidly from mid-June onwards.
The numbers of Whitethroats and seed-eaters (and several other bird species breeding in the border vegetation) that occur in the fields generally increase as the season progresses, accompanying the growth of the crops. This is especially pronounced in beet fields where the number of birds rises tremendously during July (Figs. 4.4 B & 4.5 B). A strong increase in Yellowhammers' utilization of beet fields after 10 July was also found by Biber (1993). Beet fields offer good cover and easy access and also hold good numbers of preferred birds' food items from mid-July onwards (Fig. 3.4). In cereal fields there is a slow but steady increase in the number of foraging birds of these species throughout the breeding season, most pronounced in wheat; two British studies show a quite similar picture for both Yellowhammer (Stoate et al. 1998) and Whitethroat (Cracknell 1986). Yellowhammers and other small seed-eaters also show some preference for spring crops during a short period after sowing, when the loose soil and low vegetation suit their feeding behaviour.
Contrary to the situation in the breeding season, no crop preferences were found on the autumn counts. None of the analysed bird species show any signs of preferring wheat stubble to barley stubble or vice versa. In Britain, Donald et al. (2001) found that wintering Skylarks preferred barley stubbles to wheat stubbles. Generally, stubble fields are preferred habitats during autumn and winter, compared to fields with autumn-sown crops, grass ley or bare till (Petersen & Nøhr 1992, Wilson et al. 1996, Robinson & Sutherland 1999, Donald et al. 2001).
Despite clear differences in the birds' use of the crops during the breeding season, the effects of dosage do not in any case interact significantly with the effects of crop. In other words, the effect of dosage on the occurrence of the analysed bird species is principally the same in all three crops studied.
In some cases, the dosage´ farm interaction term is significant, indicating that the effect of dosage varies between farms. However, a significant interaction is almost exclusively found on the afternoon counts, where all plots were censused, including those half-dosage plots that are not fully comparable with the normal- and quarter-dosage plots (cf. section 4.2.1.1). Therefore, a significant dosage´ farm interaction is probably chiefly due to the lack of true comparability of plots, rather than to real between-farms differences in the effects of dosage. The implications of the lack of full comparability of plots for the estimations of dosage effects are further discussed in section 4.4.1.
As explained in section 4.2.1.2, the basic hypothesis is that no systematic differences between dosage plots exist at the beginning of the breeding season, but that differences develop as the season progresses and the effects of the pesticide sprayings come to the fore. If dosage effects accumulate over the years, differences between dosage plots might exist from the outset in years 2 or 3. This would show in the analyses as a significant dosage´ year interaction term, as would also be the case if the effect of dosage varies between years. In all analyses, however, the dosage´ year interaction is far from significant, indicating that there have been no between-years differences in the effect of dosage and no traceable accumulation of effects over the three year study period.
Clear dosage-related differences are found in the breeding season counts of Whitethroats and small seed-eaters; the most pronounced differences occur in the former. In all tests, the number of Whitethroats increases significantly more rapidly in quarter-dosage plots than in normal-dosage plots. Similar significant differences are found in the morning counts of small seed-eaters, while the afternoon counts follow the same pattern without the differences being significant.
It is probably safe to conclude that the development in the numbers of Whitethroats and small seed-eaters occurring in the fields from May to August is in full accordance with the basic hypothesis: towards the end of the season, the birds clearly prefer plots treated with quarter dosage to plots treated with normal dosage of herbicides and insecticides. All these species make foraging trips into the fields from the surrounding vegetation, but do not establish territories inside the fields. Consequently, each individual is free to choose an optimal foraging site within a certain field.
In the Skylark, the differences between dosages are much less clear than in the species discussed above. However, numbers seem to decline earlier in the season in normal-dosage plots than in half- and quarter-dosage plots, both on the morning and on the afternoon counts (Fig. 4.3 C-D). On the morning counts, there is a significant difference in development between quarter- and normal-dosage plots, whereas on the afternoon counts it is the difference between half- and normal-dosage plots that is significant at the 5% level.
Although slight, the shift from plots treated with normal dosage to half- and quarter-dosage plots is in accordance with the basic hypothesis. The shift may reflect that, as the season progresses, the birds prefer to forage in plots with reduced dosages. Another explanation may be that fewer pairs carry through a second breeding attempt in normal-dosage plots than in half- and quarter-dosage plots (cf. Odderskær et al. 1997a).
The Skylarks perform almost all of their feeding inside the fields. So, on the face of it, it may be surprising that the most numerous and specialised field species among those studied is the one that shows the weakest response to differences in pesticide treatments. One obvious explanation may be that the graded dosages do not lead to appreciable changes in the distribution of the Skylarks' food resources (but see chapter 3). Another reason may be that vegetation structure (which may or may not be dosage-related), rather than food abundance, is the most important distributing factor (Odderskær et al. 1997b, Chamberlain et al. 1999). Also, the territorial system of Skylarks may seriously restrain the individual birds' choice of feeding sites within a field, so that only a limited response to changes in the availability of food is possible during the breeding season. Finally, the methodological uncertainties are notable: the number of Skylarks within a plot is rather difficult to establish accurately, due to their numerousness and their habit of flying around above the field, chasing each other.
Territoriality is not assumed to affect the distribution of Skylarks on the stubble fields in autumn. However, the autumn counts did not reveal any differences in the distribution of Skylarks on the experimental fields that may be ascribed to differences in pesticide treatments. Likewise, no dosage-related differences in abundance were found in Meadow Pipits or small seed-eaters. There are two possible explanations: (1) The incomplete, unbalanced design does not allow sufficiently accurate estimations and powerful tests. (2) The differences in pesticide dosage do not result in differences in the amount of birds' food items on the stubble fields that significantly affect the distribution of birds (cf. section 2.3).
4.4.1 How many more birds at reduced dosages?
From an administrative, as well as from a scientific point of view, this is an essential question. However, it is impossible to give a definite answer to it, among others because no measurements of breeding population densities or production of fledglings were made in this study. Even if this had been the case, though, it would not have been possible to assess the effect on the following year's population size, because this depends on the post-fledging survival, return rate, density-dependent population regulation etc.
A simple answer to the question may be given by simply comparing the mean numbers occurring in the plots over the whole breeding season. However, because it was shown that the differences between dosages do not exist from the outset, but develop during the season, it may be more appropriate just to use data from the second half of the census period, i.e. from 21 June onwards. Such a reduced data set was used to calculate the estimates in Table 4.10.
Table 4.10.
Least-squares estimates of the increase in bird densities on the experimental
fields achieved by reducing the amounts of insecticides and herbicides to one-quarter or
one-half of normal dosage. Point estimates and 95% confidence intervals are given. Only
data from counts performed between 21 June and 5 August (incl.) were used in the
calculations.
Species |
Dosage comparison |
Morning
counts |
Afternoon |
Morning & afternoon counts averaged |
Skylark |
Quarter vs. normal |
+22.7% [0%; +49%] |
+24.1% [+1%; +51%] |
+23.3% [0%; +50%] |
Half vs. normal |
+1.6% [–23%; +32%] |
+38.2% [+13%; +68%] |
+18.2% [–7%; +48%] |
|
Whitethroat |
Quarter vs. normal |
+104.1% [+56%; 157%] |
+99.8% [+42%; 163%] |
+101.7% [+50%; 158%] |
Half vs. normal |
+77.0% [+19%; 142%] |
16.6% [–65%; +36%] |
+35.4% [–18%; +94%] |
|
Small seed-eaters |
Quarter vs. normal |
+50.7% [+13%; +93%] |
+48.1% [–10%; 118%] |
+49.4% [+2%; +105%] |
Half vs. normal |
+68.4% [+18%; 127%] |
+18.3% [–35%; +82%] |
+43.5% [–8%; +105%] |
The choice of cutoff date is quite arbitrary; other dates might equally well have been chosen and would have resulted in a different set of estimates. The effect of changes in cutoff date may be judged from Figs. 4.3 - 4.5.
The figures presented in Table 4.10 should not be misinterpreted. They are estimates of differences in (or rather, ratios between) the number of birds occurring in different dosage plots, i.e. they show to which extent birds of different species prefer to stay (and probably feed) in plots with reduced dosages of pesticides compared to plots with normal dosage. They are not estimates of differences in population size.
It appears from a consideration of the 95% confidence limits that the increases in bird densities are estimated with a sizable degree of uncertainty. This is an inherent problem in the estimation of differences and ratios (because the variance of a difference between two variables is the sum of the two variances), but the interval widths also reflect the great variation among the farms and fields included in the study.
As to the quarter vs. normal dosage comparison, there is nonetheless a remarkable concordance between the estimates based on the morning counts and those based on the afternoon counts. In other words, the point estimates may in this case not be as unreliable estimators of the true values as might be expected from a consideration of the confidence intervals. A quick conclusion goes that a 75% reduction of the dosages of herbicides and insecticides results in a 20-25% increase in the number of Skylarks, a 50% increase in the numbers of small seed-eaters and a doubling of the number of Whitethroats visiting the field.
The effect of a halving of pesticide dosages is more difficult to evaluate. This is largely a result of the experimental design, as it was decided to give priority to a comparison of quarter and normal dosage at the expense of half dosage in those cases where it was impossible to lay out more than two fully comparable plots within a field (cf. section 1.2.5). This was the case in 7 of the 15 experimental fields. Only truly comparable plots were censused on the morning counts (cf. section 4.2.1.1), so these counts should give the more reliable estimates. However, because just 8 half-dosage plots were censused at the morning counts (as opposed to 15 plots with quarter dosage), the half vs. normal comparison is subject to greater uncertainty than the quarter vs. normal comparison.
On the afternoon counts all plots were censused, so the sample sizes used for the half vs. normal and quarter vs. normal comparisons are identical. However, even if only birds occurring in the field proper were recorded, the results are biased due to the lack of full comparability between plots. In the vast majority of "incomparable" cases, the normal- and quarter-dosage plots were bordered by hedgerows but the half-dosage plot was not (Fig. 4.2 B), implying that the half-dosage plot was more favourable for Skylarks but less favourable for small seed-eaters and (especially) for Whitethroats than the two other plots (cf. Table 4.1). Consequently, the afternoon counts overestimates the positive effect of a halving of the pesticide dosages on Skylark numbers but underestimates the gain for Whitethroats and (to a lesser extent) for small seed-eaters.
Despite these uncertainties, and even if the averaged confidence intervals for the half vs. normal comparisons in Table 4.10 in all cases include zero, it must be emphasized that a significant, positive effect of a 50% reduction of herbicide and insecticide dosages has been established for all three species (groups) (cf. section 4.3.1). The true value of the gain in numbers is probably closer to the point estimates derived from the morning counts than to those from the afternoon counts.