| Front page | | Contents | | Previous | | Next |
Systems Analysis of Organic Waste Management in Denmark
3 General conditions for the study
3.1 System boundaries
3.2 General assumptions
3.3 Mono-treatment scenarios
3.3.1 Mono-treatment scenario 1: Incineration
3.3.2 Mono-treatment scenario 2: Anaerobic digestion
3.3.3 Mono-treatment scenario 3: composting
3.4 Multi-treatment scenarios
3.5 Sensitivity analysis
3.1 System boundaries
The systems analysis consists of two sets of scenarios and a number of sensitivity analyses. The first set of simulation is five treatment scenarios corresponding to different future waste management option where several treatment technologies are combined. These scenarios were identified and set up by the Danish EPA. The second set of scenarios concerns different waste treatment technologies. Waste is treated either by incineration, central composting or anaerobic digestion. In all scenarios and in the sensitivity analyses, system boundaries for the waste management system are the same. This means that all results for the core system and up- and downstream system are comparable with each other. There are a number of limitations to the scenarios:
- Limitations in time: ORWARE calculates the impacts caused by handling and treatment of the amount of waste generated during one year. All emissions occur during this year except for emissions from the landfill and arable land, see Appendix B.
- Geographical limitations: Only waste generated in the selected and defined area (Denmark) is included, whereas emissions and use of resources is included wherever they occur and are allocated back to where the waste is generated.
- Limitations in function: This involves allocation between core system, up- and down-stream systems and compensatory system. Processes in the compensatory system are, when possible, calculated from a LCA perspective, from cradle to grave (ISO 14040:1977). Thereby extraction, processing, transportation and production of raw materials are included, see Appendix D for each process used in the systems analysis.
- Limitation of materials treated: In reality different materials are treated together with the organic household waste, for example large amounts of manure are digested together with the waste.
- Energy utilisation is expressed as use of primary energy carriers, the amount of energy raw materials as trees in the forest, oil and coal in deposit etc. that is needed to extract in order to generate the right amount of energy in the process.
- Use of chemicals in processes for waste treatment is calculated, but not in a true LCA perspective, cradle to grave.
3.2 General assumptions
All specific assumptions for the different submodels are described in Appendix D. Some of the most vital assumptions are however described here.
- The organic waste has a dry matter content of 30 %.
- Collection of waste is based on two general assumptions: the energy fuel consumption is 0.3 GJ/ ton waste and the energy content in diesel oil is 35.6 MJ per l diesel.
- 40 % of the waste to anaerobic digestion is transported 80 km by truck and trailer and 60 % is transported 20 km by truck
- 50 % of the waste to anaerobic digestion is digested in a mesophilic process, 50 % in a thermophile process. Biogas production is set to 125 nm3 per ton of waste treated. Of the incoming waste 35 % is sorted out to incineration.
- The waste to composting is transported 20 km by truck
- 50 % of the waste to composting is put into windrow compost and 50 % into reactor compost. In both composts the carbon-nitrogen ratio has been set to 30, corresponding to an input of carbon-rich material. Differences between the two compost techniques are that the reactor compost uses more electricity and diesel for compost maintenance than the windrow compost. The reactor compost also clean exhaust gases from composting through a combined wet scrubber and compost filter that reduces losses of NH3, N2O and CH4. Of the incoming waste, 15 % is sorted out to incineration.
- The incineration plant is a CHP plant with 85 % overall efficiency and 0.35 MJ electricity/ MJ heat. No flue gas condensation. The NOx-emission is 200 mg
NO2/ MJ fuel.
- Collected biogas is combusted in a gas engine with 90 % degree of efficiency where 38 % of the energy is recovered as electricity and 52 % as district heating.
- Dry spreaders are used when spreading compost. Compost is spread in the spring and harrowed into soil within one hour after spreading. Compost spreading leads to volatilisation of ammonia (NH3) that equals 15 % of ammonium (NH4) content in compost. Liquid spreader is used when spreading of anaerobic sludge. Anaerobic sludge is spread in the spring using a band spreader and harrowed into soil within one hour after spreading. Loss of NH3 is
5 % of NH4-content in anaerobic sludge
- Incineration residues, slag, are recycled to 80 % and 20 % of the slag amount are put on landfill. The recycling is made outside the system and is not accounted for. All ashes are landfilled separately.
- Compensatory heat is produced from coal with 88 % degree of efficiency
- Compensatory power is produced from coal with 44 % degree of efficiency
- Compensatory fertiliser is calculated for western European average data for production of mineral fertiliser nitrogen, phosphorus and potassium.
3.3 Mono-treatment scenarios
These scenarios are set up in order to compare specific emissions from three different treatment technologies. All organic waste is directed to one type of treatment; incineration, composting or anaerobic digestion. In each scenario, emissions are expressed for the different stages: collection, transport, treatment and downstream processes (gas utilisation and spreading of organic fertiliser). These scenarios do only cover the core system; compensatory production is not accounted for.
3.3.1 Mono-treatment scenario 1: Incineration
All organic household waste is collected and incinerated (Figure 2). All of the ashes from incineration are landfilled. Slag is recycled in an extent of 80 %, therefore only 20 % of the generated slag is landfilled. Emissions from recycling of slag are not accounted for. Energy recovered from incineration is utilised as electricity.
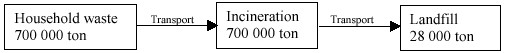
Figure2.
Conceptual model for mono-treatment scenario 1: Incineration of all waste.
3.3.2 Mono-treatment scenario 2: Anaerobic digestion
All organic household waste is collected and transported to incineration plant. At the incineration plant, the waste is reloaded and transported to anaerobic treatment (50 % mesophile and 50 % termophile digestion), except for 35 %, that is sorted out during bag and metal separation. Anaerobic sludge is transported to arable land and spread as an organic fertiliser. Waste sorted out is incinerated. All ash is landfilled and 80 % of the slag is recycled and 20 % is landfilled. Energy generated during incineration is utilised as electricity. Biogas from anaerobic digestion is combusted in a stationary gas engine. Recovered energy is utilised as electricity and heat.
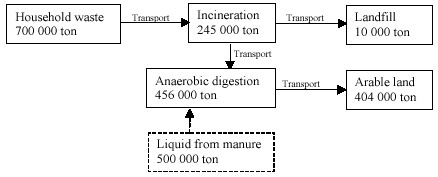
Figure 3.
Conceptual model for mono-treatment scenario 2: Anaerobic digestion of all waste.
3.3.3 Mono-treatment scenario 3: composting
All organic household waste is collected and transported to incineration plant. At incineration plant the waste is reloaded and transported to composting (50 % windrow and 50 % reactor), except for 15 %, which is sorted out during bag and metal separation. Compost is transported to arable land and spread as an organic fertiliser. Waste sorted out is incinerated. All ash is landfilled and 80 % of the slag is recycled and 20 % is landfilled. Energy generated during incineration is utilised as electricity.
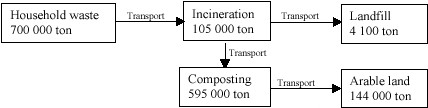
Figure 4.
Conceptual model for mono-treatment scenario 1: Composting of all waste.
3.4 Multi-treatment scenarios
Five scenarios that reflect the implementation of different treatment technologies available for treatment of organic household waste are simulated. The scenarios describe increased composting and anaerobic digestion in favour of incineration.
This is made in a short-term timeframe and a long-term timeframe based on utilisation of organic household waste at a national level.
Table 2.
Different treatment methods and amounts treated per year for the five scenarios. Direct waste flows and within parenthesis total waste flows (tons).
|
Treatment
|
Scenario 1 Reference
|
Scenario 2
2004
Anaerobic
digestion
|
Scenario 3
”Long term”
Anaerobic digestion
|
Scenario 4 2004
Composting
|
Scenario 5 2004 Composting
|
| Incineration |
654 000 |
570 000 |
370 000 |
570 000 |
370 000 |
| |
(663 700) |
(609 500) |
(479 500) |
(595 500) |
(425 500) |
| Anaerobic |
14 000 |
100 000 |
300 000 |
30 000 |
30 000 |
| digestion |
(9 100) |
(65 000) |
(195 000) |
(19 500) |
(19 500) |
| Central |
32 000 |
30 000 |
30 000 |
100 000 |
300 000 |
| Composting |
(27 200) |
(25 500) |
(25 500) |
(85 000) |
(255 000) |
| Sum |
700 000 |
700 000 |
700 000 |
700 000 |
700 000 |
| Landfilling1 |
26 000 |
24 000 |
19 000 |
23 500 |
16 800 |
| Road constr. |
44 000 |
41 000 |
33 000 |
40 000 |
29 000 |
1Landfilling of incineration residues
Numbers within parentheses are higher for incineration and lower for anaerobic digestion and composting. This is explained by that organic waste directed to anaerobic digestion or composting is pre-sorted and the residues are incinerated.
The reference scenario represents waste treatment of today in Denmark. The system is based on incineration of waste with small amounts of composting and anaerobic digestion (Table ). The scenario is used as reference in order to show differences in emissions, environmental impact and turnover of energy when the waste flows are redirected to increased biological treatment.
3.5 Sensitivity analysis
- The incineration slag is supposed to be recycled into road construction to 80 % but what are the changes if there is no recycling?
- Organic waste can be source-separated by using either paper bags or plastic bags. The choice will affect the amount of waste rejected from anaerobic digestion plant in the pre-treatment. Paper bags result in smaller losses than plastic bags. This is studied in a sensitivity analysis.
- The biogas processes are supposed to become better and better as the technology mature. A sensitivity analysis with a higher biogas production is also carried out.
- Arable land can be used as a carbon sink in order to decrease CO2-emissions. The impact of this is studied separately in a sensitivity analysis
- Today new power generation makes it possible to avoid power generation from coal condense power stations. In the future prognoses point at natural gas to be the marginal power production.
- The alternative fuel in district heating is assumed coal but it could also be claimed that the heat from coal is replaced by heat from natural gas. This is changed in the last sensitivity analysis.
| Front page | | Contents | | Previous | | Next | | Top |
|