Systems Analysis of Organic Waste Management in Denmark4 Results4.1 Environmental impact and resource utilisation from multi-treatment scenarios4.1.1 Amount of functions generated from multi-treatment scenarios 4.1.2 Environmental impact from multi-treatment scenarios 4.2 Environmental impact and resource utilisation from mono-treatment scenarios 4.2.1 Amount of functions generated from multi-treatment scenarios 4.2.2 Environmental impact from mono-treatment scenarios 4.3 Sensitivity analysis 4.3.1 No recycling of slag from incineration 4.3.2 Paper bags instead of plastic bags 4.3.3 Higher biogas production 4.3.4 Carbon sink 4.3.5 Power generation from natural gas instead of coal 4.3.6 Heat generation from natural gas instead of coal The results are showing environmental impact and use of resources as normalised values. For the multi-scenarios, all impact categories from the reference scenario are given the value 1. The other scenarios reflect the difference between the reference scenario and the other scenarios. The results show the total impact from core, up-/ downstream and compensatory system. The results from the simulation of mono-scenarios are shown as emission tables in Appendix B. The tables B26-B28 contain emissions to air and water from processes and heavy metals to soil. The Danish EPA primarily uses the mono-scenarios. Results from sensitivity analysis only show the differences that occur due to changes in the analysis between the scenarios. Detailed emissions and environmental impact are shown in Appendices A, B and C. 4.1 Environmental impact and resource utilisation from multi-treatment scenariosEnvironmental impact is calculated by multiplying emissions with different weighting factors (Appendix F). The weighting factors each describe a certain environmental impact categories e.g. global warming potential (GWP), Acidification potential (AP), eutrophication potential (EP) and photochemical oxidants from NOx and VOC. The resources used are collected into primary energy carriers and non-renewable primary energy carrier. A primary energy carrier is for example coal and oil. 4.1.1 Amount of functions generated from multi-treatment scenariosDepending of which process or mixture of processes that is used to treat the organic household waste, different amount of functions is supplied from each scenario. In this project following functions are identified:
The amount of functions from each scenario is listed in. Maximum amount of P and K is generated in scenario 5. Maximum amount of N is generated in the scenario 3, electricity in scenario 3 and heat in scenario 1. Table 3.
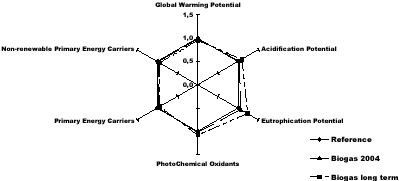
The scenario that supplies the largest amount of a function defines the systems need of the function. The other scenarios have to supply the difference between maximum and actual generation from external sources e.g. the compensatory system (Table ). Nutrients as nitrogen, phosphorus and potassium are supplied from mineral fertilisers, need of heat and electricity assumes to be produced from coal powered plants. 4.1.2 Environmental impact from multi-treatment scenarios Figure 5. All emissions and use of resources increases when anaerobic digestion is increased on behalf of incineration. Emissions of primarily NOx have a large contribution to acidification, eutrophication and photochemical oxidants.
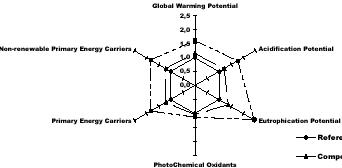
Figure 6. All emissions and use of resources increases when a larger part of is composted instead of incinerated. 4.2 Environmental impact and resource utilisation from mono-treatment scenariosEnvironmental impact from emissions in core system and up- and downstream system is calculated in then same way for mono-treatment scenarios as for multi-treatment scenarios. Identified utilities are for monotreatment scenarios only quantified, no compensatory production is included. 4.2.1 Amount of functions generated from multi-treatment scenariosBy treating all waste in one process, the potential yield of utilities can be determined. Table 4.
Incineration of waste yields the highest amounts of heat, although the differences between incineration and anaerobic digestion are approximately 20 %. Anaerobic digestion generates more electricity compared to incineration. No energy is recovered from composting. Both anaerobic digestion and composting generates nutrients that can be utilised as organic fertiliser. Anaerobic digestion is more effective in recycling N and composting recycles more P and K. The amount of nutrients is partly dependent on the efficiency of pre-treatment especially for P and K. 4.2.2 Environmental impact from mono-treatment scenarios
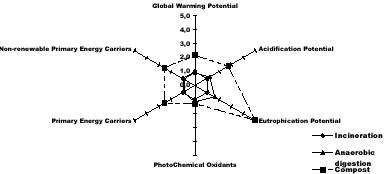
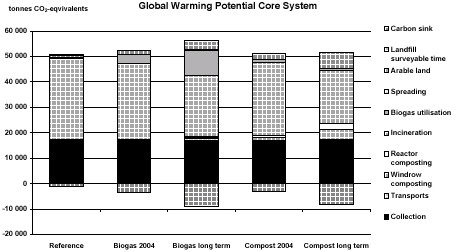
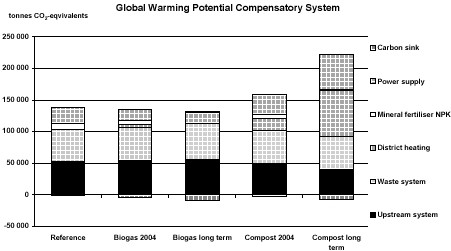
Figure 7. Incineration has the smallest impact on the environment and utilisation of resources followed by anaerobic digestion and composting. With the exception of photochemical oxidants all impacts categories is largest for composting compared with anaerobic digestion. 4.3 Sensitivity analysis4.3.1 No recycling of slag from incinerationIn this analysis, the recycling of incineration slag with 80 % was set to zero and all slag was disposed of at the slag landfill. There were no differences compared to the original system as the emissions from the slag landfill are small and few and do not affect the impact categories studied here. 4.3.2 Paper bags instead of plastic bagsA change from plastic bags to paper bags for the organic household fraction would mean lower reject streams from the pre-treatment could be achieved. Reject to incineration before anaerobic digestion was therefore set to 10 % instead of the original 35 %. The corresponding figures for compost were 5 % instead of 15 %. All Functional units increase in magnitude, except for district heating which remains the same as in the original scenarios. More waste sent to anaerobic digestion results in higher electrical power generated and more nitrogen to soil while more composting results in higher amounts of the functional units’ phosphorus and potassium. Global warming increases for all scenarios and the differences between the reference scenario and the biogas scenarios are levelled out. Composting becomes less favourable with respect to GWP than before. Acidification and eutrophication increase but the internal order remains the same. The same result is found for photochemical oxidants and consumption of primary energy carriers. 4.3.3 Higher biogas productionThe biogas production is boosted from 125 nm3 per ton waste to 150 nm3 per ton waste treated. The functional unit heat is almost constant as well as potassium and phosphorus. The functional units’ electrical power and nitrogen increase. For GWP the differences are small but the biogas scenarios become better in relation to the reference and composting worse. For the other environmental impact categories, the differences are extremely small and the internal relation is not changed between the scenarios. The consumption of primary energy carriers goes through the same changes as GWP. 4.3.4 Carbon sinkAs the soil is seen as a carbon sink, just GWP is affected. The results are displayed in Figures 8 and 9. Figure 8.
Figure 9. 4.3.5 Power generation from natural gas instead of coalWhen natural gas is used for compensatory power, the contribution to the GWP from the upstream system is cut in half for all scenarios. The use of electricity for the different treatment processes explains this effect on GWP. Contribution from power supply is 50 % of the original value for all scenarios. On the total, the biogas scenarios become less favourable than before compared to the reference scenario and are now in line with or somewhat higher than the reference scenario. With respect to acidification the contribution from the upstream system is decreased with a factor 10 and the impact from power supply is principally zero for all scenarios. This affects predominantly the composting scenarios, which now become better than before. Scenario Compost 2004 is now comparable to scenario Biogas long term. The difference between the biogas scenarios increases. Also for eutrophication, the upstream system and power supply are heavily decreased. These activities only contribute with a small part of the total impact (the core system dominates), no major changes are observed on the total level. Formation of photochemical-oxidants decreases to approximately 1/3 of the original value for the upstream system and almost disappears for power supply. On the total, scenario Compost long term becomes somewhat lower than scenario Biogas long term. Consumption of primary energy carriers decreases for all scenarios but less for the reference scenario and the biogas scenarios (100 TJ) and more for the compost scenarios (200 TJ). There is no shift in order between the scenarios. 4.3.6 Heat generation from natural gas instead of coalThe last sensitivity analysis is a change of fuel from coal to natural gas for compensatory heat. As the scenarios to a larger and larger extent include compensatory heat, the impact of fuel change affects the scenarios in correspondence to that. The biogas scenarios are somewhat less favourable compared to the reference scenario and scenario Composting long term is most affected. For eutrophication, no changes can be observed because district heating constitutes such a small part of the total impact in each scenario. The changes are however never so large that the order between the scenarios is changed. |