Flora and Fauna Changes During Conversion from Conventional to Organic Farming
2 Wild flora (Jensen, A.-M.M. & Johnsen, I.)2.1 Vegetation studies2.1.1 Non-destructive method used to study the density, the phenology, the species richness and the composition of the wild flora 2.1.2 Destructive method used to study the biomass and the correlation between weed density and biomass 2.1.3 Method used to study the bird available seed mass 2.2 Results 2.2.1 Results of the non-destructive method used to study density, phenology, species richness and composition of weed plants 2.2.2 Results of the destructive method used to study the biomass 2.2.3 Results of the bird available seed mass 2.3 Discussion 2.3.1 Density 2.3.2 Flowering 2.3.3 Species richness 2.3.4 Weed composition 2.3.5 Biomass 2.3.6 Bird available seeds 2.1 Vegetation studiesThe objectives of the studies were to detect any changes in the wild flora populations during conversion from conventional to organic farming, in particular changes in selected vegetation variables that might have an impact on the fauna on the fields. Three different vegetation studies were performed during 1997-2001: 1) Non-destructive study of the density, the phenology, the number of species and the composition of the wild flora. 2) Destructive study of the aboveground biomass and the correlation between density and biomass. 3) Study of the seed mass available as food items for birds in autumn. Data were obtained from one field with spring barley and one with winter wheat each year from 1997 to 2001. In 1997-1999, fields were grown conventional and in 2000-2001, fields were grown organic (chapter 1). 2.1.1 Non-destructive method used to study the density, the phenology, the species richness and the composition of the wild flora2.1.1.1 Sampling design Because of results from former study (Jensen & Johnsen 2002), each sampling site was examined two times during the growing season, once before the first spring weed control (April-May) and once approximately three months later (July-August). The observations before spring weed control were used as a covariate in the analyses of density and species richness after weed control, thereby the effects of soil cultivation, weed control in autumn and initial germination from the seed bank were included in the covariate. 2.1.1.2 Weed identification Weed seedlings were identified using Hanf (1990) or Haas & Laursen (1994), the vegetative grasses using Grøntved & Sørensen (1941) and the flowering plants using Hansen (1981). Nomenclature follows Tutin et al. (1964-1980). Determination of densities of perennial plants that either germinates from roots or from rhizomes (e.g. Elymus repens and Equisetum arvense) was based on shoots more than 2 cm apart. Shoots that were closer than 2 cm were counted as one individual plant. This study included identification of the weed species present as well as counting the number of individual plants per species within the sampling sites. The grown cereal and the undersown catch crop were not counted. Data from the individual sampling sites within the same subplot were summed up giving the total number of plants all together and per species as well as the number of species per subplot. Since the number of species found in an area is dependent of the area sampled, it has no meaning to calculate the species number for other areas than the investigated area - the subplot area (=0.96 m2). For correlation with the fauna variables, the weed plants were grouped in dicotyledonous plants, monocotyledonous plants (including Equisetum arvense), Cruciferae and Bilderdykia convolvulus and Polygonum aviculare together. An arithmetic mean of species richness per 0.96 m2 and a geometric mean of the weed densities (expressed as individuals/m2) were calculated for each plot. Geometric means were calculated for data not following a normal distribution. 2.1.1.3 Phenology The aim was to detect sublethal effects on fitness of weed plants, measured as ability to flower. In addition, flowering plants provide pollen and nectar for insects and later in the season seeds for insects, birds and small mammals, whereas vegetative plants provide less energy-dense food. The proportion of flowering plants per subplot was calculated as the number of flowering individuals in the subplot divided by the total sum of plants across all species in the subplot. An arithmetic average calculated per plot was used in the analysis. 2.1.1.4 Statistical analyses For all variables tested, model assumptions were checked by plotting the residuals against the predicted values and by running the Shapiro-Wilk test for normality (SAS Institute 1990a). No indications of violation of model assumptions were found.
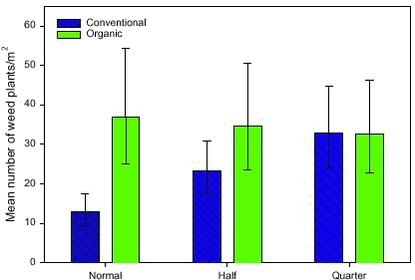
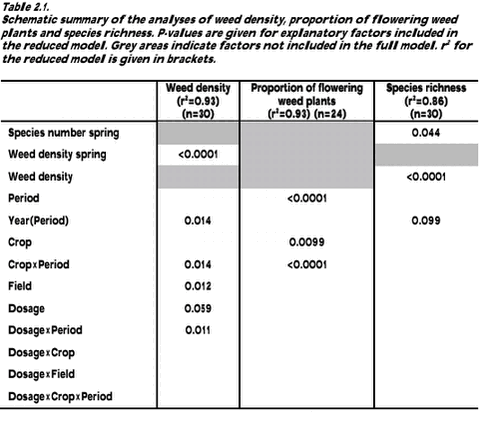
Flora composition 2.1.2 Destructive method used to study the biomass and the correlation between weed density and biomassThe main aim was to correlate the biomass of weeds, catch crops and cereals with the presence of arthropods (section 3.2.4) and birds (section 4.2.2). Therefore, the biomass was sampled in the organic period 2000-2001. Aboveground biomass of weed, catch crop and cereals was harvested once per year in late June or early July. At this time, the weed biomass was expected to be close to its maximum value. Biomass was harvested in 50 circles (30 cm in diameter) in each plot (total area of 3.5 m2 per plot). The circles were situated on lines perpendicular to the tramlines. These lines were placed with regular intervals along two tramlines in each plot. The circles were positioned of both sides of and with varying distance from the tramline. The weed plants, the catch crop plants and the cereals were harvested in each circle. The harvested plants were dried at 80 oC in 48 hours and weighed. Each weed species was weighed separately. To reduce the amount of 0-observations of weed and catch crop, the 50 circles were pooled five and five resulting in 10 samples of biomass and density in each plot. A Pearson correlation was used to correlate biomass and density. For correlation to the fauna the aboveground biomass was separated in several groups: 1) The cereals, 2) the undersown clover only, 3) the undersown ryegrass only, 4) all dicotyledonous weed species, 5) all monocotyledonous weed species (including Equisetum arvense) and 6) the catch crops and the weeds together. Biomass data for these groups were given as geometric means except for the crop biomass, which was given as an arithmetic mean. The transformations stabilised variation and approximated the data to a normal distribution. 2.1.3 Method used to study the bird available seed massThe bird available seed mass refers to the weight of seeds with a diameter greater than 0.5 mm, lying on the soil surface after crop harvest. It may be assumed that all seeds constitute a potential food resource for e.g. birds and mice, but seeds of some weed species might be poisonous or avoided for other reasons (Diaz 1990). The bird available seeds may also play a role as food resource after the seeds have germinated and become seedlings (e.g. Green 1980). Especially in winter, seeds on arable stubble fields constitute a major part of the food eaten by birds in the agricultural landscape (Steenfeldt et al. 1991, Donald et al. 2001). The number, composition and richness of seeds lying on the soil are very important for the structure of the vegetation in the following years. Most of the seeds enter the soil seed bank as a result of cultivation and then become a part of the potential future weed vegetation.2.1.3.1 Field work 2.1.3.2 Laboratory work After sieving, the samples were weighed and submersed in a flotation solution of potassium (K2CO3) with af specific density of 1.43 g/ml. Specific densities of weed seeds varied between species from less than 0.7 to 1.42 g/ml (Jensen 2001). The amount of flotation solution was between 1 and 2 times the volume of the seed samples. After 24 hours, the high-density particles precipitated and the low-density particles (organic material) remained at the surface. The supernatant was carefully transferred to a filter paper over a vacuum pump, which removed the remaining flotation solution. The filter paper with all the organic material was placed in a petri dish and air-dried at 20oC. Then the material was spread in a thin layer under a magnifying stereoscope and all seeds were identified to species and counted. Seeds were identified by literature (Beijerinck 1947, Holm-Nielsen 1998) or by comparison with a seed reference collection made from mature plants in the fields. Some seeds were only identified to genus level, e.g. seeds from Lamium amplexicaule, Lamium hybridum and Lamium purpureum were very difficult to identify (pers. obs.), and seeds from these species were all called Lamium sp. Seeds resisting the pressure from a pair of tweezers were registered as seeds with endosperm. Some seeds did not contain endosperm and therefore were not able to provide energy for birds; such seeds were excluded from the figures and analyses. 2.1.3.3 Data description 2.2 Results2.2.1 Results of the non-destructive method used to study density, phenology, species richness and composition of weed plants2.2.1.1 Density analyses The interaction between dosage and period had a significant effect on the weed density (Table 2.1). In the organic period, no differences in weed density were found as a function of former dosages. On the contrary, the dosage had a significant effect on the weed density in the conventional period (Fig. 2.1). The density at normal dosage in the conventional period was significantly lower than the density at quarter dosage and the density in the organic period.
Figure 2.1.:
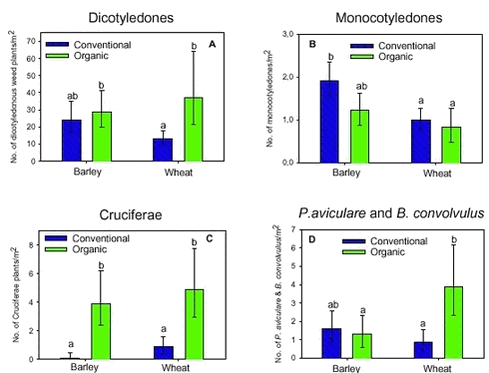
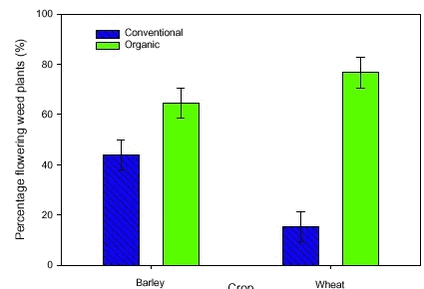
The estimated mean densities of the four groups of weed plants varied with crop and period (Fig. 2.2). Density of the dicotyledonous weed plants was significantly higher in wheat fields in the organic than in the conventional period (Fig 2.2 A). The density of the monocotyledonous weed plants did not change significantly with the period (Fig. 2.2 B). On the contrary, the density of the Cruciferae was significantly higher in the organic than in the conventional period in both crops (Fig. 2.2 C). The density of Bilderdykia convolvulus together with Polygonum aviculare was only significantly higher in the organic period in the wheat fields (Fig. 2.2 D). Figure 2.2. 2.2.1.2 Proportion of flowering weed plants In average, 33% of the wild plants was seed setting before harvest in the organic period across significant differences between year and crop (variance analysis not shown). Data for the conventional period was not available, but the percentage of seed setting plants must be lower than 33%, since only 30% of the weed plants had reached the flowering stage.
Figure 2.3.
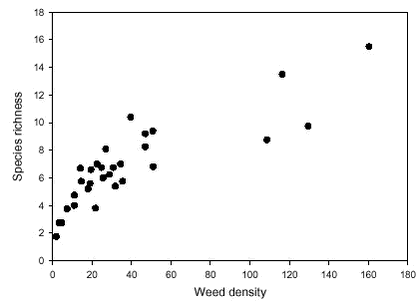
The number of weed species was strongly related to the density of weed plants (Table 2.1). 76% of the variation in species richness was explained by the variation in the ln-transformed density (Fig. 2.4). Thus, species richness responds in the same manner as the weed density to a conversion from conventional to organic farming (cf. Fig 2.1). When weed density was excluded from the analysis, the mean number of species at normal dosage in the conventional period (4.4) was significantly lower than the species number at quarter and half dosage in the conventional period and the species number in the organic period (all between 6.9 and 7.6).
Figure 2.4.
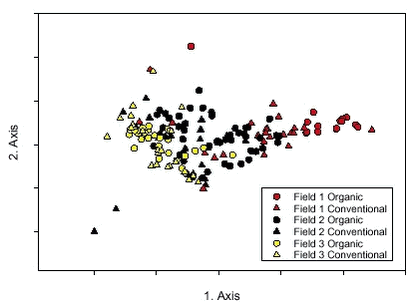
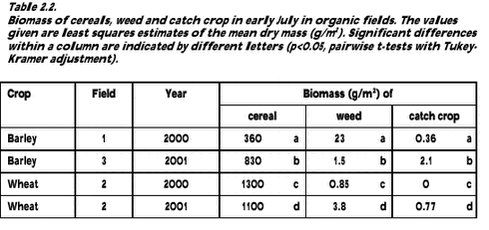
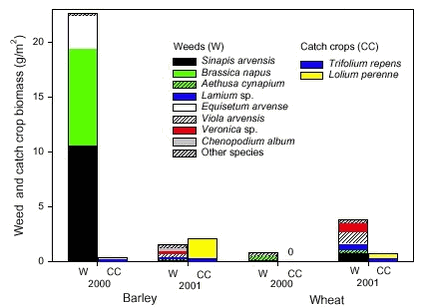
Figure 2.5. Field 1 was dominated by Sinapis arvensis, Brassica napus, Euphorbia exigua and Equisetum arvense, the last was not found at all in Fields 2 and 3. The dominating weeds on Fields 2 and 3 were almost similar: Aethusa cynapium, Viola arvensis, Trifolium sp. and Bilderdykia convolvulus. Furthermore, Sonchus sp. was present in Field 2 and Veronica agrestis/persica in Field 3. 2.2.2 Results of the destructive method used to study the biomass2.2.2.1 Biomass Not surprisingly, the crop biomass was higher in winter wheat than in spring barley. The winter wheat plants were maturing the seeds at the time of biomass harvest (in both years) and the spring barley plants were in late flowering (year 2000) or early development of seeds (2001). In total 1846 weed plants were harvested. The weed biomass was highest in the barley field in 2000, it was more than seven times higher than in the other fields. The biomass of this field was dominated totally by three species: Brassica napus, Sinapis arvensis and Equisetum arvense. The weed biomass in the other fields was distributed more evenly between more species (Fig. 2.6).
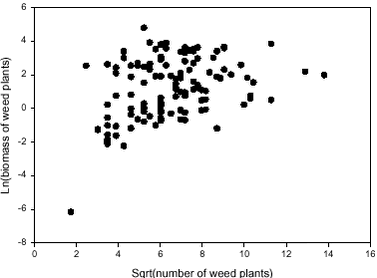
Figure 2.6. 2.2.2.2 Correlation between weed density and biomass
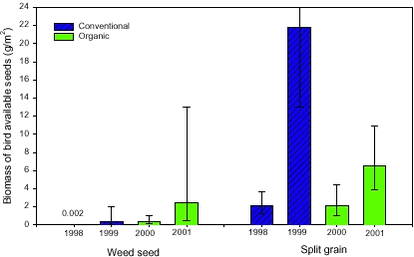
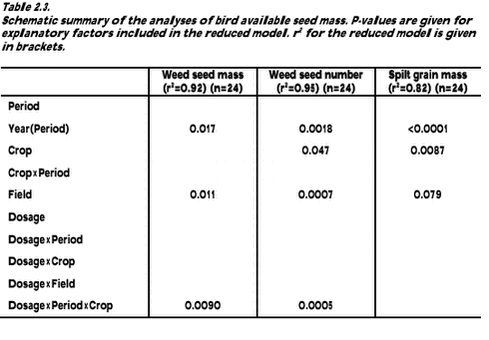
Figure 2.7. 2.2.3 Results of the bird available seed massOver all years, there was on average 4.6 g spilt grains and 0.085 g weed seeds on the stubble fields after harvest. Thus, the weed seeds made up only 2% of the total biomass of bird available seeds on the stubble fields. There was significantly higher weed seed biomass available on the soil surface in the organic period (0.95 g/m2) than in the conventional period (0.026 g/m2) (t-test of least square means, p<0.0001). The highest weed seed biomass was found in 2001 (Fig. 2.8) mainly because of the presence of Bilderdykia convolvulus seeds in the winter wheat (Field 2). B. convolvulus has very heavy seeds (7.5 mg/seed) compared to the other weed species found (Melander 1998) and made up 80% of the weed seed mass in the wheat field in 2001. Not only the seed mass but also the density of weed seeds was significantly higher in the organic (mean= 625 seeds/m2) than in the conventional period (mean 36 seeds/m2) (Table 2.3) (t-test of least square means, p<0.0001).
Figure 2.8. The biomass of weed seeds on the soil surface was also strongly influenced by the field (Table 2.3). The least square means of the biomass of weed seeds estimated from the model gave 23 g seeds/m2 on Field 1, less than 0.0005 g seeds/m2 on Field 2 and 0.28 g seeds/m2 on Field 3. The period had no significant effect on the biomass of spilt grain (Table 2.3), but the biomass varied considerably between years (Fig. 2.8). A higher biomass of barley grains than of wheat grains was found, even though wheat grains weights more than barley grains.
2.3 Discussion2.3.1 DensityIn winter wheat, the density of weeds after weed control was higher after conversion to organic farming than in the conventional period with normal dosage of pesticides, but it was not significant from the density in the conventional period when sprayed with reduced dosages of pesticides. Increased densities of Cruciferae and Polygonacea followed the higher weed density found during the organic period. In spring barley, no difference on overall density was found after conversion. This different response between crops might be due to the more intensive mechanical weed control in barley than in wheat. Thus, the weed control strategies used in organic barley production were shown to be as effective in killing the weed plants as normal dosage of herbicides. The weed density before and after spring weed control was quite low in this study both before and after conversion. Still an increased density of weeds is normally typical of the early stages of conversion to organic farming (Kauppila 1990, Davies et al.1997, Salonen et al. 2001). However, organic growers say that the weed problem diminishes with time (Davies et al.1997); especially the presence of grass in the crop rotations reduces the weed density (Davies et al.1997). Due to a very low weed density in the years before conversion, the seed banks do not contain a stock of weed seeds, which are able to germinate and increase the weed density drastically. Furthermore, it has been shown, that the intensive managed fields are not infested by seeds from outside the fields, especially not in the mid-fields (e.g. Marshall 1989). Therefore, it might take several years before the weed density increases. Density increase is dependent on the seed set of the weeds within the field. 2.3.2 FloweringSince the majority of weed plants were annuals, the proportion of plants that was able to reach flowering reflect the fitness of the weed population. In this study, the proportion of flowering weed plants was much higher in the organic than in the conventional period. The proportion of flowering plants increased in both spring barley and winter wheat. There were more plants flowering in organic winter wheat than in organic spring barley, which might be due to a higher chance to survive early germination in an already established cereal field, where no blind-hoeing was performed and where the mechanical weed control was less intensive. This study shows that the weed population even though it has the same density in barley as in the conventional period was more fit when not sprayed. This may result in a higher seed production on average and an increase in weed density over longer time. The higher proportion of flowering plants produce more food items for the fauna. Since flowering plants are often larger and have developed more parts than vegetative plants, they increase the spatial structure and complexity of the vegetation and thereby support more living places for arthropods. 2.3.3 Species richnessThe species richness of the weed flora reacted in the same way as the weed density on the conversion from conventional to organic farming, as they were highly correlated. After conversion a higher number of species was only found in the plots treated with normal dosage of herbicides during the conventional period; the species number reached the same level as in the plots treated with reduced dosages before conversion. Thus, the conversion to organic farming has not resulted in significantly more species than those present with reduced dosages of pesticides. A low level of herbicides before conversion to organic farming might be the explanation why Davies et al . (1997) did not find any change in number of weed species four years after conversion. When old organic fields are compared with conventional fields, it is common to find a much higher species richness in the organic fields (Herrmann et al. 1986, Moreby et al. 1994, Hald 1999). Therefore, organic farming could be a way to preserve biodiversity (Elsen 2000, Rydberg & Milberg 2000) and prevent further decline in rare weed species (Albrecht & Mattheis 1998). 2.3.4 Weed compositionIt is known that the intensity of herbicide use within the previous 10 years in a field can explain differences in weed flora composition (Salonen 1993). Therefore, it was expected that conversion from conventional to organic farming would change the weed composition as found by Hald (1999) comparing conventional and old organic fields. However, this could not be confirmed by this study. In this study, the main separator of the weed flora communities was the different fields, not the farming type. The field difference had also a significant influence on the density and diversity of the wild flora. The fields differ e.g. from each other by their different history of management (kind of crops, weed control, soil cultivation and so on), which have created the content of the different seed banks in the fields. The seed banks may contain seeds with a longevity of more than 20 years (Thompson et al.1997) and since only 3-6 % of the seeds in the seed bank germinate each year (Roberts & Ricketts 1979) it is likely to take more than two years to change the composition of the seed bank and thereby the weed flora on the fields. 2.3.5 BiomassThe biomass was not sampled during the conventional period, so comparison between the farming types was not possible. 2.3.5.1 Crop biomass In this study, the crop biomass was dependent on crop type and year. Winter wheat had a higher biomass than spring barley, because wheat plants at the time of biomass sampling in this study were closer to be mature than barley plants and because winter wheat on average yields more than spring barley. The differences between years cannot be a result of the stage of development at the time of biomass sampling, but may among other things be a result of different straw density. 2.3.5.2 Weed biomass The highest weed biomass found was 23 g/m2 compared to 34 g/m2 in old organic cereal fields in Denmark (Hald 1999) and 47 g/m2 found in organic spring cereal fields in Finland (Salonen et al. 2001). The biomass harvests were performed almost at the same time in the growing season, so the differences cannot alone be explained by differences in harvest times. A reason for a higher biomass found in those investigations could be the presence of perennial species with a high dry weight e.g. Cirsium arvense (which is a problematic weed species in organic farming). The presence of perennial species was as expected very low in this study. On average, only 2 % of the total biomass in the organic cereal fields was weeds, which is very low compared to the 12 % found in old organic cereal fields in Denmark (Hald 1999) and the 17 % found in spring cereals in Finland (Salonen et al. 2001). In 38 conventional cereal fields, Hald (1999) found an average weed biomass of 2 % of the total biomass, the same as in this study. Thus, the weed biomass was more like the level of conventional fields than organic fields. With such a low percentage of weed biomass, it is unsure how much the weed flora can influence the fauna. The weed vegetation is more or less like small islands in a large ocean of crops.In this study, the total weed biomass correlated weakly with the weed density, which was also found by Salonen (1993). Kauppila (1990) found that changes in weed dry weights followed the changes in weed density by conversion from conventional to organic farming in Finland. Thus, the weed density might be an acceptable but very rough measure for the biomass. Weed density is the best vegetation variable to correlate with the fauna variables in this study, since biomass was not sampled in the conventional period. 2.3.6 Bird available seedsThe bird available seed mass on the soil surface in autumn consisted mainly of spilt grains as found by Jensen & Johnsen (2002). Berthelsen et al. (1997) found that the Partridge prefer spilt grains rather than weed seeds, this may as well be true for other agricultural bird species of a certain size. The total seed mass varied considerably from year to year from 2 to 23 gram/m2. The mass of weed seeds was much higher in the organic period than in the conventional, especially in 2001 where seeds from Bilderdykia convolvulus were the main contributor in weight. These seeds were eaten by many of the birds in the agricultural land (Christensen et al. 1996). A higher weed seed mass and density in the organic period may be a result of the higher proportion of flowering plants and thereby a higher possibility to set seeds. Thus, the organic farming produces more food items in the autumn and more seeds to the seed bank than the conventional farming. This is confirmed by Davies et al. (1997), who found that the seed bank populations increased quickly after conversion.
|
