Flora and Fauna Changes During Conversion from Conventional to Organic Farming
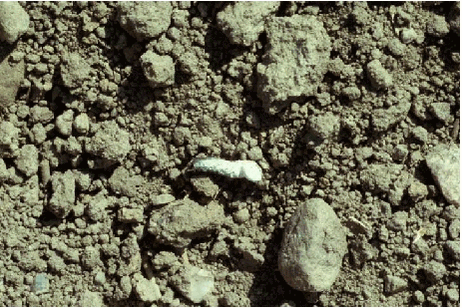
5 Food choice of Skylarks (Petersen, B.S. & Navntoft, S.)5.1 Methods5.1.1 Collection of faeces 5.1.2 Analysis of faeces 5.1.3 Data analysis 5.2 Results 5.3 Discussion 5.3.1 Sources of bias 5.3.2 Skylark food preferences 5.3.3 Effects of conversion to organic farming Skylark food choice was studied during the period of organic farming only (2000 and 2001). Parallel with the bird observations, Skylark faeces were collected from the study fields. The faeces were analysed for arthropod fragments in the laboratory, and the Skylarks‘ choice of food items was compared with the available food resource as determined from the suction samples. 5.1 Methods5.1.1 Collection of faecesOn each observation day, 18 faecal pellets (6 per plot) were collected in each study field after the finishing of the bird counts (cf. section 4.1.1). Skylarks were the only small passerines occurring in any numbers in the study fields, making confusion with faeces of other species unlikely. Furthermore, Skylark faeces (Fig. 5.1) are quite distinct from faeces of most other species, chiefly due to their cylindrical (not twisted) shape (N. Elmegaard pers. comm.). A faecal pellet was not collected if there was any doubt about its origin.
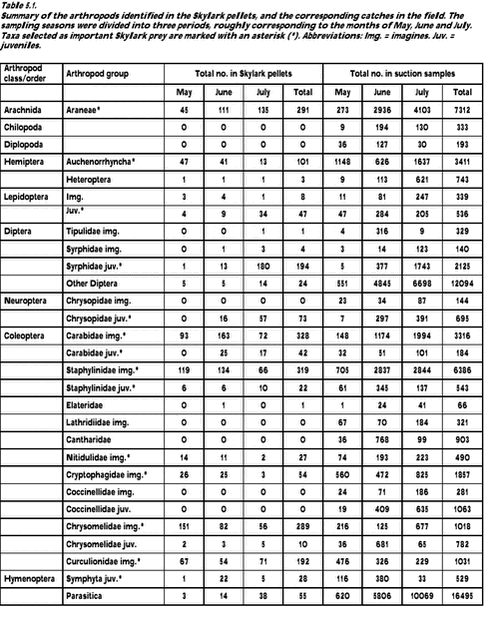
Fig. 5.1. Faeces were sampled while the observer was walking up and down the tramlines. No special selection of pellets was made, except that the consistency of the pellet should allow it being collected as a whole. In order to reduce the probability of sampling more than one faecal pellet from each individual Skylark per day, observers were requested to walk at least 50 m onwards before the next faecal pellet was collected. With these restrictions, the first six pellets found in each plot were sampled; this could in most cases be accomplished within 30 minutes. The faecal pellets were put into glass tubes and cooled down in an insulated bag as soon as possible after collection. After returning to the laboratory the pellets were stored at -18°C until further analysis. A total of 1296 faecal pellets were collected and stored. 5.1.2 Analysis of faecesTwo pellets from each glass tube were chosen for analysis. In the laboratory the pellets were treated according to a method by Elmegaard et al. (1999). The material was positioned in a 20% sodium hydroxide solution about 20 minutes thereby removing uric acid and other fragments, which could otherwise hamper a careful identification of the arthropod parts. Thereafter the samples were rinsed in demineralised water using a filter paper to collect the residues. The arthropod parts were identified in a binocular microscope (8 - 100 × magnification). Scanning electron microscope (S.E.M.) photographs of some fragments and of reference arthropods as well as photographs by Moreby (1988) supported the identification process. The residues were identified at least to order, but mostly to more specific taxa. The identified fragments of specific taxa was quantified as one individual, unless there were clear signs of higher numbers (no. of legs, heads etc.). A total of 432 faecal pellets of Skylarks were analysed. The method used did not allow a determination of the plant contents of the pellets. Determination of plant contents would have required another processing of another set of faecal pellets which was not possible. 5.1.3 Data analysisThe aim of the analyses was to describe the composition of the faecal samples, to test for differences in composition between faecal samples and suction samples, and to test whether food choice and preferences varied with crop, year and time of the season. The number of arthropod individuals found in faecal samples and suction samples, respectively, was summed for 29 taxonomic groups (Table 5.1). Based on these absolute frequencies the following statistical analyses were performed:
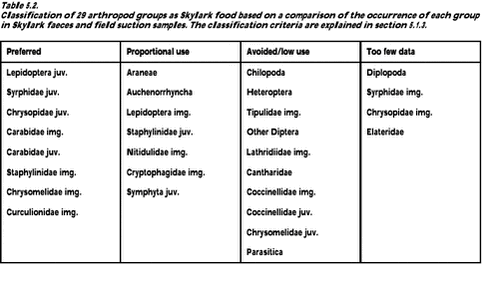
Comparison of compositions was performed using a G-test of independence (e.g. Sokal & Rohlf 1981). If the initial G-test showed a significant difference (p < 0.05), a Fisher exact test was carried out for each of the n arthropod groups to determine which proportions differed significantly between the samples. Because n tests were performed simultaneously, Bonferroni correction of the significance level was used (α = 0.05/n). Several authors have used a similar test procedure to analyse data on animal resource use (e.g. Neu et al. 1974, Marcum & Loftsgaarden 1980, Haney & Solow 1992). In order to describe the Skylarks‘ food choice, "preference", "avoidance/low use" and "proportional use" of an arthropod group were defined as follows.
Avoidance/low use: frequencies in faecal sample and suction sample differed significantly and proportion of faecal sample was at least 50% lower than proportion of suction sample.
Proportional use: all other cases except where data were regarded too few. The latter was the case if (1) expected frequency was less than one, (2) Fisher test was non-significant (suggesting proportional use) but expected frequency was less than five, or (3) Fisher test was non-significant but frequency in faecal sample was zero. Because the proportions sum to one, "preference" and "avoidance/low use" are used in a relative sense; preference of one food source invariable leads to avoidance/low use of another. Similarly, if an arthropod group occurs in the suction samples but is not truly available to foraging Skylarks, other groups will appear as “preferred”. Several other sources of bias exist and are discussed in section 5.3.1. For the presentation of the results, and for the evaluation of the relative importance of the different arthropod groups as food for Skylarks, the number of individuals was converted to dry mass. The conversion was based on estimated arthropod length as described in section 3.1.2.1. Many arthropod fragments, however, could not be identified to the same detailed taxonomic levels as used for suction samples. The length estimates of arthropods collected by suction could therefore not directly be used for some higher taxonomic levels identified in the pellets, e.g Curculionidae. For these more heterogeneous groups, weighted mean lengths based on the frequency of occurrence of specific families, genera or species in the suction samples were used instead. 5.2 ResultsIn Table 5.1 the total numbers of the major arthropod groups identified both in Skylark faeces and in suction samples are listed. Besides the groups included in the table, a few Formicidae, Opiliones, Scarabaeidae and Silphidae were found in faeces and suction samples. Also a few Aphididae and Collembola were identified in the faecal samples whereas these groups were not counted in the suction samples (section 3.1.1).
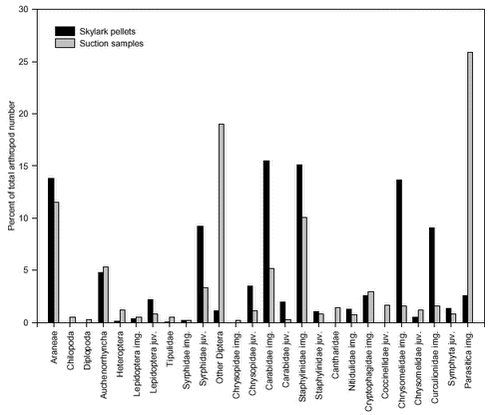
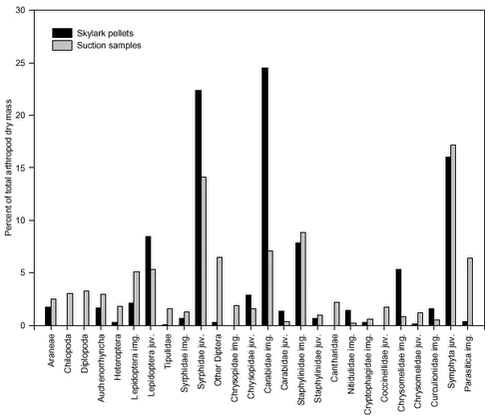
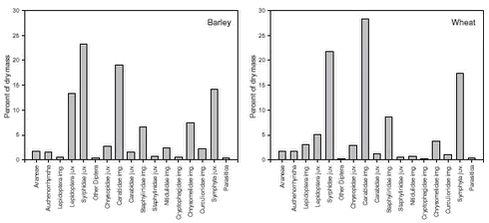
The composition of the total faecal sample was significantly different from the composition of the total suction sample (p < 0.0001). For each of the most important arthropod groups, Fig. 5.2 visualizes its proportional share of the total number of arthropods in faecal samples and suction samples, respectively. Fig. 5.3 shows the same, but measured as proportion of dry mass. The figures thus indicate which groups generally constitute the most important Skylark prey and also suggest which groups tend to be preferred or avoided by the Skylarks. However, no conclusions should be drawn from the figures without taking the different sources of sampling bias (section 5.3.1) into account. Similar reservations apply to Table 5.2, which classifies the value of the different arthropod groups as Skylark food according to the criteria listed in section 5.1.3. Fig. 5.2. The composition of faecal samples from wheat and barley (Fig. 5.4) differed significantly (p < 0.0001). When tested separately, only the relative frequencies of Chrysomelidae imagines and Cryptophagidae differed significantly between crops. Both groups were more frequent in faecal pellets from barley fields than in pellets from wheat fields and were also found more frequently in suction samples from barley. Fig. 5.3.
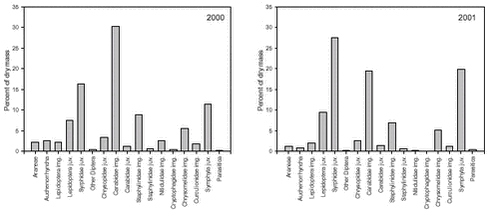
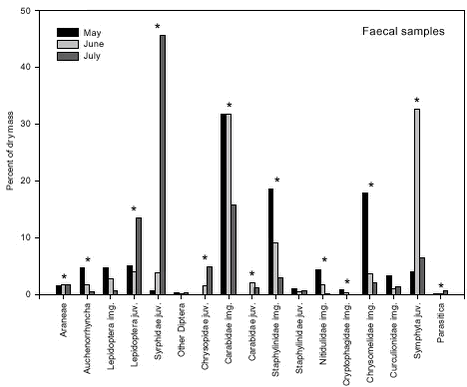
Fig. 5.4. The composition of the faecal samples also differed significantly between years (p < 0.0001). The relative frequencies of Auchenorrhyncha, Cryptophagidae and Nitidulidae were significantly higher in 2000 than in 2001 while the opposite was true for juvenile Syrphidae (Fig. 5.5). These differences mirrored similar differences in the composition of the suction samples. Fig. 5.5. There were also significant changes in the composition of the faecal samples during the season (p < 0.0001). When tested separately, 13 groups showed significant, seasonal changes in relative frequency (Fig. 5.6). In some groups these changes in proportion of diet reflected similar changes in their occurrence in the fields (Fig. 5.7), but in most groups the data suggested a shift in the Skylarks’ dietary preferences during the season.
Fig. 5.6.
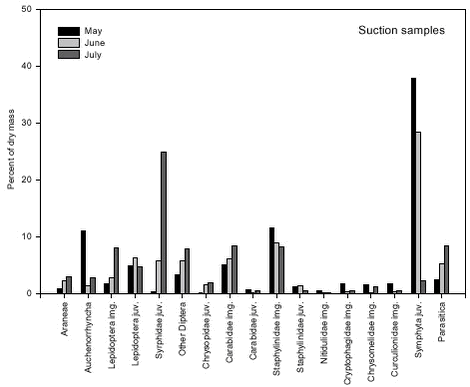
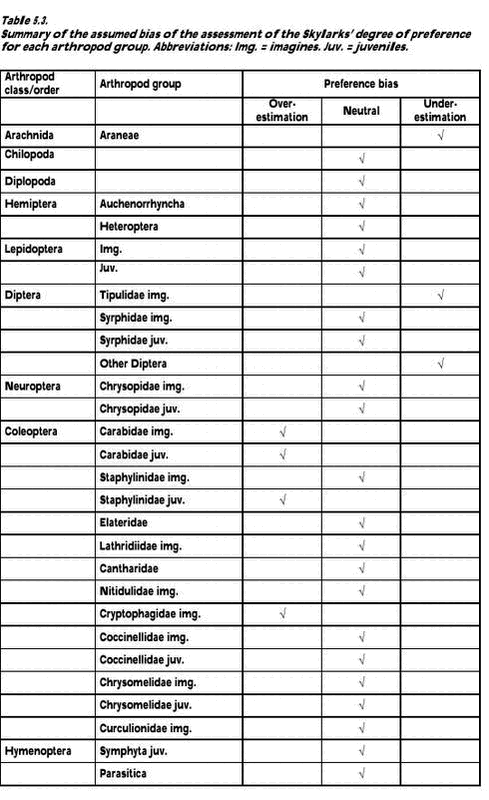
Fig. 5.7. 5.3 Discussion5.3.1 Sources of biasThe strength of this experiment is that the measuring of abundance of different food taxa and the diet composition studies based on bird faeces were carried out at the same time and within the same fields. Without a measure of food abundance, it is impossible to know whether the diet composition revealed by the faecal samples simply mirrors the relative availability of different food taxa or whether birds actively select or avoid different potential food items. However, different methods of sampling of prey and diet data create several biases in the measurement of overall diet composition and evaluation of food preferences (Wilson et al. 1999). Faecal analysis tends to underestimate the presence of soft-bodied invertebrates (Eybert & Constant 1992). Moreby (1988) found that Collembola, Diptera, very small Coleoptera, nymphal-stage Hemiptera and small Hymenoptera may be underestimated. Moreover, remains from some taxa pose identification problems, with the consequence that the level of detail available differs greatly across data. This should be seen in combination with the fact that little information is available on identification of arthropod larvae at detailed taxonomic levels (Wilson et al. 1999). Therefore identification of arthropod fragments in this study was limited to distinguishable major groups. Suction sampling introduces a bias towards smaller species in the abundance measurements. Efficiency has been found to vary with species within size groups and in relation to vertical stratification and daily activity. Vegetation density and humidity also influences sampling efficiency (Sunderland et al. 1995). Among the arthropod groups included in this study especially larger Carabidae adults inevitably are underestimated in suction samples relative to their abundance in the field. This is due to their concealed location on and within the ground and their predominantly nocturnal activity. Juvenile Carabidae and Staphylinidae are underestimated too, because of their ground dwelling activity. Also Lepidoptera and Symphyta are difficult to sample efficiently by suction. For adults densities are probably underestimated due to their ability to escape during sampling, a general problem with flying stages. The larvae are able to cling to the plants and this ability increases with size, probably causing underestimation of the number of large larvae. This problem may also occur for other larvae and pupae with a clinging ability, e.g. Chrysomelidae larvae. Furthermore, in late season when the crop is high, a number of insects found in the crop canopy are sampled although they are not available to the Skylarks, which exclusively forage on the ground. An accurate description of food density is difficult to make and precise estimates of food availability are hardly obtainable (Elmegaard et al.1999). The most pronounced bias in a preference study may occur when a certain arthropod group is overestimated by faecal analyses and underestimated by suction sampling or vice versa. This may be the case especially for Carabidae, of which fragments are easily identified in faecal pellets but densities are underestimated by suction sampling in the field, resulting in a considerable overrating of the degree of preference. Seasonal changes of bias may occur, especially in some juvenile groups. In May, the larvae are small and easy to sample but difficult to identify in the faeces. Later in the season, the large larvae are more easily identified in faeces while suction sampling is hampered by their ability to stick to the plants. As a result, the degree of preference may be underrated in early season but overrated in late season. Another kind of bias is created when the number of individuals is converted to dry mass based on length estimates. Naturally, the method overestimates dry masses of long and slender specimens, e.g. Symphyta larvae, compared to short and broad specimens, e.g. Chrysomelidae adults. Furthermore, some estimates of mean length are questionable because they are based on suction samples, a method which tends to favor sampling of small individuals. For instance the length estimate of the subgroup “Other Carabidae”, of which individuals were only identified to family level in the faecal pellets, was probably to low. Another problem occurred because of seasonal changes. For practical reasons it was decided to use only one length estimate of juvenile stages, despite the size development during their life cycle (e.g. Symphyta larvae grow from a few mm to 4 cm). This decision caused dry masses of juveniles early in the season to be overestimated while dry masses of juveniles later in the season were underestimated. All statistical tests, and thus the determination of “preferred” and “avoided/low use” groups, were based on the raw data, i.e. on the number of individuals. The conversion to dry mass and the associated biases caused some displacement of preference/avoidance patterns, as can be seen from a comparison of Figs. 5.2 and 5.3. For instance, the proportion of Staphylinidae individuals was higher in the Skylark pellets than in the suction samples, whereas the opposite was true when estimated dry masses were considered. In Table 5.3 the combined effect of the different sources of bias mentioned above is assessed for each of the taxonomic groups included in the study. 5.3.2 Skylark food preferencesJudged from the faecal samples, and averaged over the whole sampling period, adult Carabidae together with juvenile Syrphidae and Symphyta made up more than 60 percent of the dry mass of the animal part of the Skylark diet in the study fields. Also juvenile Lepidoptera and adult Staphylinidae and Chrysomelidae constituted more than five percent of the dry mass. Araneae and adult Curculionidae were eaten in large numbers too, but due to their generally small body size both groups made up less than two percent of the total dry mass. The vegetable part of the diet was not measured in the present study but may constitute more than 50 percent of the total dry mass (Cramp 1988, Christensen et al. 1996). Adult Carabidae, Staphylinidae, Chrysomelidae and Curculionidae beetles were all found in Skylark faeces in higher numbers than predicted by their frequency in the suction samples, indicating that they were preferred by the Skylarks. For the large, ground-dwelling beetles, however, the degree of preference may well be overestimated (cf. section 5.3.1). Juvenile Syrphidae, Lepidoptera and Chrysopidae were preferred whereas Symphyta larvae were utilized in accordance with their frequency of occurrence. Other taxa occurring in approximately equal proportions in faecal samples and suction samples were Araneae, Auchenorrhyncha and adult Lepidoptera, but these groups constituted only a few percent of the total dry mass. In sugar beet fields during spring, Green (1980) found that insect remains in Skylark faeces were almost entirely from adult Coleoptera. Fifty-six percent were from Elateridae, 22 percent from Curculionidae, 13 percent from Scarabaeidae and 9 percent from Carabidae. In the present study, Elateridae made up less than 0.1 percent. The different results are probably due to very different field conditions; the almost bare beet fields in spring hardly offer any host plants for herbivorous insects. A few Aphididae were identified in the faecal pellets but aphid numbers were not estimated in the suction samples. Due to the energy cost for the Skylarks of collecting such small insects, they are considered unimportant as food items (N. Elmegaard pers. comm.). Feeding experiments with Aphididae have revealed that shares higher than 7 percent of the diet inhibited growth and feather development of Partridge chicks (Borg & Toft 2000). ”Other Diptera” and Parasitica were frequent in the suction samples but were rarely found in the faeces. In general, it is probably difficult (and not energetically profitable) for Skylarks to feed on small, fast-flying insects. Among the other groups avoided or little used were Chilopoda, Diplopoda, Heteroptera, Cantharidae, adult and larval Coccinellidae and larval Chrysomelidae. Some of these taxa are known to contain ill-tasting or toxic compounds. There were few significant differences in Skylark faecal contents between wheat and barley fields. Chrysomelidae adults were more frequent in faecal samples from barley than in faeces from wheat, reflecting their higher abundance in barley fields. Contrary to the adults, larval Chrysomelidae turned out to be avoided. However, avoidance was only clear in barley fields where the larvae were most abundant. Particularly Oulema larvae may be unsuitable as Skylark food because they use their excrements as a protective cover. In general the arthropod fauna was more diverse in barley than in wheat, and this was partly mirrored in the composition of the faeces. Adult Carabidae were more frequently eaten in wheat, and Staphylinidae and Nitidulidae were among the preferred food items here, while this was not the case in barley where more alternative food items were available. Significant differences in faecal composition between years were few and generally mirrored similar differences in the suction samples, e.g. larval Syrphidae were more frequently found in 2001 than in 2000. Juvenile Lepidoptera and Staphylinidae were utilized proportional to their occurrence in 2000 (when they were relatively frequent), but were classified as preferred food items in 2001 (when they were rare). The avoidance/low use of Chrysomelidae larvae was only significant in 2001 when they occurred most frequently in the fields. The composition of the Skylark diet changed significantly during the season. In May adult beetles (mainly Carabidae, Chrysomelidae, and Staphylinidae) dominated. Later in the season, juvenile stages of Symphyta, Syrphidae and Lepidoptera comprised a major part of the diet. In general the composition of the diet mirrored the availability of the different arthropod groups in the fields. Thus, besides the groups mentioned above, frequencies of Auchenorrhyncha, Nitidulidae and Curculionidae in the diet declined during the season while juvenile Chrysopidae increased in numbers. Throughout the breeding season, the pattern of preference and avoidance/low use remained fairly constant, although the Skylarks’ preference for adult beetles seemed to decline as arthropod diversity increased and more soft-bodied food items became available. The apparent low use of juvenile Symphyta in May was probably largely an artifact, cf. section 5.3.1. The faecal samples did not include food brought to nestlings. Generally, the diet of Skylark nestlings consists almost entirely of insects, with very little plant material (Cramp 1988). Based on 550 nestling faeces from Danish barley fields, Odderskær et al. (1997a) found that nestling diet was dominated by Carabidae (42% of total dry weight), with Lepidoptera and Heteroptera contributing 19% and 7%, respectively. In a Swiss study from mixed farmland, ligature (neck ring) samples indicated that adult and larval Diptera dominated the diet of nestlings together with Orthoptera and Lepidoptera (Jenny 1990a). It is difficult to judge to what extent differences in methodology and differences in location contributed to the different outcome of the two studies. When the adults are feeding nestlings their own diet may be slightly changed, because some food items rich in protein and poor in chitin may be reserved for the young. 5.3.3 Effects of conversion to organic farmingOdderskær et al. (1997a) compared the diet of Skylark nestlings in sprayed and unsprayed spring barley fields. They found that Araneae, Carabidae and Staphylinidae made up a greater part of the diet in sprayed fields than in unsprayed fields whereas the opposite was true for several other groups, e.g. Lepidoptera, Chrysomelidae and Symphyta. The composition of the D-vac samples from their study fields is not described in their report, but it must be assumed that the differences in nestling diet largely reflected similar differences in the arthropod communities in the fields. In the present study, most arthropod groups preferred by Skylarks increased in abundance after conversion to organic farming, i.e. larval Lepidoptera, Syrphidae and Chrysopidae, and adult Chrysomelidae and Curculionidae. Some important groups utilized proportional to their frequency of occurrence also increased, i.e. Araneae (only in barley), Auchenorrhyncha and Symphyta. General arthropod diversity increased as well. On the contrary, Carabidae and Staphylinidae decreased in abundance after conversion. Taken together, these two groups made up between 20 and 50 percent of the animal part of the diet during the breeding season. Although these figures may be too high (section 5.3.1), especially Carabidae clearly qualified as preferred food items. They thus constituted a very important exception to the general result that Skylark food resources were improved by the conversion. Although often large and energy-rich, Carabidae and Staphylinidae may not be ideal Skylark food. Perhaps their main asset is that they are fairly easily caught. Odderskær et al. (1997a) found that nestling survival reached a minimum in the year when the frequency of Carabidae in their diet was the highest (76% of dry weight). Due to a high content of indigestible chitin, the energetic value of Carabidae and other hard-bodied beetles is somewhat lower than indicated by their dry weight. Furthermore, a diet dominated by one particular group of organisms may reduce the probability of survival. Kluyver (1933) and Tinbergen (1981) found that the mortality of Starling nestlings increased if they were fed on an unbalanced diet consisting almost exclusively of Tipulalarvae. Diversity in the food intake may thus be a quality in itself (Elmegaard et al.1999), and this is more easily obtained in organically grown fields.
|
