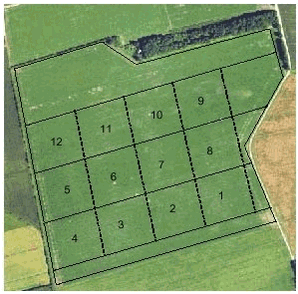
Flora and Fauna Changes During Conversion from Conventional to Organic Farming4 Birds (Petersen, B.S.)4.1 Methods4.1.1 Bird counts 4.1.2 Statistical analyses 4.2 Results 4.2.1 Analysis of Skylark numbers 4.2.2 Skylark numbers in relation to vegetation and arthropod abundance 4.3 Discussion 4.1 Methods4.1.1 Bird countsStandardized bird counts were performed at intervals of about five days between 6 May and 5 August in all five study years. All species seen or heard at the study fields were recorded. Before the counts began in early May, four subplots of 1.5 ha were demarcated within each plot (Fig. 4.1). The birds within each subplot were counted by means of a combination of point and transect counts. Firstly, a 10 minutes point count was carried out while the observer was stationary at the edge of the subplot. Then the observer spent 5 minutes walking through the subplot to the border of the next, adding to his list of records any birds within the subplot that had not been recorded from the census point. During the 15 minutes spent in each subplot, all birds seen or heard within or immediately above the subplot were recorded. Care was taken not to count an individual more than once. If a bird was recorded in more than one subplot, the observer assigned it to one, and just one of these. The chosen subplot should be the one where the bird did most of its feeding, not necessarily the one in which the nest was assumed to be located.
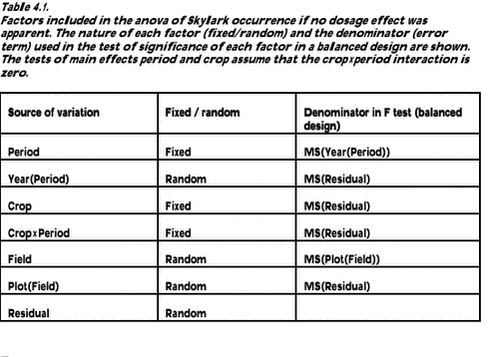
Fig. 4.1. All counts began at 8.00 a.m. Countings were not performed during unfavourable weather conditions (notable precipitation, reduced visibility, wind speed > 9 m/s). To avoid systematic biases from changes in the birds‘ activity during the day, the starting subplot varied from count to count according to a rotating scheme. In 1997 and 1998, a total of 17 counts were carried out in each field, whereas in 1999, 2000, and 2001, 18 counts per field were performed. 4.1.2 Statistical analysesAlthough all species were recorded, only Skylarks occurred in sufficient numbers to make a reliable statistical analysis possible. For each count, plot totals were calculated by summing up the number of larks recorded in the four subplots within each plot. The repeated counts of a certain plot during the season were not statistically independent. One way of dealing with this is to reduce the repeated measurements to a few, preferably mutually independent, summary statistics and carry out the analyses on these (e.g. Stryhn 1996). In the present case, 1st and 2nd degree polynomials were fitted to each sequence of counts (the graphs relating plot totals to census date), using the REG procedure in SAS/STAT (SAS Institute 1990b). The mean, the slope of the 1st degree polynomial, and the curvature (quadratic term) of the 2nd degree polynomial were used as summary statistics describing the development in Skylark numbers. The summary statistics were analysed for differences between periods (conventional/organic), crops (barley/wheat) and pesticide dosages (normal, half, quarter) using the anova model described in section 1.6. If the analyses showed that dosage effects (including interactions dosage×period, dosage×crop and dosage×crop×period) were insignificant (p > 0.10) it was assumed that dosage did not affect the distribution of Skylarks, neither before or after conversion. The dosage factor was then replaced by a plot factor, yielding the simpler model shown in Table 4.1 as a basis for further model reductions. A significant dosage×field interaction, indicating a dosage effect that varied between fields, was interpreted as a plot effect.
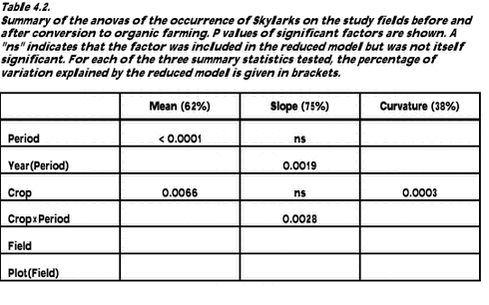
For all variables tested, model assumptions were checked by plotting the residuals against the predicted values and by running the Shapiro-Wilk test for normality (SAS Institute 1990a) and Levene‘s test for homogeneity of variance (SAS Institute 1996). No indications of violation of model assumptions were found. 4.1.2.1 Analyses with inclusion of covariates Possible relationships between the number of Skylarks, the amount of arthropods, and the density and diversity of weeds were tested using analysis of covariance. Two summary statistics were used as dependent variables (one at a time): the mean number of Skylarks recorded over the whole season and the mean number recorded after 1 July (latemean). The latter statistics was used as a measure of the larks‘ tendency to remain on a field throughout the summer. As a measure of arthropod availability per m2, the mean of the log-transformed dry biomass plot totals was used to indicate arthropod abundance in each plot and year (section 3.1). Only samples from 1 June onwards were used in order to make the data from different years comparable. In addition to the total arthropod biomass, the biomass of a subset of arthropod taxa known to be important Skylark food items was calculated. Six different covariates were used to describe the weed flora within each plot (section 2.1.1): species richness in May and in August (arithmetic mean) and densities of dicotyledonous and monocotyledonous weeds in May and in August (mean of logarithmic densities). Total weed density was not included because it was closely correlated with the density of dicotyledons (r > 0.99). As the analyses of variance of Skylark numbers did not in any case indicate an effect of dosage (section 4.2.1), the simplified model in Table 4.1 was used as a basis for the analyses of covariance. The eight covariates were included in this model, one at a time, and stepwise model reduction was carried out. The inclusion of a covariate×crop×period term in the models allowed the relationship to vary between crops and periods. To protect the experimentwise error rate with eight different covariates being tested, Bonferroni correction of the removal criterion was used (p > 0.05/8 = 0.0063). Data for crop and weed biomasses were only available from 2000 and 2001. Thus, analyses of possible relationships between vegetation biomass and Skylark densities had to be limited to these years, i.e. to the period of organic farming. Biomass was measured in early July for the cereal crop, undersown grasses (if any), undersown clover (if any), dicotyledonous weeds and monocotyledonous weeds (section 2.1.2). Except for the cereal crop, all biomass calculations were based on log-transformed data. A very simple model with crop, year and crop×year (i.e. without a field factor) had to be used as a basis for the analyses because the effects of crop and field were confounded (section 1.6). In the first step, only cereal biomass was added to the basic model as a covariate. For both Skylark variables this clearly improved the model (in terms of a reduction of the model p value) so cereal biomass was retained. Next, seven additional covariates were added, one at a time, to this model: the four vegetation biomass variables mentioned above, a summary variable describing total biomass of weeds and catch crops, and the two arthropod biomass variables. In all cases, a covariate×crop interaction term allowed the relationship to vary between crops. Stepwise model reduction was carried out with Bonferroni correction of the removal criterion (p > 0.05/7 = 0.0071). 4.2 Results4.2.1 Analysis of Skylark numbersPesticide dosage did not significantly affect the distribution of Skylarks. The factor dosage (including the interactions dosage×period, dosage×crop and dosage×crop×period) was eliminated at p > 0.10 in all analyses. Even when data from the conventional period were tested separately, significant dosage effects were not found. The basic model was therefore reduced to the model in Table 4.1. The results of the analysis of variance of each of the three summary statistics describing Skylark occurrence are summarized in Table 4.2.
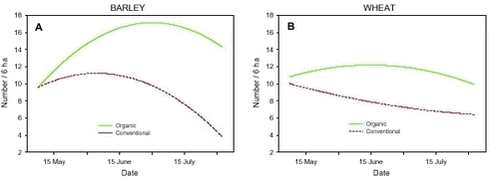
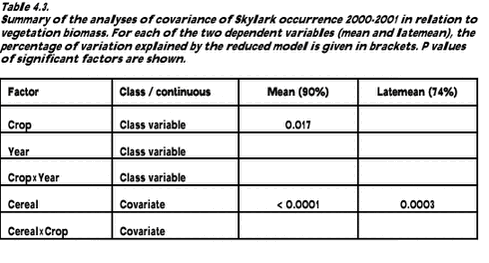
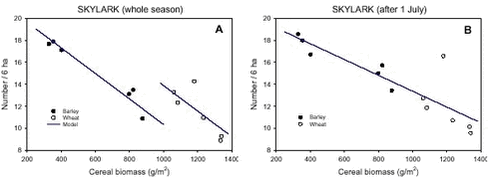
The mean number of Skylarks recorded in the fields differed significantly between the conventional and the organic period. Numbers increased from 8.6 per 6 ha before conversion to 13.3 per 6 ha after conversion. Mean numbers also differed between crops, with 11.6 per 6 ha in barley and 9.3 per 6 ha in wheat. The effects of period and crop on mean numbers were additive as evidenced by the lack of a significant crop×period interaction. A partitioning of the sums of squares showed that 50% of the total variation in mean numbers was explained by differences between periods while 12% was explained by crop differences. Phenology (slope and curvature) also differed between periods and crops (Fig. 4.2). After conversion, Skylark numbers peaked later in the season than before conversion. A major part of the variation in slope (39%) was explained by differences between periods, but the difference was not significant, due to large variation between years (explaining 23% of the total variation). Also the crop×period interaction was significant and explained 12% of the total variation in slope. The difference between periods was significant in barley (p < 0.0001, negative slope before conversion, positive slope after) but not in wheat. The curvature (quadratic term) was only significantly affected by crop which explained 38% of the total variation. There was a strongly negative curvature in barley whereas the curvature in wheat was not significantly different from zero. Fig. 4.2. There were no significant differences in mean, slope or curvature between the three study fields, nor were there any differences between the plots within each field. 4.2.2 Skylark numbers in relation to vegetation and arthropod abundanceAnalyses of covariance of Skylark numbers 1997-2001 in relation to arthropod biomass and to density and diversity of weeds did not reveal any significant relationships. The analyses of Skylark occurrence 2000-2001 showed a significant, negative relationship between cereal biomass and Skylark densities for both mean and latemean (Table 4.3). No other covariates reached the Bonferroni-adjusted level of significance when included in the models.
Considering only counts performed after 1 July, 74% of the variation in Skylark densities between plots could be explained by differences in cereal crop biomass (as calculated from a partitioning of the sums of squares). No other factors had significant effects. Thus, the relationship between crop biomass and Skylark densities was the same for wheat and barley. When counts from the whole season (starting 6 May) were included in the analyses, the relationship was crop-dependent (Fig. 4.3). However, cereal biomass still explained 73% of the variation in mean Skylark densities with only 13% being accounted for by other crop differences. Variation in biomass of catch crops, weeds and arthropods did not affect Skylark densities significantly. Fig. 4.3. Before the inclusion of covariates and the subsequent model reduction, highly significant crop and crop×year terms were present in the models for both dependent variables, explaining between 31% and 54% of the total variation. However, the effect of the crop factor was greatly reduced and the effect of the interaction term almost completely disappeared when cereal biomass was added as a covariate. This indicates that variation in crop biomass explains a large part of the difference in Skylark densities between wheat and barley and most of the variation between years within each crop. Variation between plots within each field could not be included in the model, but Fig. 4.3 suggests that even some of this variation may be due to differences in crop biomass. 4.3 DiscussionFollowing the conversion to organic farming, the number of Skylarks increased significantly in both crops. Averaged over the season Skylark densities were 55% higher after conversion than before, but the exact magnitude of the breeding population increase is unknown. The increase was apparent already in the first year after conversion and must have been caused by local factors, because the Danish breeding population of Skylarks declined by 15% from 1999 to 2001, according to data from the Danish Bird Census Group (E.M. Jacobsen pers. comm.). Comparative studies in organic and conventional farmland have generally revealed significantly higher bird population densities on organic farms. Braae et al. (1988) found that Skylark territory densities in Danish agricultural areas were between 1.5 and 3 times higher on organic farms than on conventional farms. In British studies (Evans et al. 1995, Wilson et al. 1997), 2 to 3 times higher Skylark territory densities were found in organic cereal fields than in conventional ones. All these studies were carried out in areas that had been organically farmed for several years. The present study is the first to show that sizable differences exist already in the first year after conversion. Fig. 4.2 indicates that the number of birds occurring in the study fields in early May was the same before and after conversion. Thereafter numbers in barley rose more quickly and stayed high for a longer period after conversion than before. In organic wheat, numbers increased until mid-June whereas there was a steady decline in numbers throughout the season in conventional wheat. In line with this, Odderskær et al. (1997a) found that Skylarks continued breeding for a longer period in unsprayed fields and that the late breeding attempts here were more successful than in sprayed fields. They suggested that the lower food abundance in sprayed fields led to a poorer body condition of the females, enabling them to carry out fewer successful breeding attempts. Evans et al. (1995) also found fewer Skylark nest failures and higher chick growth rates on their organic farm and ascribed this to a higher availability of food items. In the present study, the biomass of arthropods suitable as Skylark prey increased significantly after conversion in barley, but not in wheat (chapter 3). The later and higher peak in Skylark densities in organic barley fields nicely reflected a similar difference in Skylark prey biomasses (compare Figs. 3.2 A and 4.2 A). However, as such a relationship was not present in wheat, the analyses of covariance did not show any significant correlations between densities of Skylarks and their arthropod food. Other attempts to relate Skylark population parameters to arthropod densities have also been unsuccessful. Benton et al. (2002) found that Skylark population densities in Scotland were high in years where arthropod numbers (measured by tower-mounted suction traps) were low. Odderskær et al. (1997a) were also unable to relate Skylark nestling survival to food abundance (measured by D-vac sampling) in their regression analyses.By contrast, the analyses of covariance revealed a very strong, negative relationship between Skylark densities and cereal crop biomass in both spring barley and winter wheat. When only late-season counts were considered, this relationship alone explained 74% of the total variation in Skylark density between crops, years and plots. Apparently, no previous investigation has related Skylark densities to crop biomass. In many studies, however, Skylark distribution and densities have been analysed in relation to crop height and/or coverage (e.g. Schläpfer 1988, Jenny 1990c, Wilson et al. 1997, Chamberlain et al. 1999, Toepfer & Stubbe 2001). From these studies it may be concluded that a crop height of 15-40 cm and a ground coverage of 35-50% are optimal. Toepfer & Stubbe (2001) noticed that the negative effect of a dense vegetation was sometimes compensated by a low vegetation height (and vice versa) and stressed the necessity of considering the two measures together. Crop biomass combines these two parameters into a single measure and thus meets this request.In a British study, crop height alone explained 67% of the variation in Skylark territory densities (Donald & Vickery 2000). Noticing that data from spring- and autumn-sown cereals fell along the same regression line, Donald & Vickery suggested that the observed differences in Skylark density could be explained entirely in terms of differences in crop height. Using the same argumentation, it may be concluded that differences in crop biomass were the main factor responsible for the differences in Skylark population densities observed in the present study. The underlying mechanism is probably that Skylark locomotion and foraging are severely impeded in a tall and dense crop (Jenny 1990a). Unfortunately, data on crop biomass were not available from the conventional period in this study. Therefore, it could not be directly tested to what extent the higher Skylark densities after conversion might be explained by differences in crop biomass. Using data from several Danish farms, Hald (1999) found mean crop biomasses of 1368 and 1024 g/m2 in conventional and organic cereal fields, respectively; a 25% decrease. This translates to an increase of 2.5 Skylarks per 6 ha in July if Hald‘s values are entered into the analysis-of-covariance model in the present study, corresponding to 53% of the actual difference found. It is not known whether the crop biomasses given by Hald are representative for the situation at Oremandsgård. Average yields in barley and wheat declined by 42-43% after conversion (appendix B), suggesting (but nothing more!) that the decline in crop biomass was at least as great as indicated by Hald‘s average values. Although more than half of the increase in Skylark densities may thus be explained by changes in crop structure (less dense crops after conversion), other factors probably also play a role. A greater abundance, diversity and predictability of the birds‘ arthropod food resource in organic fields than in conventional fields (Hald & Reddersen 1990, Moreby et al. 1994) has traditionally been suggested as a major cause of the differences in bird population densities and breeding success between the two farming systems (e.g. Petersen 1994). In the present study, such a difference in the occurrence of Skylark prey items was found in barley only (cf. chapter 3) and therefore cannot be used as a general explanation of the increase in Skylark density after conversion. Food abundance and food availability are different things, and obviously it is the latter which is important. Providing empirical evidence of this, Odderskær et al. (1997b) found that Skylarks preferred tramlines and unsown patches to the interior of the fields, even if the latter held significantly higher densities of food items. This emphasizes the importance of the crop structure for the distribution of Skylarks (cf. Jenny 1990a,c). However, even after controlling for the effects of crop structure (by including crop biomass as a covariate in the analyses), no correlation between Skylark densities and arthropod biomass was found in the present study. Food quality vs. food abundance is another issue. Because birds usually are incapable of digesting chitin (Bell 1990), insects with a high chitin content (e.g. carabid beetles) have a lower energy content than indicated by their dry mass. Such insects are frequently encountered in Skylark faeces (Elmegaard et al. 1994, Odderskær et al. 1997a, chapter 5 this study) and were therefore included in the group of "important Skylark food items". The generally hard-bodied Carabidae and Staphylinidae made up a much larger share of the estimated biomass of Skylark food items in the study fields before conversion than after conversion (68-70% vs. 20-33%). Therefore, the arthropod biomass values used in the analyses probably did not reflect the true energetic value of the arthropod fauna inside each plot. If this is correct, and the birds try to maximize their energy intake, it is not surprising that the attempts to model Skylark densities as a function of arthropod abundance failed. However, other reasons for this could be that the temporal scale (data averaged over 1-3 months) was not appropriate, or that food was not a limiting factor. A reduction in food abundance may only impact the population of Skylarks significantly under certain weather conditions (C.J. Topping pers. comm.). |
