Dry deposition and spray drift of pesticides to nearby water bodies
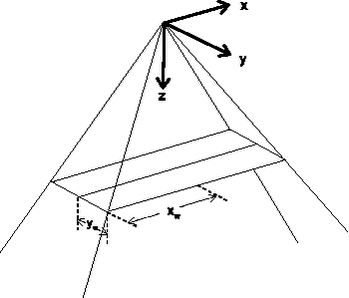
4 Modelling spray drift4.1 Introduction4.2 Size distribution and speed 4.3 Entrainment flow 4.4 Terminal velocity of water drops 4.5 Drop evaporation 4.6 Wind speed above and in crops 4.7 Position and velocity of the drops 4.8 Effect of turbulence 4.9 Empirical model for spray drift 4.1 IntroductionIn the previous chapter the processes have been discussed that influence spray drift. In this chapter mathematical formations are given for the most important spray drift processes. It should be noted, that was is not foreseen to develop such a model within this project. 4.2 Size distribution and speedThe initial size distribution and the speed of the drops have to be measured e.g. by a phase-Doppler particle analyser (Holterman et al., 1997). 4.3 Entrainment flowMomentum of a spray droplet after launching is reduced to air resistance (“drag force”). As there is conservation of momentum, this lost momentum is transferred to the surrounding air thereby setting up a flow of entrained air downward in the same direction as the spray droplet motion. The entrained air stream itself influences the vertical movement of the spray droplets and its velocity should therefore been taken into account when calculating the movement of the droplets. Fig. 24 shows the co-ordinate system that is used in models. The first spray drift models described the movement of droplets in a two-dimensional way: only in the spray fan direction (x) and the vertical direction (z). The sheet thickness of the spray is, however, not indefinitely small, but has a certain thickness in the y-direction due drop trajectories caused by instabilities at the base of the spray sheet (Briffa and Dombrowski, 1966). The vertical air velocity decreases with the distance to the centre of the spray. It decreases also with downward distance. The vertical air velocity decays at a faster rate across the fan thickness (y-direction) than along the spray fan field (x-direction). This will enhance spray drift (Smith and Miller, 1994). For this reason it is better to use three-dimensional models that can take these differences into account. The spray volume patterns along the spray fan axis (x-direction) have been described with Gaussian functions. Such functions have been assumed to be representative of the entrained air field, as momentum is a function of the spray liquid volume flow. The same description can be given for the distribution in the y direction.
Figure 24.Co-ordinate system used in models. The nozzle opening is at the origin. Briffa and Dombrowski (1966) present the following expression for the maximum vertical air velocity located at the centre the spray along the z-axis:
Vz = the centre-line vertical air velocity due to entrainment (m s-1). lc = coherent length of liquid spray sheet (m). The local velocity at position x, y, z can now be determined from (30) and two Gaussian functions that describe the entrained air along the x- and y-axis:
where: σx = standard deviation in the x-direction (dimensionless) Mawer and Miller (1989) measured the spray liquid volume patterns for 110° and 80° nozzles and found the following relationship between height and standard deviation across the fan in the x-direction:
where:
In these equations xw is the spray half width in the x-direction ß is the spray fan half angle in the x-direction. Smith and Miller (1994) found for a flat nozzle with a flow rate of 0.6 l min-1 and a pressure of 3.0 bar:
where:
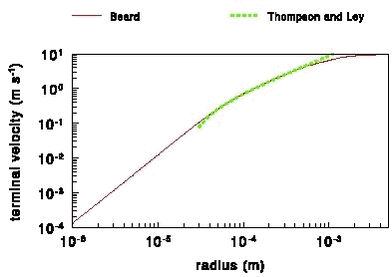
In this equation yw is the spray half width in the y-direction and γ is the spray fan half angle in y-direction. 4.4 Terminal velocity of water dropsMost pesticides are applied as emulsions or suspensions in water at concentrations of 1% and less (Thompson and Ley, 1983). Spray drops that consist of such a diluted solution fall with approximately the same terminal velocity as water drops. It should be noted, however, that the pesticide and any other additives might change the surface tension, which will affect the shape of the falling drops. Water drops brought into the atmosphere by a nozzle will decelerate and they will after a certain distance approach their terminal velocity, i.e. the velocity that they would have if they were falling freely through the atmosphere. The larger the drops, the larger the distance is which they have to travel before they reach their terminal velocity. Beard (1976) modelled the terminal velocity of drops as a function of temperature and pressure for drops with a radius between 2.5× 10⁻⁷ and 3.5× 10⁻³ m. Drops larger than 3.5× 10⁻³ m are not stable and will split up into smaller drops. The maximum difference between the terminal velocity at 30° C and 0° C is 7%. As this difference is relatively small the terminal velocity of e.g. 15° C can be taken for all calculations. The method of Beard (1976) is very general, but is rather complicated. It takes e.g. into account that the shape of larger falling drops is not spherical and that a Cunningham slip correction factor should be applied for drops that are so small that continuum flow cannot any longer be assumed. Moreover, it can calculate the terminal velocity for other pressures than 1 atm. Fig. 25 shows the terminal velocity of water drops as a function of their radius calculated with the model of Beard (1976) for 15° C and 1 atmosphere. The following function was derived for the terminal velocity at at 15° C and 1 atmosphere for the radius range between 1x10⁻⁶ to 3.5x10⁻³ m (maximum error ± 4%):
where: vterm = terminal velocity water drop (m s-1) Thompson and Ley (1983) use the following functions to describe the terminal velocity of water drops in their spray drift model:
The function of Tompson and Ley (1983) is also shown in Fig. 25. It is a reasonable approximation for drops with a radius between 4× 10⁻⁵ to 6× 10⁻⁵ m (for radii less than about 3× 10⁻⁵ m this function gives negative terminal velocities).
Figure 25. Terminal velocity of water drops at 15° C and 1 atmosphere according to Beard (1976) and Thompson and Ley (1983). During the fall of the drops evaporation of water and of pesticide may occur. If all water has been evaporated and no pesticide has been evaporated the radius of the drop is about one-fifth of the original one. In the case that water has been completely evaporated from the drop it gets the same density as the pesticide. Drops with an initial radius greater than about 2× 10⁻⁴ m rarely contribute to drift, because they have such large terminal velocities that they are not deposited outside the field onto which pesticide has been applied (Thompson and Ley, 1983). A drop with a radius of 2× 10⁻⁴ m gets a radius of about 4× 10⁻⁵ m after water has been evaporated. The terminal velocity of such particles can be described by Stokes law, which is valid for spherical particles with a radius between 5× 10⁻⁷ and 5× 10⁻⁵ m (Hinds, 1999):
where: g = gravitation (m s-2) For very small drops (of the order of 1× 10⁻⁶ m) the description with Stokes law is not any longer adequate, because Stokes law assumes continuum flow, which is not the case for these small drops. In this case a “Cunningham” type slip correction factor can be applied to the result of Stokes law. It is important to take the evaporation of water from drops into account because the terminal velocity of the drops depends on the radius. 4.5 Drop evaporationTwo processes play a role in the evaporation of water drops. The first process is the evaporation of water from the drop itself and diffusion of water vapour to the surrounding air. Evaporation depends on the temperature of the drop. For that reason it is necessary to have a description of the second process: the exchange of heat between the drop and the surrounding air. This process in turn depends on the first process, as heat is lost due to the evaporation of water. The following equations assume a steady state situation where water drops fall with their terminal velocity, i.e. they are not accelerated. This assumption is not valid close to the nozzle. The change of the mass of the drop due to evaporation of water can be described by (Pruppacher and Klett, 1997):
where: The change in the temperature of the drop due to evaporation of water vapour from the drop and diffusion of heat to the drop is described by (Pruppacher and Klett, 1997):
where: The first term in (40) reflects the diffusion of heat and the second term reflects the heat used to evaporate water. It should be noted here that many variables in (39) and (40) are a function of temperature and some are a function of pressure as well. Fortunately the problem can be simplified to describe the situation for spray drift. The temperature of the air as well as the relative humidity can be assumed to be constant in this case. Model results show that in this case the temperature of the drops of all sizes approaches after a short time the wet-bulb temperature. In that situation the heat lost by evaporation of water equals the heat gained by diffusion of heat to the drop:
Substituting (39) in this equation gives:
If we examine this equation we can conclude the following (see Appendix F for a parameterisation of the variables):
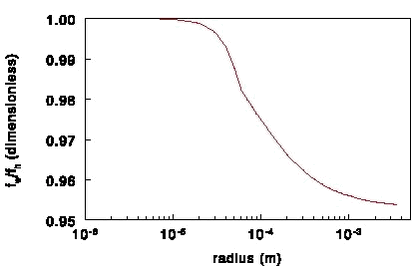
Equation (42) can e.g. be solved with the bisection method (Press et al., 1989). All information on the variables in the equation can be found in Appendix F. It should be mentioned here that the drop temperature is slightly lower than the wet bulb temperature (max. ± 0.5° C difference; Pruppacher and Klett, 1997). Figure 26. The ratio fw/fh as a function of the drop radius at 15° C and 1 atmosphere. The change in the drop radius can be found from (39), taking into account that the mass is (4/3)π r3ρ, where ρ is about constant (1000 kg m-3):
For modelling purposes it can be useful to have an equation that describes the change in drop radius as a function of fall distance zfall. Such an equation can be found from (43) using the relation:
We need now a value for the ventilation coefficient for water vapour fw.
where:
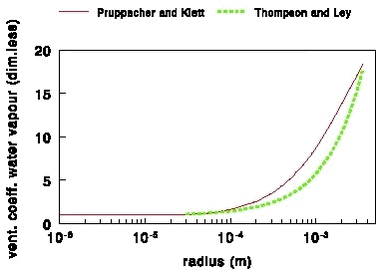
Figure 27. The ventilation coefficient for water vapour as a function to the drop radius according to Pruppacher and Klett (at 10° C) and Thompson and Ley (at 15° C) at 1 atmosphere. The ventilation coefficient for water vapour according to Pruppacher and Klett (1997) was calculated for different temperatures. The values at 30° C appear at maximum to be 8% smaller than at 0° C and for the drops of the size of interest for spray drift (< 2× 10⁻⁴ m) the difference is smaller. This means that one can use the ventilation coefficient for e.g. 10° C for the whole temperature range of interest. A reference temperature of 10° C in this case is chosen because the drop temperature will be somewhat lower than the air temperature (which was taken 15° C in the case of the terminal velocity). The following approximation was found for the ventilation coefficient using the same type of dependence on the Reynolds number as Pruppacher and Klett (1997) using the function for vterm, which was previously derived:
This approximation is accurate within 1% for the radius range from 1× 10⁻⁶ to 3.5× 10⁻³m. Thompson and Ley (1983) use the ventilation coefficient derived by Ranz and Marshall (1952a and 1952b):
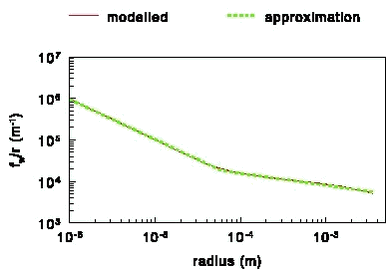
In Fig. 27 this expression is compared with the expressions of Pruppacher and Klett (1997). It can be seen that the ventilation coefficient used by Thompson and Ley (1983) is smaller than that of Pruppacher and Klett (1997). Pruppacher and Klett use some newer information and for that reason their values should be used. The Tompson and Ley ventilation coefficient can only be used for a drop radius larger than about 3× 10⁻⁴ m, because the terminal velocity of the drop can only be calculated for drops of this size (a negative terminal velocity is calculated for drops with a smaller radius). In (43) the only parameters that depend on the radius are fw and r. For that reason it can be useful to have a function for fw/r if (dr/dt) has to be calculated. The following curve fit for was found to give good results:
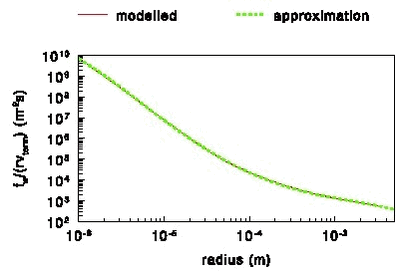
Fig. 28 shows the modelled and approximated values of (fw/r). The maximum error in the approximation is 9% and the error is usually less than 5%. In (45) the only parameters that depend on the radius are fw, vterm and r. For that reason it can be useful to have a function for fw/(rvterm) if (dr/dz) has to be calculated. The following curve fit for was found to give good results:
with x = 10log(r), where r is the radius of the water drop (m). Fig. 29 shows the modelled and approximated values of (fw/(rvterm). The maximum error in the approximation is 9% and the error is usually less than 5%.
Figure 28. fw/r as a function of the drop radius at 15° C and 1 atmosphere.
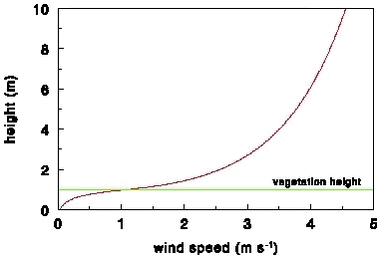
Figure 29. fw/(rvterm) as a function of the drop radius at 15° C and 1 atmosphere. 4.6 Wind speed above and in cropsEquation (3) gives the wind speed as a function of height. If the individual roughness elements on land (plants, trees and houses), however, are packed very closely together, then the top of those elements begins to act like a displaced surface. In that case the wind speed as a function of height under neutral atmospheric conditions has to be modified slightly and is given by:
where:
Figure 30. Wind speed above and in a 1 m high wheat field. 4.7 Position and velocity of the dropsThe position and velocity of the drops relative to the air are found by subsequent integration of Newton’s second law:
where: The position and the speed at time step i+1 can be found from their values at timestep i (Holterman et al, 1997): where:
where: The drag coefficient is described by:
where Re is the Reynolds number and a, b and c are constants with values of 24, 0.32 and 0.52 respectively. The sedimentation velocity vs depends on gravitation and wind velocity:
The first term in (56) describes the vertical settling velocity due to gravitation and the second term describes the wind speed (in both the horizontal and vertical direction). 4.8 Effect of turbulenceIt would be logical to assume that the trajectories of drops can be described by their terminal velocity and the horizontal wind once they have been decelerated from their initial high speeds at the nozzle. This is, however, not completely true, at least not for the smallest droplets. The reason for this is that turbulence causes small up and downward movements. If a drop is subsequently “kicked” upward a few times it is somewhat higher in the atmosphere and can be transported over a somewhat larger distance. Some drops will be exposed to a few subsequent downward “kicks” and will for that reason travel over a shorter distance. The lesson learned from this is that some drops will travel over longer distances than calculated if only taking gravitational settling into account. This effect can be modelled with so-called “random-walk” turbulence models. In random-walk models the displacements of drops are determined in part by a random selection from appropriate Gaussian distributions of turbulent air velocity (Thompson and Ley, 1983). The speed of the drop at time i+1 is related to the speed at time i, but with the addition of a random component due to turbulence and can be described with equations like (56). More elaborate information on this theory can be found in (Tompson, 1984; Tompson, 1987). 4.9 Empirical model for spray driftSarker and Parkin (1995) made an empirical model that predicts spray drift. In stead of describing the processes in detail, wind tunnel measurements of spray drift are used to find an empirical correlation between the most important parameters that influence spray drift. This is achieved by using dimensional analysis. They found the following equation to be valid:
where:
where Q is the discharge (m3 s-1), A is the orifice area (m2), P is the pressure drop across the nozzle and ρ is the fluid density h = nozzle height (m)
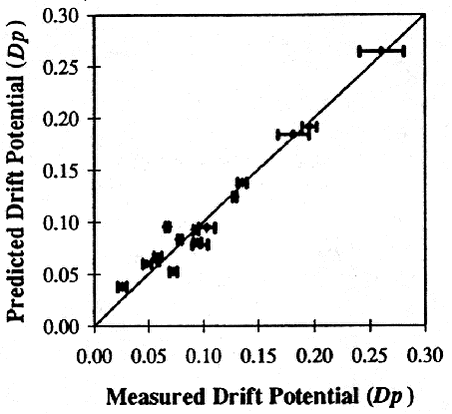
where A is the orifice area (m2). The experiments were made with water plus 0.1% Agral. The orifice area A as well as the pressure drop P had to be determined experimentally as function of the discharge rate Q. Fig. 31 shows the relation between the predicted and measured drift potential.
Figure 31. Predicted vs. measured drift potential with the model of Sarker and Parkin (1995). Reprinted with permission. From Sarker, K.U., Parkin, C.S. (1995) Prediction of spray drift from flat-fan hydraulic nozzles using dimensional analysis. Proceedings of the Brighton Crop Protection Conference – Weeds 1995, 529-534. British Crop Protection Council, Farnham, UK. This model is suited for one type of nozzle. It would be worthwhile to extend the model for other nozzle types and also for higher wind speeds. The input parameter, which is most difficult to measure is A, the orifice area. It can be measured with a microscope fitted with a video camera connected to an image analysis computer. This model predicts an increase of the drift potential by 75% when the wind speed is increase by a factor two. |
