Fate of Pesticides in Surface Waters, Laboraty and Field Experiments
4 Methods and materials, laboratory experiments4.1 Materials4.1.1 14C-labelled pesticides and chemicals 4.1.2 Sediments 4.1.3 Stream water 4.2 Set-up overview 4.3 Experimental procedures 4.3.1 “Kinetic” sorption experiments 4.3.2 “Kinetic” desorption experiments 4.3.3 “Equilibrium” sorption experiments 4.3.4 Degradation experiments 4.3.5 Pesticide solutions used in experiments 4.1 Materials4.1.1 14C-labelled pesticides and chemicals[Benzene(U)-14C]pendimethalin in acetonitrile was obtained free of charge from American Cyanamid. Specific activity was given as 55.42 µCi/mg pendimethalin. Chemical purity > 99% andradiopurity >99.22%. July 1999. Amount supplied was 0.255 mCi in 2.10 mL equivalent to 121 µCi/ml or 2.18 mg/mL. [Benzene(U)-14C]ioxynil was obtained free of charge from Aventis crop science. Specific activity was given as 72.36 µCi/mg ioxynil. Radiopurity >98.5%. May 2000. Amount supplied was 0.28 mCi as 3.8 mg solid. [Diazine-ring-14C]bentazone in acetonitrile was obtained from the Institute of Isotopes, Hungary. Specific activity was given as 0.333 µCi/mg bentazone. Chemical purity > 95% and radiopurity >95%. June 2000. Amount supplied was 0.250 mCi or 750 mg in 2.0 mL. The scintillation liquid, Instagel II plus from Packard bioscience B.V., was used for scintillation. NaN3 and CaCl2*2H2O used were of analytical quality. 4.1.2 SedimentsSediment from five locations: An artificial pond at NERI Roskilde, a small stream in Jutland (Odderbæk), a small stream on Funen (Lillebæk) and four Finnish lakes, were used for sorption experiments. Pond sediment The pond sediment was collected in August 1999 using a metal grab. The top sediment was preferred and the approximate maximum depth, to which the sample was taken, was around 5 cm. At the time of sampling, there was an abundance of plants, e.g. reed mace and submerged weed, in the pond and thus, the sample invariably included some of these macrophytes. At the laboratory, the plants were, however, thoroughly rinsed to keep fine particles in the sample and then removed from the sediment. The sediment was sieved to remove particles, leaves and other material larger than 2 mm.Stream sediments Sediment from Lillebæk stream was collected in August 2000 by metal grab. The appearance of the sediment was soft muddy/slushy with some larger particles. The sediment was received with a dry weight (D.W.) content of 42.7%. The Odderbæk catchment is situated in northern Jutland and is dominated by sandy soils. The stream is about 2-3 metres wide and, in March, it was around 75 cm deep. Sediment from Odderbæk was collected by metal grab in August 2000. The sediment appeared sandy with some mud. The sediment was received with a D.W. content of 34.4%. The sediments were air-dried, sieved to remove particles larger than 2 mm, and stored at 10° C in the dark until use. Lake sediments Measured sediment properties are given in Table 4.1. The organic carbon content of the sediments, foc or OC, was determined as ignition loss and as non-volatile organic carbon (NVOC). pH was measured in sediment-water slurries with a water to sediment ratio of 2.5. N-contents were only measured for the lake sediments, from 63-37 and 37-20 µm fractions (Elemental Analyzer Model 1106, Carlo Erba Strumentazione, Milano, Italy). Table 4.1
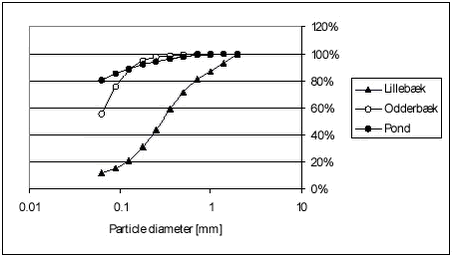
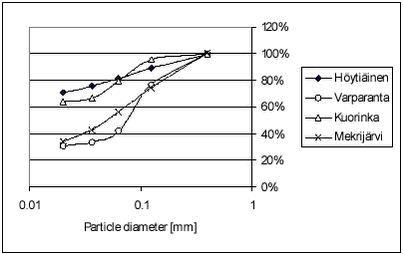
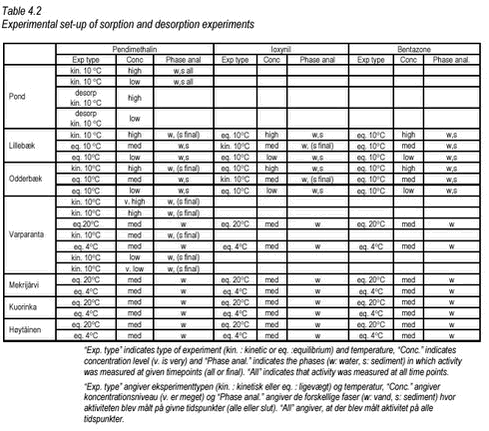
The particle distribution was determined by sieving and weighing. The sediment particle distributions are shown in Figures 4.1-4.2. Raw data are given in Tables B.27-B.28 in Appendix B. Figure 4.1 As Figure 4.1 shows, the Lillebæk sediment has a much more even distribution of particle sizes than the other two sediments, which are composed predominantly of small particles. In the pond sediment, 80% is smaller than 0.063 mm. From Table 4.1, it can be seen that Lillebæk has similar organic matter content as the pond sediment, foc around 3% while Odderbæk sediment has a somewhat higher organic matter content, foc of 10%. foc is the fraction of organic carbon on a weight basis and, when given in %, corresponds to % OC. Figure 4.2 The lakes Hyötiäinen and Kuorinka have a fine particle size distribution while Lake Mekrijärvi is characterized by very high organic carbon content, foc of 24%. Lake Varparanta is a sandy, coarse particulate sediment with very low organic carbon content, foc of 0.5%. 4.1.3 Stream waterFor the degradation experiments, water from Mølleåen was used. Mølleåen is a stream running through Lyngby and Søllerød north of Copenhagen and is the connection between the euthrophic lakes Furesøen, Lyngby sø and the sea. It is a slow flowing stream with high biological activity. The water was taken from a slow flowing part downstream of the lakes, approx. one kilometer from where it falls into the sea. 4.2 Set-up overviewSorption, desorption and degradation experiments were performed. Sorption and desorption were investigated by “kinetic” and “equilibrium” experiments. In the “kinetic” experiments, both kinetics and equilibrium partitioning were investigated while in the “equilibrium” experiments, only the equilibrium distribution was determined. In the degradation experiments, the disappearance from surface water or surfacewater sediment mixtures was investigated. The kinetics of sorption of the two pesticides, pendimethalin and ioxynil, to the pond, Lillebæk, Odderbæk and Vaparanta sediments was investigated. The kinetics of sorption was not investigated for bentazone as sorption of bentazone is very limited and not considered to be important for its fate in streams and ponds. For the Vaparanta sediment, kinetics of sorption were investigated at five pendimethalin concentration levels and for the pond sediment, at two pendimethalin concentration levels. Otherwise, kinetics was studied at one concentration level only. Equilibrium partitioning was determined for all combinations of pesticide and sediment except for pond sediment for which equilibrium partitioning was only determined for pendimethalin. Equilibrium partitioning was determined at different pesticide concentration levels and, for the lake sediments, at two different temperatures, 4° C and 20° C. The kinetics and equilibrium partitioning of desorption was only investigated for pendimethalin and pond sediment. An overview of the sorption and desorption experiments performed is given in Table 4.2.
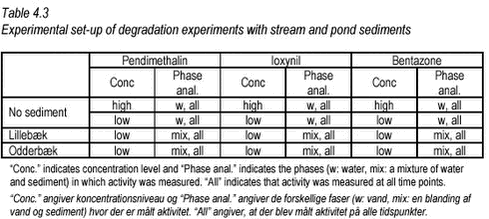
Degradation was studied in surface water (Mølleåen) at two concentration levels and in mixtures of surface water and stream sediment (Lillebæk and Odderbæk) at one concentration level. The degradation experiments performed are listed in Table 4.3.
4.3 Experimental proceduresAll experiments were performed with radiolabelled compounds. 4.3.1 “Kinetic” sorption experimentsAll “kinetic” experiments were conducted as parallel studies with duplicate samples and controls. A large number of microcosms was set up (30-mL pyrex glass tubes with PTFE-lined caps, radiolabelled pesticide, biocide, sediment and water) and terminated individually after equilibration for different periods of time. Controls were similar but without sediment. A sediment to water ratio of 1 g dry weight (air-dried) sediment to 12 mL water was used in all cases. The equilibration was allowed to take place for up to 20 days. After withdrawal, the suspensions were centrifuged at 5400 g, for 2 ~ 30 min. This should sedimentate particles larger than 0.0001 mm. Concentrations were determined in the aqueous phase, and in selected cases (see Table 4.2), in the solid phase by scintillation counting. In the “kinetic” experiments, test tubes were terminated at four individual temination times. At all termination times, sets of two test tubes and two control tubes were removed from the shaking bed together, giving duplicate values for all termination times. Table 4.4
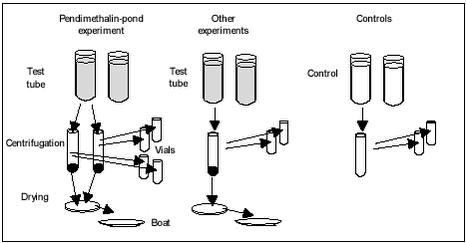
“Kinetic” sorption experiments with pond and stream sediments In these experiments, 8 test tubes and 8 controls, giving duplicates at four termination times, were set up for each combination of sediment and pesticide. Each test tube (microcosm) was prepared by adding 1.0 g of air-dried sediment to a 30-mL round-bottomed glass test tube with PFTE-lined screw cap, adding 4 mL of 30 mM NaN3 solution and shaking for 16 hours at 10° C. This was to pre-wet the sediment and glass surface. After pre-wetting, 8 mL of pesticide solution was added to each tube with a plastic pipette and the shaking was initiated. The tubes were shaken on a shaking table set at 150 rev/min at 10° C in the dark. The control tubes were made in the same way, except that no sediment was added and they were shaken together with the test tubes. In the experiments with pendimethalin and pond sediment, the content of each of the test tubes was transferred to a pair of 7-mL ultracentrifuge tubes, which were centrifuged twice for 30 min at 5400 g and 4° C. Upon completion of the centrifugation, twice 2 mL of the supernatant from each centrifuge tube were transferred to scintillation vials together with 15 mL scintillation liquid and activity was determined using liquid scintillation counting (LSC). For the test tubes in the other sorption experiments and for all controls, only 5-6 mL was transferred from the test or control tube to one ultracentrifuge tube. Otherwise, the procedure was the same (see Figure 4.4).The sediment was isolated in the centrifuge tubes by removing as much of the supernatant as possible with a pipette and evaporating the remainder at 60° C in an oven. This was necessary because the solid phase scintillation counter required absolutely dry samples. The centrifuge tubes were weighed before and after drying and the amount of water evaporated from the centrifugate was calculated and used in correction of solid phase analysis results. The dry weight of the sediment was calculated by subtracting the weight of the empty tube from the weight of the tube containing oven-dried centrifugate. In selected cases (see Table 4.2), the activity in the sediment was determined. This was done by mixing the centrifugates from the pair of centrifuge tubes (originating from the same test tube) thoroughly and withdrawing 0.100 or 0.050 mg to a ceramic sample holder (boat). The boat was placed in an exicator until scintillation counting could be performed. The determination of activity in the dried sediment was made by incineration of the sample in a Carbolite CFM12/1 oven at 600° C, collecting of CO2 and analysing by LSC. In a few cases, the centrifugate from each centrifuge tube was counted individually to determine variability between centrifuge tubes. When calculating Cs, corrections were made for the activity left in the sediment by evaporating residual water, which could not be removed with pipette before drying. In order to determine the sorption to glassware for pendimethalin, all glassware, i.e. microcosm bottles and centrifuge tubes used in the experiment with pond sediment, was washed with acetone. Both micrososm bottles and centrifuge tubes were washed with 2 mL of acetone per glass after the content had been removed. The 2 mL of acetone was added to 15 mL scintillation liquid in a scintillation vial and counted using LSC. Figure 4.4 “Kinetic” sorption experiments with pendimethalin and Vaparanta sediment Amount of stock solution added and nominal total concentration in the test tube is shown in Table 4.5. Table 4.5
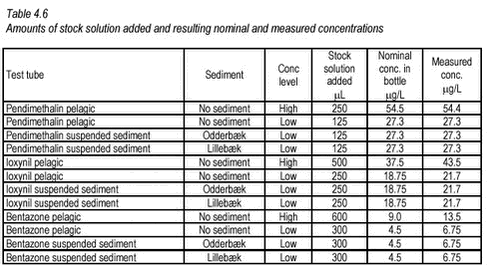
4.3.2 “Kinetic” desorption experimentsInitially, a normal sorption experimentwith pendimethalin and pond sediment was conducted exactly as described in Section 4.3.1 for pond and stream sediments: 8 test tubes and 8 controls for each of two concentrations (a total of 32 tubes) were set up. 1 g of air-dried sediment was added to each test tube. In order to pre-wet the sediment, 4 mL of 0.01-M NaN3 (azide) solution was added and the tubes were shaken for 16 hours. Following the pre-wetting, 8 mL of the relevant pesticide solution was added and the 32 tubes were shaken for 12 days in the dark at 10° C to facilitate sorption. After this period of sorption, the tubes were centrifuged for 21 hours at 870 g. This should sedimentate particles down to 0.0001 mm in diameter. Twice 2-mL samples were withdrawn from the supernatant for determination of activity by LSC and as much as possible of the remaining aqueous phase was removed with a pipette. The amount of residual water was determined by weighing of the test tubes. The desorption experiment was then initiated by adding 10.5 mL of a 0.01-M azide/0.01-M CaCl2 solution to each test tube. The controls were not altered. Again, the tubes were shaken in the dark at 10° C and sets of two replicate test tubes and two controls with high concentration, and two replicate test tubes and two controls with low concentration, were withdrawn at different termination times (1, 3.5, 24 and 240 hours). The content of the withdrawn test tubes were transferred to pairs of centrifuge tubes, which were centrifuged twice at 5400 g at 4° C for 30 min with which particles larger than 0.0001 mm should sedimentate. One 2-mL sample from each supernatant was transferred to a vial with 15 mL of scintillation liquid and counted using LSC. The centrifugate was dried at 60° C in the centrifuge tubes. The dry centrifugate was mixed and a sample of approx. 0.100 mg was transferred to a ceramic sample holder (boat) and left in an exicator until activity could be determined. Activity was determined by incineration at 600° C, collection of CO2 and scintillation counting (see above description). The controls were not centrifugated but two samples of 2 mL from each were withdrawn for determination of activity. 4.3.3 “Equilibrium” sorption experiments“Equilibrium” experiments with pond and stream sediments These “equilibrium” experiments were conducted in the same way as the “kinetic” experiments, the only difference being that all samples were terminated at the same time after a 195-hour period of shaking. From the results of the kinetic studies, this period was considered sufficient for equilibration. The concentrations were determined in both phases in these experiments. pH was measured in the supernatant after centrifugation. “Equilibrium” experiments with lake sediments at different temperatures “Equilibrium” experiments with lake sediments were performed similar to the other “equilibrium” experiments except that PFTE centrifuge tubes were used and that, for each sediment-pesticide combination, two sets of duplicates were set up and shaken at different temperatures. Each test tube (microcosm) was prepared by adding 1.0 g of air-dried sediment to a 30-mL round-bottomed PFTE test tubes with screw caps, adding 4 mL of 30-mM NaN3 solution and shaking for 16 hours at 10° C. This was to pre-wet the sediment and inner tube surface. After pre-wetting, 8 mL of pesticide solution was added to each tube with a plastic pipette and the shaking was initiated. Two sets of triplicate control tubes were made in the same way, except that no sediment was added. One set of duplicate test tubes and triplicate controls was shaken on a shaking table at 4° C, in the dark, while another set of test tubes and controls was shaken at 20° C in daylight. After termination at 195 hours, the test tubes were centrifuged for 24 hours at 5000 g. 2 mL of the supernatant was added to 15 mL of scintillation liquid and the activity was determined by LSC. pH was measured in the supernatant. 4.3.4 Degradation experimentsFor each pesticide, four types of microcosms were set up in sets of triplicates. Two “pelagic” microcosm sets with stream water and pesticide in different concentrations (low and high) and two “suspension” microcosm sets with the same pesticide concentration (low) but with different sediments (Odderbæk and Lillebæk)(see Table 4.3.). Additionally, one set of four “pelagic” controls with water, biocide and pesticide at low concentration and one recovery set of three pelagic low pesticide concentration bottles were set up. The bioside was added to controls to inhibit biotic degradation. The recovery set was to be used for determination of recovery. Each microcosm was prepared by adding stock solution according to Table 4.6 to the bottom of a 300-mL serum glass bottle (with PFTE-lined cap) and letting the solvent evaporate. After evaporation, 100 mL of stream water was added and, for the suspension microcosms, additionally 100 mg D.W. of stream sediment was added. For the “pelagic” controls, water composed of 20 mL of 1 M NaN3 in 2000 mL of stream water yielding 10 mM NaN3 was used. The microcosms were shaken at room temperature (22-25° C) in the dark and samples of 5 mL suspension/water were withdrawn from each test bottle after 1 hour and then every five days. When sampling was performed, the bottles were opened and headspace was passively renewed. In order to get a representative sample from the bottles with suspension, these were shaken well before a sample was withdrawn. Samples were taken from control bottles and recovery bottles after 1 hour and after 103 days. These bottles were kept closed for the duration of the incubation. In order to remove dissolved radiolabelled CO2 before LSC, 2 mL of concentrated HCL was added to the withdrawn samples and the mixture was shaken over night. The effectiveness of the stripping was investigated by shaking for 6 hours more and comparing scintillation counts. After stripping, 2 mL of the sample was added to a scintillation vial with 15 mL of scintillation liquid and activity was determined using LSC. The experiment was finalised by weighing the water/suspension left in the test bottles after the final subsample withdrawal. In the recovery bottles, pH was lowered to 2 by adding HCL, and CO2 was collected by leading N2 through the bottle and through an external absorber of 10 mL 1 N NaOH. The activity collected in the absorber was determined by counting a 2-mL subsample using LSC. The residual activity in the recovery bottles was determined from 5-mL subsamples and the residual amount determined by weighing. The activity in the controls was determined in the same way as for the test bottles, by withdrawing and analysing a 5-mL subsample and weighing the residual content. The amount of stock solution added to the bottles in the degradation experiment and the resulting concentrations are shown in Table 4.6.
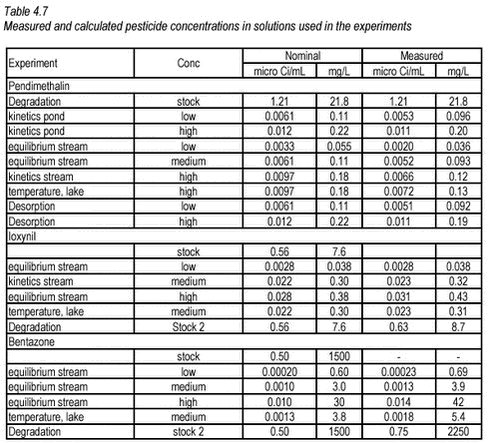
4.3.5 Pesticide solutions used in experimentsFor the experiments, a large number of 14C pesticide solutions were made. Detailed information on the preparation of these solutions is given in Appendix A. In all aqueous solutions, concentration was kept below half of the saturation concentration. In Table 4.7 below, an overview of the pesticide concentration in the solutions used in the experiments is shown. Before use, the activity of each solution was measured and both nominal and measured concentrations are given.
|
||||||||||||||||||||||||||||||||||||||||||||||||||||||||||||||||||||||||||||||||||
