Fate of Pesticides in Surface Waters, Laboraty and Field Experiments
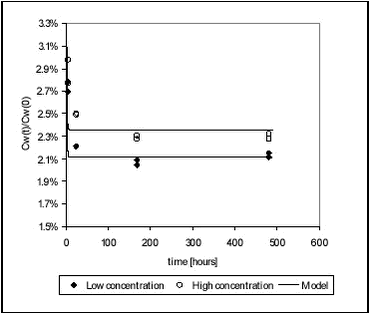
5 Results and discussion, laboratory experiments5.1 “Kinetic” sorption experiments5.1.1 Pendimethalin and pond sediment 5.1.2 Pendimethalin and stream sediments 5.1.3 Kinetic sorption to Lake Vaparanta sediment 5.1.4 Ioxynil and stream sediments 5.1.5 Fitting of model to experimental sorption data 5.2 Desorption experiments 5.3 “Equilibrium” sorption experiments 5.4 Relationship between Kd and sorption rate constants 5.5 Recovery and accuracy of sorption and desorption experiments 5.6 Degradation experiments 5.6.1 Fitting of model to degradation data 5.6.2 Fitting of model to pendimethalin degradation data 5.6.3 Fitting of model to ioxynil degradation data 5.7 Particle concentration and biodegradation 5.7.1 Model set-up The results of the sorption experiments are shown with raw data in Tables B.1-18 in Appendix B. 5.1 “Kinetic” sorption experimentsThe kinetics of sorption of pendimethalin and ioxynil to pond sediment, two stream sediments and Lake Vaparanta sediment was studied. 5.1.1 Pendimethalin and pond sedimentThe kinetics of sorption of pendimethalin, at two concentrations, to pond sediment was investigated and the measured pesticide concentrations in the water phase, at 3, 24, 168 and 480 hours, are shown in Figure 5.1. The raw data are given in Tables B.3 and B.5 in Appendix B. The pesticide concentrations in the water phase were reduced to around 2-3% of the initial value within three hours showing rapid sorption. This is a reduction from 101 to 2.7 µg/L (high concentration) and from 50 to 1.3 µg/L (low concentration). The equilibrium Kd values are given in Table 5.4. For high and low concentration controls, the deviation between replicates was less than 8.5% and 3.2% in average.
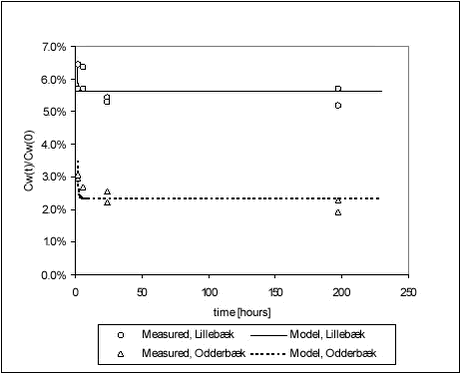
Figures 5.1 5.1.2 Pendimethalin and stream sedimentsKinetics of sorption of pendimethalin to stream sediments was investigated at one pesticide concentration (high). Measured pesticide concentrations in the water phase, at 3, 24, 168 and 480 hours, are shown in Figure 5.2. Raw data are given in Tables B.5-B.6 in Appendix B. Also in this case, pendimethalin sorbed rapidly. Pesticide concentrations in the water phase were reduced to 2-3% of initial value within 3 hours for the Odderbæk sediment and to 5-6% of initial value for the Lillebæk sediment. This is a reduction in aqueous concentrations from 71 µg/L to 4.1 µg/L and 2.1 µg/L for Lillebæk and Odderbæk, respectively. It is obvious that pendimethalin sorbs more strongly to the Odderbæk sediment than to the Lillebæk sediment. The equilibrium Kd values are given in Table 5.4.
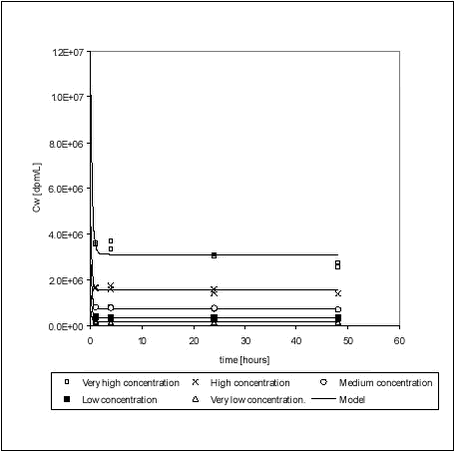
Figure 5.2 5.1.3 Kinetic sorption to Lake Vaparanta sedimentAn experiment was performed to evaluate the sorption kinetics at different concentration levels. Kinetics of the sorption of pendimethalin to Lake Vaparanta sediment were investigated at 5 pesticide concentrations (very low, low, medium, high and very high) with the highest concentration being 20 times higher than the lowest. Measured pesticide concentrations in the water phase, at 1, 4, 24 and 48 hours, are shown in Figure 5.3. The raw data are given in Tables B.9-B.13 in Appendix B. The equilibrium Kd values are given in Table 5.4. Sorption seems to be fast at all concentrations with no discernible difference in sorption rates. It can be noted that there seemed to be a slight continuous decline in aqueous concentration, for the “med”, “high” and “very high” concentrations, even at 48 h when the experiment was terminated. The reason for such a decline could be intraparticle diffusion: After an initial sorption to available surfaces, the pesticide starts to diffuse slowly into the particles making room for additional sorption. However, the results from the other sorption studies, which were continued for a much longer period, did not in general indicate a second phase of slow sorption and no attempts were made to investigate this further. The decline is small and thus at least not important for the streams, in which retention time is short.
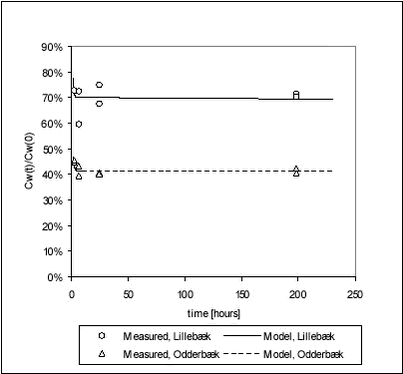
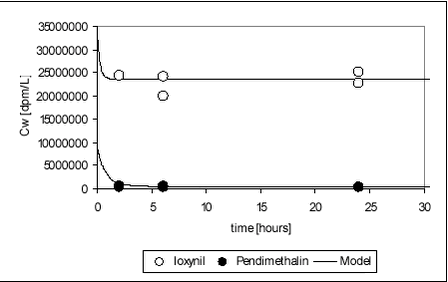
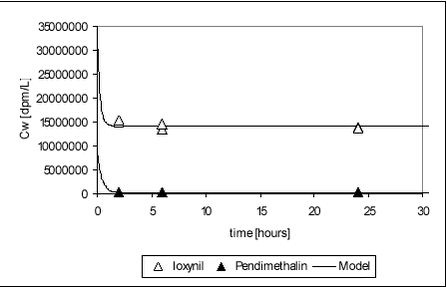
Figure 5.3 5.1.4 Ioxynil and stream sedimentsIn the kinetic experiment with ioxynil sorption to stream sediments, Cs was measured at all termination times: 2, 6, 24 and 198 hours. The sorption of ioxynil to the Odderbæk and Lillebæk sediments, at one concentration (medium), was investigated. Ioxynil did not sorb as much as pendimethalin but the sorption was rapid, with a reduction in ioxynil aqueous concentration to 70% and 40% of initial values, within two hours, for Lillebæk and Odderbæk, respectively. This was a reduction from 210 µg/L to 150 µg/L and 90 µg/L, for Lillebæk and Odderbæk, respectively. The results are presented in Figure 5.4. Kd values are given in Table 5.4. The results indicate that the same kinetic sorption parameters can be used more or less regardless of pesticide concentration. This is in correspondance with the sorption model used, see Section 5.1.5.
Figure 5.4 5.1.5 Fitting of model to experimental sorption dataMany attempts to model the sorption/desorption kinetics have been described in literature. Often, the sorption process is observed to be biphasic: A rapid first phase accounting for 20-50% of the total sorption followed by a slower sorption, and the slower part of the sorption is often explained by diffusion of the solutes into the particles. The first phase is primarily considered to be a sorption process to the surface of the particles. In the majority of studies reported in literature, focus has been on the slower part of the sorption process, which is relevant when the contact time between sediment and chemical is long. Here, however, the first process has been focussed as the residence time is quite low in the flowing water systems considered. It is assumed that the fast initial sorption can be regarded as a second order process according to: Solute + Sorbent <--> Solute-Sorbent If the kinetics are assumed to be linear, adsorption and desorption of solute on solids are expressed by the two-rate model (Thomann et al., 1987; Nyffeler et al., 1984) given by the differential equations:
Equation 1 where Cw [mass/volume] is concentration of pesticide in water, This sorption and desorption model is employed in the stream fate model incorporated in the registration model. In order to fit this model to the experimental data and derive estimates of ksorp and kdesorp, the differential equations have been solved algebraically (see Appendix G) yielding the expression:
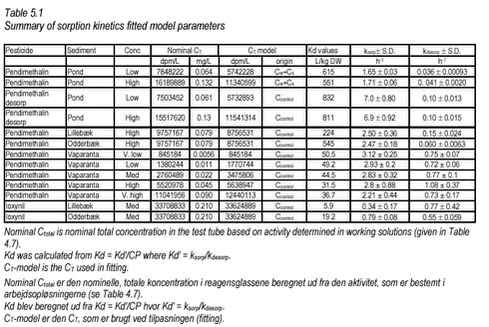
where CT [mass/volume] is total concentration. Using this expression, the model has been fitted to the data from the “kinetic” sorption experiments with non-linear least squares regression and the results are shown on Figures 5.1-5.4. Equal variation around the curve was assumed in all cases. The pesticide concentration in water Cw is measured in the experiments as dpm/L while CT is derived from Ccontrol or, in the case of pond sediment, from an average of measured Cs and Cw, for all termination times, CT = Cw+Cs. In the latter case, Cs[dpm/L water] was calculated as Cs[dpm/kg sed D.W.] The fitted values of ksorp and kdesorp together with standard deviations are given in Table 5.1.
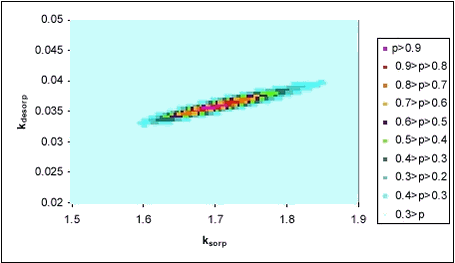
It must be noted that, in all cases, sorption was very fast and that the experimental procedure did not allow measurements with very short intervals. The fitted rates reflect this and they may be underestimations of the actual rate but hardly overestimations. However, the shaking of pesticide, water and sediment is of course an ideal situation, in which optimal conditions for sorption is created, and sorption rates in systems, in which diffusion is important can be expected to be smaller. This would for example be the case in pond sediment, and here diffusion is taken into account in the model. From Table 5.1, it can be seen that fitted sorption rates for pendimethalin are between 1.65 and 3.12 h-1 while desorption rates are between 0.03 and 0.88 h-1. The fitted sorption rate from the desorption experiment with pendimethalin is higher than that determined from the sorption experiment with the same pesticide and concentration. Fitted sorption rates for ioxynil are slightly lower than for pendimethalin while fitted desorption rates are larger, corresponding to the lesser sorption tendency. Besides the fitting with least squares regression, another approach has been taken. For a large number of combinations of ksorp and kdesorp (around the values giving the least sum of squares), the likelihood of model-Cws belonging to a normal distribution around measured values, has been calculated. In this case, the different variations at different time points were taken into consideration. The results, shown as contour plots, confirm the values determined by sum of squares minimization given in Table 5.1. An example of such a contour plot is given in Figure 5.5.
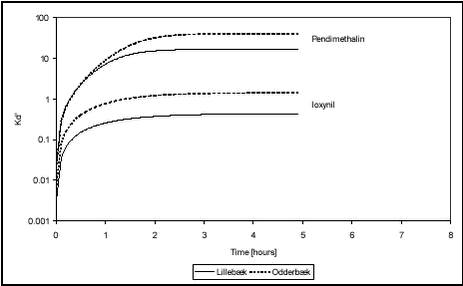
Figure 5.5 In order to give an idea of the time scale of sorption, a collection of fitted models are shown together in Figure 5.6 below.
Figure 5.6 From Figure 5.6, it can be seen that the sorption of pendimethalin and ioxynil to the Odderbæk sediment was slightly stronger than to the Lillebæk sediment and that pendimethalin sorbed quite a lot more strongly than ioxynil.In general, the sorption to pond, stream and lake sediments in the laboratory experiments was rather fast. The fitted model predicted that Cw(t) = ß Cw(∞ ) would be reached within the time t given by
Equation 2 Applying this expression for different ß s and with fitted model parameters gave the results shown in Table 5.2. Table 5.2
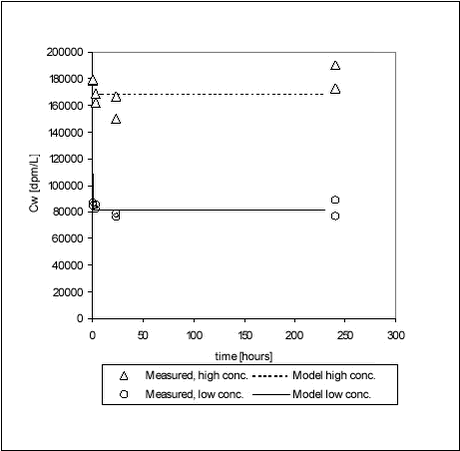
From Table 5.2, it can be seen that for pendimethalin shaken with pond sediment, the pesticide concentration in the water is twice the equilibrium concentration after two hours. After 5 hours, the pesticide concentration in the water is only 1% higher than at equilibrium. The sorption to stream sediment was slightly faster with the pesticide concentration reaching within 1% of the equilibrium concentration in three hours. For ioxynil, the sorption to stream sediments is slightly slower. No literature data on the kinetics of sorption of these pesticides have been found for comparison. 5.2 Desorption experimentsFrom the analysis of the supernatants removed after sorption for 12 days, average partition coefficients could be calculated assuming that Cs = CT – Cw where CT is nominal total concentration. For the low concentration, the partition coefficient was Kd = 985 ± 21 and, for the high concentration, it was Kd = 912 ± 62. This is comparable to the Kds determined in the sorption studies (low conc. Kd = 615 and high conc. Kd = 551) although slightly higher due to the use of nominal total concentrations. After replacement of the aqueous phase and desorption, Cw and Cs were measured at the times: 1, 3.5, 24 and 240 hours. These values are given in Tables B.14-B.15 in Appendix B and the measured values of Cw are shown in Figure 5.7.
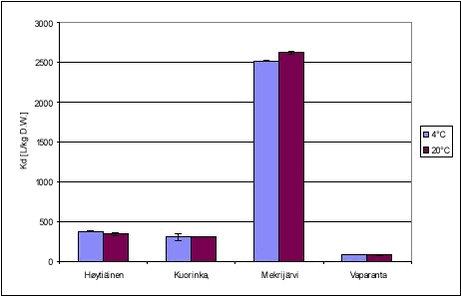
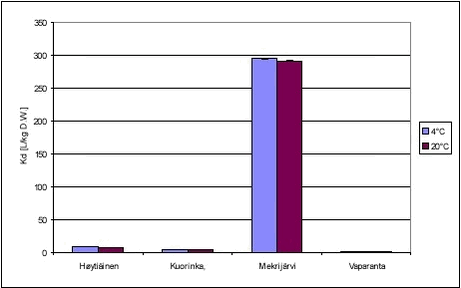
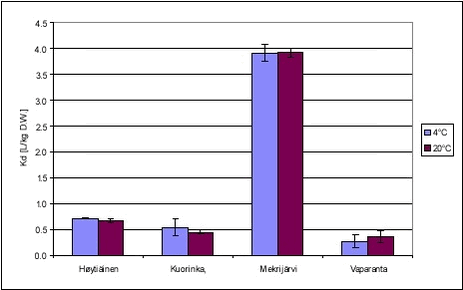
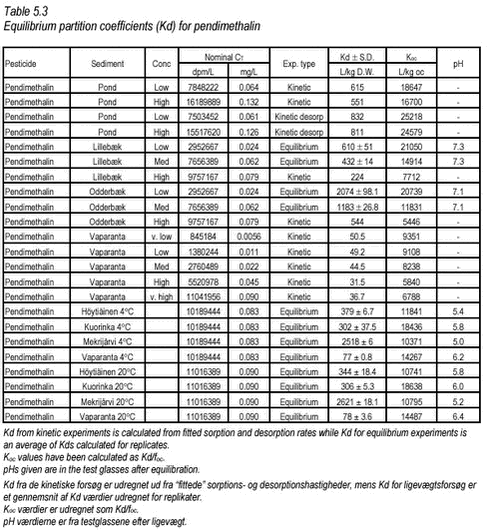
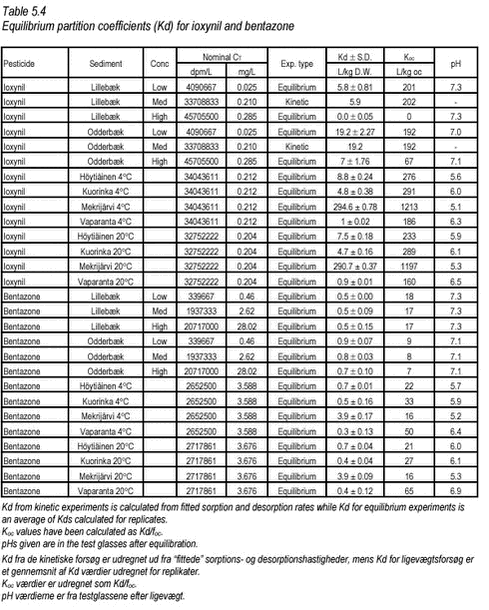
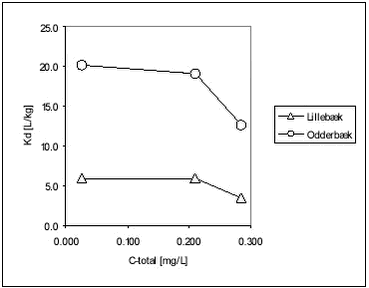
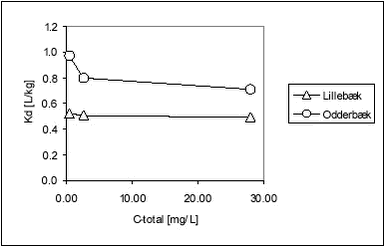
Figure 5.7 The desorption experiment shows that, after 12 days of sorption, desorption is fast. The new equilibrium created by desorption was close to equilibrium after sorption with similar, slightly higher, Kd values. The kinetic parameters determined for desorption are quite different from the parameters determined for sorption, with both ksorp and kdesorp being larger for desorption indicating faster rates of desorption than of sorption. Fitted values of ksorp and kdesorp are given in Table 5.1. The results from the desorption parameters confirm the assumption that sorption is reversible, even after a long period of sorption. Although this is only shown for one pesticide, it is expected to be the case for most pesticides in streams when the pesticide enters the stream within a short timeframe, as after e.g. a spraying. Here, after an initial increase in the pesticide water concentration and sorption, the pesticide water concentration will soon decrease causing a desorption a short time after the sorption took place. 5.3 “Equilibrium” sorption experimentsA large number of “equilibrium” experiments were performed. The majority, performed at 10° C, were made at varying concentrations in order to investigate sorption linearity while the rest, performed at 4° C and 20° C, were made in order to investigate the influence of the temperature on equilibrium partitioning. The raw data from the equilibrium experiments are given in Tables B.16-B.24 in Appendix B. In these experiments, Cs was measured in all cases except for the lake sediments. However, when measured, the values were often unrealistically high, presumably due to the analysis of un-representative subsamples. In these cases, the measured solid phase concentrations were disregarded and values calculated from the difference between aqueous concentration in the controls and in the microcosms were used instead. The calculated Kd values are given in Tables 5.3-5.4 together with Kd values derived from the “kinetic” experiments. The difference in equilibrium partitioning of pendimethalin, ioxynil and bentazone between lake sediment and water is shown in Figures 5.8-5.10. It seems that there is no particular difference between Kd values determined at 4° C and at 20° C.
Figure 5.8
Figure 5.9
Figure 5.10 In Tables 5.3-5.4, all determined Kd values have been shown together. The partition coefficients given for the kinetic experiments are calculated from Kd‘ = ksorp/kdesorp and Kd = Kd‘/CP while partition coefficients given for the equilibrium experiments are calculated from an average of measured Cw and C-control. pH in the controls were similar, i.e. 6.9-7.1 for all three pesticides. This is close to the pH of 7.18-7.85 measured in sediment slurries without pesticide, azide and CaCl2 and thus indicates that no change in pH was caused by the pesticides themselves in these experiments. The pH of the experiments can thus be considered realistic.
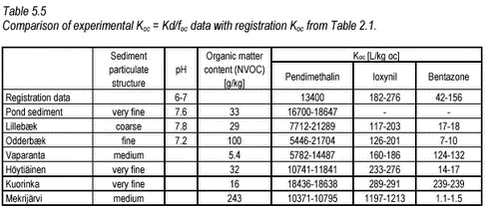
The partition coefficients determined are in accordance with the expectations based on the octanol-water partition coefficients and the organic content of the sediment. The sorption to the Mekrijärvi sediment gave the highest Kd values, followed by the Odderbæk sediment. Kd values for the Lillebæk and pond sediments were comparable. It should be noted that the weak sorption of bentazon only causes minor reductions in aqueous phase concentration and thus the determination of sorption coefficients for bentazon is uncertain. The data generated in this study have been compared with Koc data from registration material in Table 5.5, and it can be seen that the Koc values generated in this study are in good accordance with these values. The literature Koc values in  the registration data were not reported with concentration levels and, consequently, a direct comparison is difficult. the registration data were not reported with concentration levels and, consequently, a direct comparison is difficult.
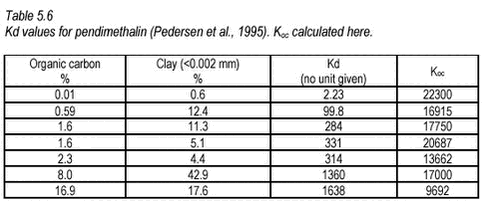
In general, it seems that Koc is slightly higher for the very finest sediment, which could be due to an increase in the fine particle inorganic sorption capacity but it is not a clear trend when all sediments are considered. Kd values for pendimethalin in seven different soils have been determined at one concentration (initial water concentration 0.15 mg/L, CP=0.2 kg/L) by Pedersen et al. (1995) using OECD guideline 106.
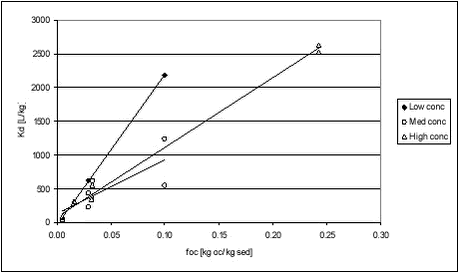
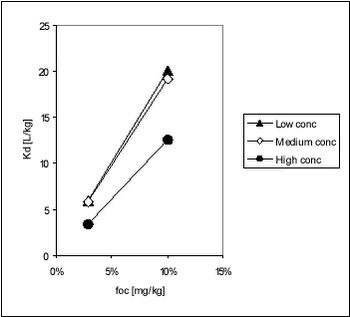
For soil, these values are quite similar to those obtained in this study for stream, pond and lake sediments (see Table 5.5). Both experiments show that not only organic material, measured as organic carbon, determines sorption of pendimethalin. Especially at very low organic matter concentrations, sorption to inorganic particles may become more important, causing a faulty increase in Koc when calculated from Kd. The relationship between Kd and organic matter content in the sediment for pendimethalin has been illustrated in Figure 5.11. Here, data have been grouped according to pesticide concentration level but with some variation in concentration within each group. This variation is clearly important as it causes considerable scatter.
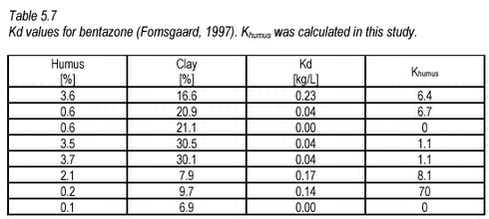
Figure 5.11 It is obvious that the relationships between foc and Kd are different for different concentration levels. Fomsgaard has reported Kd values for the sorption of bentazone to different European soils determined by OECD guideline 106, which is similar to the approach used here. CP=0.2 kg/L, initial pesticide concentration 5 µg/g soil D.W. or 1 mg/L (Fomsgaard, 1997).
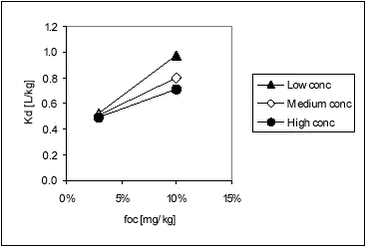
These results reported for soils are similar to the ones determined in this study, for stream, pond and lake sediments. The variation of Kd with Koc for ioxynil and bentazone is showed in Figures 5.12-5.13.
Figure 5.12
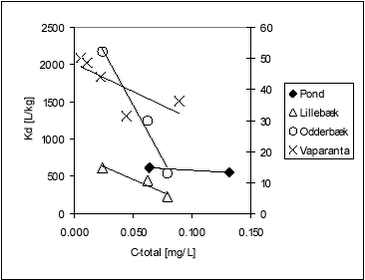
Figure 5.13 Figure 5.13 Relationship between Kd and organic carbon content (foc) for bentazone Romero et al. have found a good relationship between organic matter content and Kd (equilibrium concentration 200 mg/L) for bentazone (r=0.88) for nine Spanish soils (Romero et al., 1996). It is obvious that, for all three pesticides, there is a positive correlation between foc and Kd, although determined Kds of bentazon are uncertain, but also that the relationship is different at different pesticide concentrations. This seems to be due to non-linearity of Kd. If equilibrium partition coefficients are considered at different total concentrations of pesticide, it can be seen that the sorption to stream sediment was non-linear forpendimethalin. For ioxynil and bentazone, the sorption was weak and there is some indication of non-linearity, but again, for bentazone the uncertainty of sorption coefficients makes accurate conclusions difficult for this pesticide.
Figure 5.14
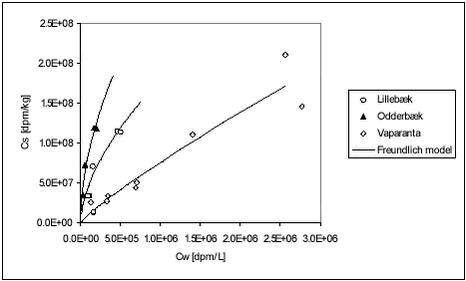
Figure 5.15 Figure 5.16 Romero et al. have demonstrated non-linear Freundlich relationships for bentazone for 8 out of 10 Spanish soils (Romero et al., 1996). If a Freundlich isoterm expression (Cs = Kdf Table 5.8
As it can be seen, the standard deviation on predicted Kdf is quite large (96-138%) while it is relatively smaller on n (15-19%). The n < 1 case, as observed here, is usually explained by limited availability of sorption sites on the sediment. As pesticide concentration increases, it becomes increasingly rare that the pesticide comes in contact with a vacant sorption site and thus partitioning into sediment is diminished. Non-linearity is normally not caused by the sorption to organic bulk material but rather to surfaces (Schwarzenbach et al., 1993). The fitted Freundlich model is shown together with measured data in Figure 5.17 below. Figure 5.17 Freundlich isotherms do not describe the non-linearity of Kd observed in these experiments very well as shown by the large uncertainty on the fitted parameters. It should be noted that extrapolation of a Freundlich isotherm to very low pesticide concentrations may be problematic (Styczen et al., 2002a). Here, the Freundlich expression has only been fitted to pendimethalin data and these are on quite low concentrations. For the two ionizable pesticides, bentazone and ioxynil, a correction for the influence of pH on Kd was calculated as shown in Appendix F. The calculations show that the effective Kd will change drastically at low pH while at pH above 7, it is more or less independent of pH. This means that an increase in pH as may be caused by photosynthesis will have no effect on the partitioning of these pesticides. A decrease below pH of 6 will, however, lead to a stronger sorption. An increase of up to 700 to 900 times of the sorption can be expected in extreme cases. 5.4 Relationship between Kd and sorption rate constantsFrom the results generated here, it seems that sorption rate constants are necessary in the description of pesticide fate in streams. For small streams, as those used in the scenarios of the registration model, the retention time can be as low as 1 hour and sorption can take 6 hours to reach equilibrium. However, sorption rate constants are usually not available to the Danish EPA. It has thus been investigated whether predetermined universal sorption rate constants could be used with desorption rates determined from Kd of the pesticide in question. In shaking sorption experiments, the sorption is not believed to be limited by diffusion as optimal contact between pesticide and sorbent is ensured by shaking. The probability of a pesticide molecule reaching a sorption site on sediment within a given time could thus be expected to depend mainly on the sediment concentration and on the initial pesticide concentration (total concentration). The attractions between pesticide and sediment and the hydrophobicity of the pesticide are not expected to be important for the sorption rate as they only work at short distances and as formation of complexes is fast. The desorption rate on the other hand could be expected to be rather independent of sediment concentration while hydrophobicity and attractions (Kd) are important factors. If this conceptual model is accepted, it may be reasonable to determine a common sorption rate constant for pesticides, at a given particle concentration, and to let the desorption rate constant depend on Kd by the relationship stated in Appendix G. In order to test this approach and to determine a common sorption rate constant, analytical expressions for Cw were fitted to pendimethalin and ioxynil sorption data together. Two identical analytical expressions for Cw were set with up, one for pendimethalin and one for ioxynil, with different kdesorp but same ksorp. The sum of squared differences between model and data for all datapoints (both pendimethalin and ioxynil) were then minimised by adjusting ksorp and kdesorp- pendimethalin and kdesorp-ioxynil. The data, to which the analytical expressions were fitted, were the data on the sorption to the stream sediments, Lillebæk and Odderbæk (Tables B.5-B.8). In these experiments, the nominal start concentrations were 4.23 The fitting was thus made in such a way that the slowest possible kinetics fitting the data was manually chosen. The resulting parameters are shown in Table 5.9. Table 5.9
In Figures 5.18-5.19, the fitting shows that it was possible to obtain a reasonable fit to these experimental data on two pesticides with a common sorption rate and individual desorption rates.
Figure 5.18
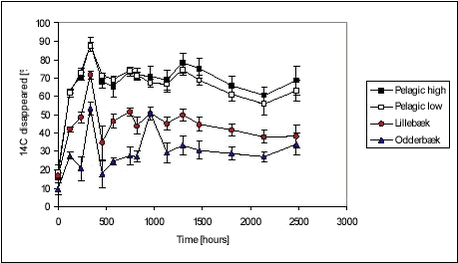
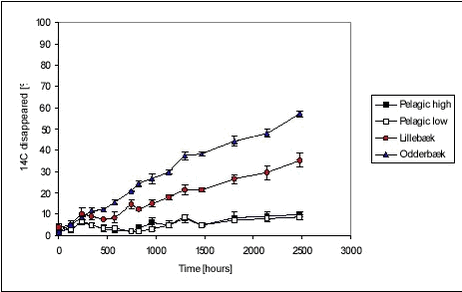
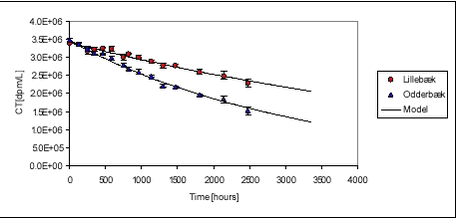
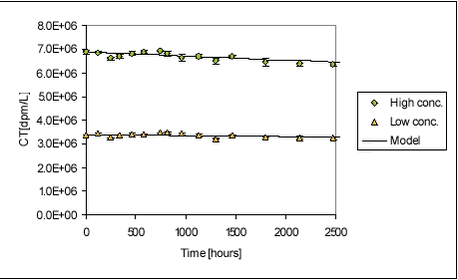
Figure 5.19 The variation between the individually determined sorption parameters was not large either. Ramos et al. (2000) have found sorption rate constants for four different pesticides (atrazin, chlorpyrifos, bromophos-ethyl, diazinon) of 12.7, 4.0, 5.0 and 14.8 hr-1, respectively, at a suspended matter concentration of 0.0068 kg/L. These four sorption rates are quite similar even though the more hydrophobic pesticides have a sligthly lower sorption rate than the more hydrophillic. It should, however, be noted that the sorption rates presented by Ramos et al. are slightly higher than the sorption rates determined in the present study. Even though the assumption of a uniform sorption rate is crude and the data available for evaluation is scarce, it is considered a reasonable way of making a rough estimate of the sorption rate constant. It would be preferable to have more kinetic data on the fast sorption in order to make a better estimate of the common sorption rate constant. 5.5 Recovery and accuracy of sorption and desorption experimentsFor the experiment with sorption of pendimethalin to pond sediment, detailed mass balances based on radioactivity were made. After emptying of test tubes and centrifuge tubes, these were washed in 2 mL of acetone and the activity was determined using LSC. The results are presented in Tables B.2 and B.4 in Appendix B. The total activity measured (sum of activity in sediment, water and on glass surfaces) was compared to both a theoretical total, calculated from added activity, and to the activity in the relevant controls. The radioactive residue on test tubes and centrifuge tubes was in average only 0.06% and 0.04% of the total activity, respectively. The highest amount found by washing test and centrifuge tubes with acetone was 0.20% of the total radioactivity. The residue on glassware did thus not contribute significantly to the mass balance. This is confirmed by experiments with sorption of pendimethalin to new and worn glass surfaces (see Appendix C). By applying the results in a three-compartment model (see Appendix G.2), it can be calculated that 0.4% of the total amount of pendimethalin, in experiments with pond sediment, would be found on the glassware. The variability in the measured Cw, Cs and calculated Kd is due to natural variation, especially in sediment composition, and due to errors introduced in the experimental and analytical procedures. The variability between measured Cws and Css from replicate test tubes are given in Table B.25 in Appendix B. The variability in Cw includes the variability arising from sediment composition differences between test tubes and errors arising from centrifugation, transfer of samples and analysis. As it can be seen from Table B.25, the standard deviation between Cws from replicate test tubes is, however, relatively small, less than 10% and 3% in average. This is comparable to the variability between controls, which was less than 13% and also 3% in average. This suggests that the variation between properties of 1-g samples, caused by differences in composition, is small and that 1-g samples thus are reasonably representative of the sieved sediment as such. The variabilities between Cs include variability arising from differences between sediment composition of test tubes and errors arising from centrifugation and transfer of samples. However, the most important cause of variance, especially for the stream sediments, seems to be that the subsamples analysed were non-representative. The stream sediments, and especially the Lillebæk sediment, are much less homogenic than the pond sediment (see Figure 4.1), which may explain the problems with the determination of stream sediment concentration. The concentrations believed to be non-representative, giving calculated recoveries far exceeding 100%, were not used in the calculation of Kd. The variability between measured Cws from pairs of centrifuge tubes was small for pond sediment with standard deviation of less than 2.6% (average 1.35%) and, consequently, a subsample of the test tube content was transferred to only one centrifuge tube in the subsequent experiments with stream sediment. As described above, this procedure seems, however, to have introduced a systematic error as it is likely that mainly the smaller particles of the stream sediment were transferred to centrifuge tubes and analysed. This seems to be the explanation of the unrealistically high recoveries calculated in some experiments, especially in the sorption of pendimethalin to stream sediments. This effect is less important for less sorbing chemicals. The variance between determined activity in vials from the same centrifuge tube was 0.89% (2.67%), n=128 in the experiment with pendimethalin and pond sediment whereas it was 1.24% (7.43%), n = 89 in the remaining experiments. 5.6 Degradation experimentsDegradation experiments were conducted with stream water from Mølleåen and with the Odderbæk and Lillebæk sediments. From the initial activity CT(t=0) (calculated from amount added) and CT(t), the relative decrease in activity is calculated as (CT(t=0)-CT(t))/CT(t=0). The cause of a decrease in activity is believed mainly to be the escape of 14CO2 mineralised from the labelled pesticide. However, sorption to glass and evaporation will also cause a decrease in activity. Thus, the term “relative disappearance” is used throughout this section. The average relative disappearance from degradation experiments with 14C-labelled pendimethalin is shown with standard deviation in Figure 5.20 below. The raw data are given in Table B.26 in Appendix B. Unfortunately, the results of the determinations seem quite uncertain over time. As it can be seen, there is more or less a downward trend of disappearance, which must be attributed to uncertainties. The error seems to be systematic as the deviation between replicates is small and the development in test bottles with and without sediment is parallel. It seems as if a final level, or a period of very slow disappearance, is attained after approx. 250-500 hours. The disappearance level at high concentrations is a bit higher than at low concentrations in the pelagic experiments and the disappearance level is higher for the Lillebæk sediment than for the Odderbæk sediment. The reason for the ceasing of disappearance, or drastically lowering of disappearance rate, after 250-500 hours could be the formation of persistent metabolites, toxic effects of the pesticide, build-up of toxic metabolites, assimilation of 14C in living biomass, incorporation of 14C in organic material, exhaustion of co-substrate or sorption. According to Vestergaard (2002), no formation of persistant metabolites is known so this seems not to be the explanation. Sorption is also unlikely to be the main cause as levelling also occurs in pelagic test bottles. Furthermore, only very fast degradation rates combined with fast sorption and very slow desorption could fit the full sorption degradation model, developed in Section 5.6.1, to the data shown in Figure 5.20. It is thus considered most likely that the levelling is caused by the incorporation of 14C in biomass and organic material but the actual reason is not known. It may be noted that an initial disappearance of 9.5 to 18.5% occurs in one hour. Most likely, this is not due to biotic degradation and is attributed to the experimental procedure. It might be due to fast sorption to the glass walls of the bottle. However, sorption to glass walls has been investigated (see Appendix C) and the partition coefficient was around 0.3 L/m2. The glass walls of the bottles (r=2.75, h=11.5cm) have an inner area of approx. 230 cm2, which together with the water volume of 100 mL yields a Kd‘=0.3[L/m2] Available studies on degradation of pendimethalin are few. Singh & Kulshrestha (1991) found that fungi could dealkylate pendimethalin and reduce the nitro-groups to amines. They did not pursue the degradation pathway further. Nitrobenzenes such as pendimethalin can be reduced by Fe(II) present in soil and sediments and produced by bacteria (Klausen et al., 1995). The disappearance of ioxynil is shown in Figure 5.21.
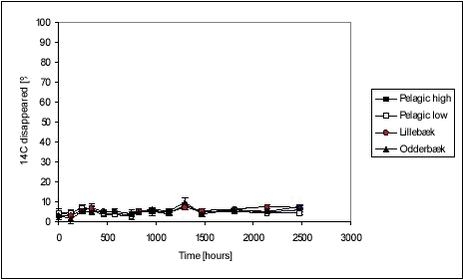
Figure 5.21 The disappearance of ioxynil is slow for “pelagic” test bottles, similar for high and low concentrations while it is higher for test bottles with sediment. The disappearance is faster for the Odderbæk sediment than for the Lillebæk sediment. The disappearance of bentazone is shown in Figure 5.22 below. Figure 5.22 The transformation of bentazone to CO2 during the 103 days of aerobic incubation was very limited. In all experiments with bentazone, less than 10% of the initial amount was transformed. There is no discernible difference between disappearance in bottles with and without sediment or high and low concentrations. Romero et al. (1996) have found that there was very little disappearance of bentazone in two Spanish soils, less than 20% in 40 days. In a thorough study by Knauber et al. (2000), it was found that 12-15% of added bentazone was mineralised immediately, 5% was methylated and afterwards demethylated, and 65-85% was hydrolylated to 8-OH-bentazone that could bind directly to soil humic substances or be dimerized and then be bound to humic substances. The residues that bind covalently with organic matter transform slowly. The rate of the transformation of residues to CO2 was three times slower than for the parent compound (Knauber et al., 2000). The degradation behaviour of the three pesticides is very different, seemingly due to the combination of sorption and degradation properties. When sediment is introduced to the water, two things occur: A sorbent becomes available for sorption, which limits the water concentration available for degradation and thus the degradation rate, and the biomass concentration is increased, which, in itself, leads to faster degradation. For the strongly sorbing pendimethalin, the addition of sediment leads to faster initial degradation rates according to modelling (Table 5.11) but also leads to a lower level of transformation. This could be due to a sorbed fraction resisting degradation. For ioxynil, which does not sorb strongly, the degradation rate increases much more with the addition of sediment and thereby biomass (Table 5.12) and no levelling occurs, indicating that sorption is less important. For bentazone, the degradation rate is very small and similar with and without sediment. Recovery The recovery was determined only for the recovery bottles. The recovery was determined as the activity at day 103 in water and stripped CO2 compared with the activity determined in the water at 1 hour. Table 5.10 Activities and recoveries for pelagic bottles (triplicates) with low pesticide concentrations
For pendimethalin, the recovery is remarkably low. If the final activity is compared with the initial activity based on added amount and not on the 1-hour measurement, it is even lower. For ioxynil and bentazone, the recovery is high. The property distinguishing pendimethalin from the two other pesticides is the sorption tendency but as there is no sorbent in these bottles, this seems unimportant. The air of the recovery bottles was not renewed during the incubation period of 103 days. 5.6.1 Fitting of model to degradation dataFor the degradation experiments involving simultaneous sorption and degradation, the sorption model must be expanded to include degradation. This is done by adding a simple first-order degradation term.
Equation 3 With this formulation, it is assumed that degradation only takes place in the aqueous phase. This assumption has been supported by the findings of many experimenters (Guerin et al., 1997; Robinson et al., 1990; Ogram et al., 1984; Zhao et al., 1999) although it has also been shown that e.g. bacteria may influence desorption (Park et al., 2001), indicating that a more complex model would be suitable. However, no complex model has been shown to be universally applicable and the more complex models usually require more parameters, which may not be available from the registration material. Therefore, the simple approach expressed in Equation 3 has been chosen for the registration model. This set of equations (Equation 3) can be solved analytically (see Appendix G) and yields a solution that, as shown in the appendix, leads to an expression for the total concentration
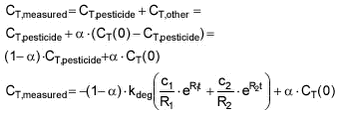
Equation 4 This model (named the full degradation sorption model) describes the sorption and degradation of the mother pesticide. But the activity measured in the degradation experiment includes activity from both labelled mother pesticide, 14C containing metabolites and 14C taken up by organisms or incorporated in organic material. Therefore, the model was modified for the pupose of deriving first-order degradation rates from the degradation experiments. The model was modified by assuming that a certain fraction of the transformed pesticide ends up in forms that remain in the suspension (metabolites, assimilated C in microorganisms, etc.) while the remaining fraction leaves the suspension as CO2. The fraction that is transformed into something other than CO2 is here named a, and a is fitted together with the other parameters. As an example, an a of 0.3 indicates that 70% of the transformed pesticide has been mineralised to CO2 while 30% of the transformed pesticide molecules has been transformed into some form still in suspension. This model, given in Equation 5, is named the partial degradation-sorption model.
Equation 5 The model was fitted to the data from the degradation studies with suspended stream sediment by two approaches. In the first approach, sorption parameters derived from the sorption experiments under reasonably similar conditions were applied leaving only the degradation rate constant kdeg to be determined. The second approach was to determine both sorption and degradation rate constants from the degradation data. In both cases, the fitting was done by minimisation of residual sum of squares. In order to be able to use the sorption and desorption rates determined in the sorption studies, in the degradation experiment (first approach), the sorption rate constant was recalculated to take account of the difference in particle concentration. ksorp,model = ksorp,exp Table 5.11 Original and recalcualted ksorp values together with initial concentrations in test bottles
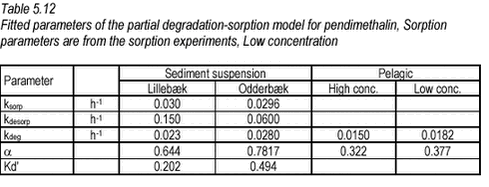
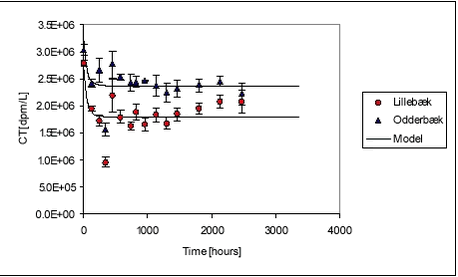
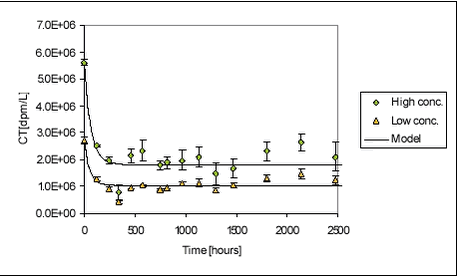
5.6.2 Fitting of model to pendimethalin degradation dataThe model was fitted to data from experiments with water and the two stream sediments. As the CT measured after one hour was somewhat lower (9.5-18.8%) than what could be calculated from added amount and concentration, and as this was most likely not due to degradation, the value measured after one hour was used as CT(0) in the model. With a slight increase in CT over time and levelling out of degradation rate, the variation in data made automatic fitting difficult. Also, the few available data in the critical first hours make the fitting uncertain. If the ksorp and kdesorp values determined from sorption experiments (Table 5.11) are considered, desorption rate is larger than sorption rate for both sediments, and as desorption never becomes limiting for degradation, no levelling will occur according to the full degradation-sorption model (a=0). Therefore, the full sorption model cannot be fitted reasonably to the data when sorption parameters determined in the sorption experiments are applied. When the full degradation-sorption model was fitted to data without restrictions on ksorp, kdesorp and kdeg, a minimum of residual sums of squares was found for ksorp=0.0137, kdesorp=0.0000101 and kdeg=0.0118. The ksorp is in the same order of magnitude as that determined in sorption studies but the kdesorp is much lower indicating a slow desorption rate and high equilibrium sorption. The parameters equal a sorption coefficient Kd‘ of 1367 or a Kd of 1.37 106 [L/kg], which is about 600 times higher than that determined in the sorption experiments. This is not realistic, considering the sorption experiment results, and it indicates that the levelling of the pendimethalin curves is not due to sorption of the type that is described by the model. As the levelling of the curve is thus likely to be caused by partial mineralisation (including incorporation in biomass etc.), the partial degradation-sorption model, given in Equation 5, was fitted to data. The application of sorption parameters determined from the sorption experiments (Table 5.11) led to the results given in Table 5.12. For the “pelagic” bottles, a simplification (ksorp = kdesorp = 0) of the partial degradation-sorption model, corresponding to a situation with no sorption, was fitted to data as the particulate matter content of the filtered natural water was believed to be low.
It should be noted that considerable variation of ksorp and kdesorp gave very little change in residuals squared as the measured data are very scarce in the critical first hours. The parameters determined by fitting are thus quite uncertain. As it can be seen, the a is somewhat smaller for the pelagic experiment reflecting the higher level of the curves. An immediate explanation of this difference could be that the sorption is only very slowly reversible so that once sorbed, the water concentration remains low and so does the degradation rate. However, initial sorption takes place within a few hours and despite this, the degradation proceeded at a high rate until 500 hours. The high particle concentration of the suspensions may increase the possibility of incorporation of 14C in organic matter leading to less mineralisation. Another plausible explanation can be found in the experimental procedure. When samples are taken from the bottles with suspended sediment, the sample will most likely contain less than average sediment. As much pesticide is sorbed to the sediment (around 20% as regards Lillebæk, 40% as regards Odderbæk), this may lead to an underestimation of the concentration and amount in the bottle and may thus explain the difference in a. It seems that the difference in a may well be caused by the experimental procedure and by the use of 14C pesticides and therefore it does not lead to any alterations of the model formulation.
Figure 5.23
Figure 5.24 5.6.3 Fitting of model to ioxynil degradation dataAs for pendimethalin, the degradation-sorption model was fitted to ioxynil data. The raw data are given in Table B.26. For ioxynil, no apparent levelling occurs and a was thus set to zero. The data obtained on ioxynil is more suitable for fitting than those obtained on pendimethalin. The measured activity decreased evenly with time and the standard deviation between test bottles was small. When sorption parameters from the sorption experiments were employed (see Table 5.11), the degradation rate constant could be fitted.
For ioxynil, the degradation rate is higher in sediment-water suspensions than in water alone, presumably due to the higher concentration of biomass. The degradation rate constant is higher for the Odderbæk than for the Lillebæk sediments, which may be attributed to differences in microbial activity. Ioxynil sorbs stronger to the Odderbæk sediment than the Lillebæk sediment but this is seemingly overshadowed by a higher microbial activity. The fitted model is shown together with measured data for sediment suspensions in Figure 5.25.
Figure 5.25 The fitted degradation in stream water without sediment is shown in Figure 5.26 below.
Figure 5.26 5.7 Particle concentration and biodegradationWhen biodegradation data from suspension experiments are to be used in modelling, one is confronted with the problem that in these experiments, sorption and degradation occur simultaneously. Therefore, the derivation of degradation rates must be made with care. Here, an approach taking both mechanisms into account has been described. The concentrations of particles can affect the biodegradation of pesticides in two ways, which may have opposite effects on the degradation of pesticides. Many bacteria live in close association with particles and the concentration of bacteria and particles may therefore be positively correlated. On the other hand, the pesticides can sorb to the particles with which the bioavailability of the pesticides is reduced at high particle concentrations. In order to take these opposite effects of particles into account the following model was developed and applied to the biodegradation and sorption experiments. The model is implemented in the user interface of the registration model, with which the dichotomy of particles and biodegradation is taken into account. 5.7.1 Model set-upThe rationale behind the model is: From the user interface, a degradation rate (h-1) and the particle concentration of the experiment are available. The degradation of the total concentration of pesticide is described by the following differential equation:
where Ctot denotes the total pesticide concentration and ktot a first-order degradation rate. According to the model, the pesticides may either be dissolved or sorbed to particles. The sorption is assumed to be linear, reversible and instantaneous yielding the expression:
where Cs is the concentration (in relation to the dry mass of sorption medium) of sorbed substance (kg/kg), Cw is dissolved substance concentration (kg/L) and Kd is the sorption coefficient (L/kg). A mass balance for the substance is:
where θ is the volume fraction of water, Ï is the dry bulk density of the sorption medium (kg/L). A combination of (2) and (3) yields:
where R is defined as a retention factor. It is further assumed that bacteria are only able to assimilate dissolved pesticides and not pesticide sorbed to particles. The degradation of dissolved pesticide is then given be the following differential equation:
Where kdis denotes a first-order degradation rate for the dissolved pesticide. Combining equations (4) and (5) yields:
Combining equations (1) and (6) yields:
Assuming that the bacterial activity per volume of particles is constant and that the activity of pelagic bacteria is constant, kdis can also be written as:
Where K1 denotes a relative activity of the free-living “pelagic” bacteria and K2 is a particle volume-specific activity of the bacteria associated with particles. K3 denotes a pesticide-specific degradation rate per bacterial activity. Combining (7) and (8) yields:
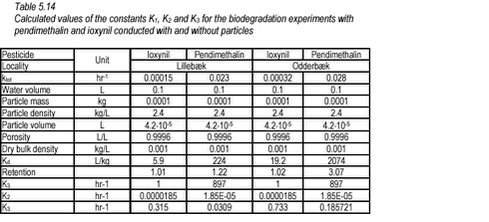
For the experiments without particles (pelagic), equation (9) is reduced to: For ioxynil, K3 is set to 1 and K1 is then equal to the first-order degradation rate measured in the experiment without particles. Subsequently, K3 for pendimethalin can be calculated as the ratio of the first-order degradation rates of pendimethalin to ioxynil measured for the experiments without particles. When K1 and K3 are known, K2 can be calculated. Applying the above equations and rationale to the results of Tables 5.12-5.13, the following results are obtained (Table 5.14).
On the basis of the constants of Table 5.14, an extrapolation to a natural aerobic sediment with a porosity of 0.75 was conducted. If a median value of 0.25 for K2 is used, the degradation rates, shown in Table 5.15, are obtained.
|
