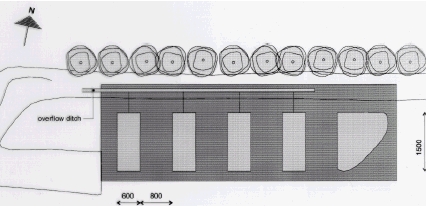
Fate of Pesticides in Surface Waters, Laboraty and Field Experiments7 Materials and methods, field experiments7.1 Experimental ponds7.2 Spraying of pesticides 7.3 Sampling techniques 7.3.1 Water samples 7.3.2 Sediment samples 7.4 Methods of analysis 7.4.1 Water samples 7.4.2 Sediment samples Four experiments were carried out in the mesocosm facilities of NERI (National Environmental Research Institute). The five pesticides used in these experiments are given in Table 2.1. The pesticides were selected to cover a range of physico-chemical properties in order to strengthen the generalisation value of the model. It was expected that the more hydrophilic compounds (bentazone and ioxynil) would readily be mixed into the water column while the more hydrophobic compounds might show a vertical concentration gradient (Mogensen et al., 2002; Sørensen et al., 2002). Sorption of pesticides to sediment was studied in experiments with highly sorbing compounds (fenpropimorph, pendimethalin and glyphosate). The impact of macrophytes on the dissipation of pesticides from the water phase was studied in one experiment (fenpropimorph and pendimethalin). 7.1 Experimental pondsThe mesocosm facilities at NERI consist of four ponds with a bottom area of about 90 m2 and a depth of about 1 m. The mesocosm facilities were established in November-December 1994. NERI is situated at the peninsula of Risø at Roskilde Fjord 8 km north of Roskilde, Sealand, Denmark. The mesocosms are established in an area with heavy clay making it possible to retain water in the ponds without assistance of an artificial membrane. Figure 7.1 provides an overview of the experimental area. For further information about the establishment of the ponds, see Mogensen et al. (2002). For the current experiment, two ponds, ponds 3 and 4, were sprayed with pesticides and one pond, pond 2, was used as a control. The ponds are mature with a variety of plant and animal species.
Figure 7.1 In one experiment, a screen made of polyethylene fast lock plates was mounted to divide one pond into two separate ponds with identical conditions. A gap in the partition wall was left open until two days before spraying in order to allow mixing of water from the two separate parts. In one part, all macrophytes were removed or cut down to a few cm about two weeks before spraying. The removed macrophytes were dried and weighed. Average amount of removed macrophytes was 713 g dry matter per square meter. The actual depth of the ponds changes according to climatic conditions. Table 7.1 includes measured depth of the ponds during the experiments.
7.2 Spraying of pesticidesPesticides were sprayed onto the surface of the ponds using an 8-m hand-carried spraying boom. Pesticides were mixed with 10 L of tap water in a steel bottle and all of the mixture was applied uniformly onto the surface of the pond. All pesticide solutions were prepared from formulated products: Basagran (bentazone) from BASF, Totril (ioxynil) from Rhône-Polenc, Corbel (fenpropimorph) from Novartis, Stomp SC (pendimethalin) from Cyanamid, Roundup Bio (glyphosate) from Monsanto. Table 7.2 provides an overview of the amount of active ingredient applied in each of the four experiments and the initial nominal concentration of pesticide in the water. The nominal concentration assumes even distribution of pesticide within the water body.
7.3 Sampling techniques7.3.1 Water samplesWater samples were collected from the bank. A Duran red cap bottle was equipped with two silicone tubes, a short one for letting water into the bottle and a long one for letting air out of the bottle. The bottle was attached to a long fishing rod by adjustable lines allowing the sampling bottle to be lowered into the pond and samples to be collected at a desired depth. Water samples were combined from different positions and depths for average concentration measurements. Gradient samples were collected from two or three depths. 7.3.2 Sediment samplesTop sediment from the control pond was sieved through a 2-mm mesh and mixed into a homogeneous mixture. Sediment was placed in trays made of perforated stainless steel lined with nylon tissue. The sediment layer was two cm deep. The sediment trays were placed in a big stainless steel tray and lowered to the bottom of the ponds prior to spraying. The sediment trays were collected one by one as indicated in the sediment graphs. 7.4 Methods of analysis7.4.1 Water samplesIoxynil, bentazone, fenpropimorph and pendimethalin were analysed by the same method of analysis. Water samples were extracted by solid phase extraction using Porapak RDX cartridges 500 mg. Samples were eluted using 2 x 5 mL dichloromethan/methanol (80:20) for bentazone and ioxynil analyses and with 2 x 5 mL 100% dichloromethane for pendimethalin and fenpropimorph analyses. The extracts were reduced under a stream of nitrogen. A detailed description of the method of analysis is available in the report from subproject 8. Glyphosate. All samples were analysed by Danish Institute of Agricultural Sciences (Spliid, 2002). The analytical principles are outlined below. Water samples: The amino group in the glyphosate and AMPA molecules was derivatised under basic conditions followed by extraction with a mixture of dichloromethane and methanol. The solvent was discarded, the water phase was acidified and extraction was repeated. The organic phase was evaporated to dryness and the bottle rinsed with dichloromethane. The derivatives were released from the glass surface with methanol/water. Separation and detection of the derivatives were carried out by HPLC followed by electrospray (ESI) ionisation and mass-spectrometry. Detection limits (DL) for AMPA and glyphosate were 0.01-0.02 µg/L in lysimeter water. It is assumed that the same detection limits apply for pond water. Day-to-day method uncertainty was about 20%. 7.4.2 Sediment samplesFenpropimorph and pendimethalin. Sediment samples were freeze-dried and homogenised. 5.0 g of dry sediment was weighed into a teflon tube adding 100 µL of 1000 ng/L isodrin as a recovery standard. The acetone solvent was evaporated. 20 mL of acetone was added as extraction solvent. The tube was closed and the extraction procedure carried out in a microwave oven. After extraction, the samples were allowed to settle for 45-60 min before they were removed from the oven. The extract was transferred to a 1000-mL round-bottom flask using a pasteur pipette. Volume of the extract was reduced by rotor evaporation and transferred to a 16-mL dram glass and further reduced to about 75 µL with a flow of nitrogen using 1000 µL of isooctane as a keeper. 5 mL of hexane was added to the remaining extract. This extract was cleaned up on a florisil column. Columns were conditioned with 10 mL of 10% ethylacetate in hexane followed by 10 mL of hexane. The extract was added to the column, which was eluted with 10 mL of 5% ethylacetate in hexane. Run through and eluate were combined and the volume reduced to about 75 µL using isoctane as a keeper. Hexachlorobenzene was added as an internal standard and volume adjusted to 1 mL. Analysis was performed using GC-MS. Detection limits (DL) for fenproprimorph were 5.2 µg/kg dry matter and for pendimethalin 1.6 µg/kg dry matter. Standard deviations within batch/between batches were 4.3/12.2% for fenpropimorph and 5.4/5.8% for pendimethalin. Glyphosate. Sediment samples were initially extracted by basic extraction. After extraction, the analysis followed the method described for water samples. Detection limits (DL) for AMPA and glyphosate were 0.5-1.0 µg/kg in soil. It is assumed that the same detection limits apply for sediment. Day-to-day method uncertainty was about 20%. |